Method for Predicting Outputs of Photovoltaic Devices Based on Two-Dimensional Fourier Analysis and Seasonal Auto-Regression

Inactive Publication Date: 2013-10-03
MITSUBISHI ELECTRIC RES LAB INC
View PDF3 Cites 68 Cited by
  • Summary
  • Abstract
  • Description
  • Claims
  • Application Information

AI Technical Summary

Problems solved by technology

The rationale behind such a data-driven method is that the influences of the aforementioned parameters o

Method used


Image

  • Method for Predicting Outputs of Photovoltaic Devices Based on Two-Dimensional Fourier Analysis and Seasonal Auto-Regression
  • Method for Predicting Outputs of Photovoltaic Devices Based on Two-Dimensional Fourier Analysis and Seasonal Auto-Regression
  • Method for Predicting Outputs of Photovoltaic Devices Based on Two-Dimensional Fourier Analysis and Seasonal Auto-Regression

Examples


Embodiment Construction

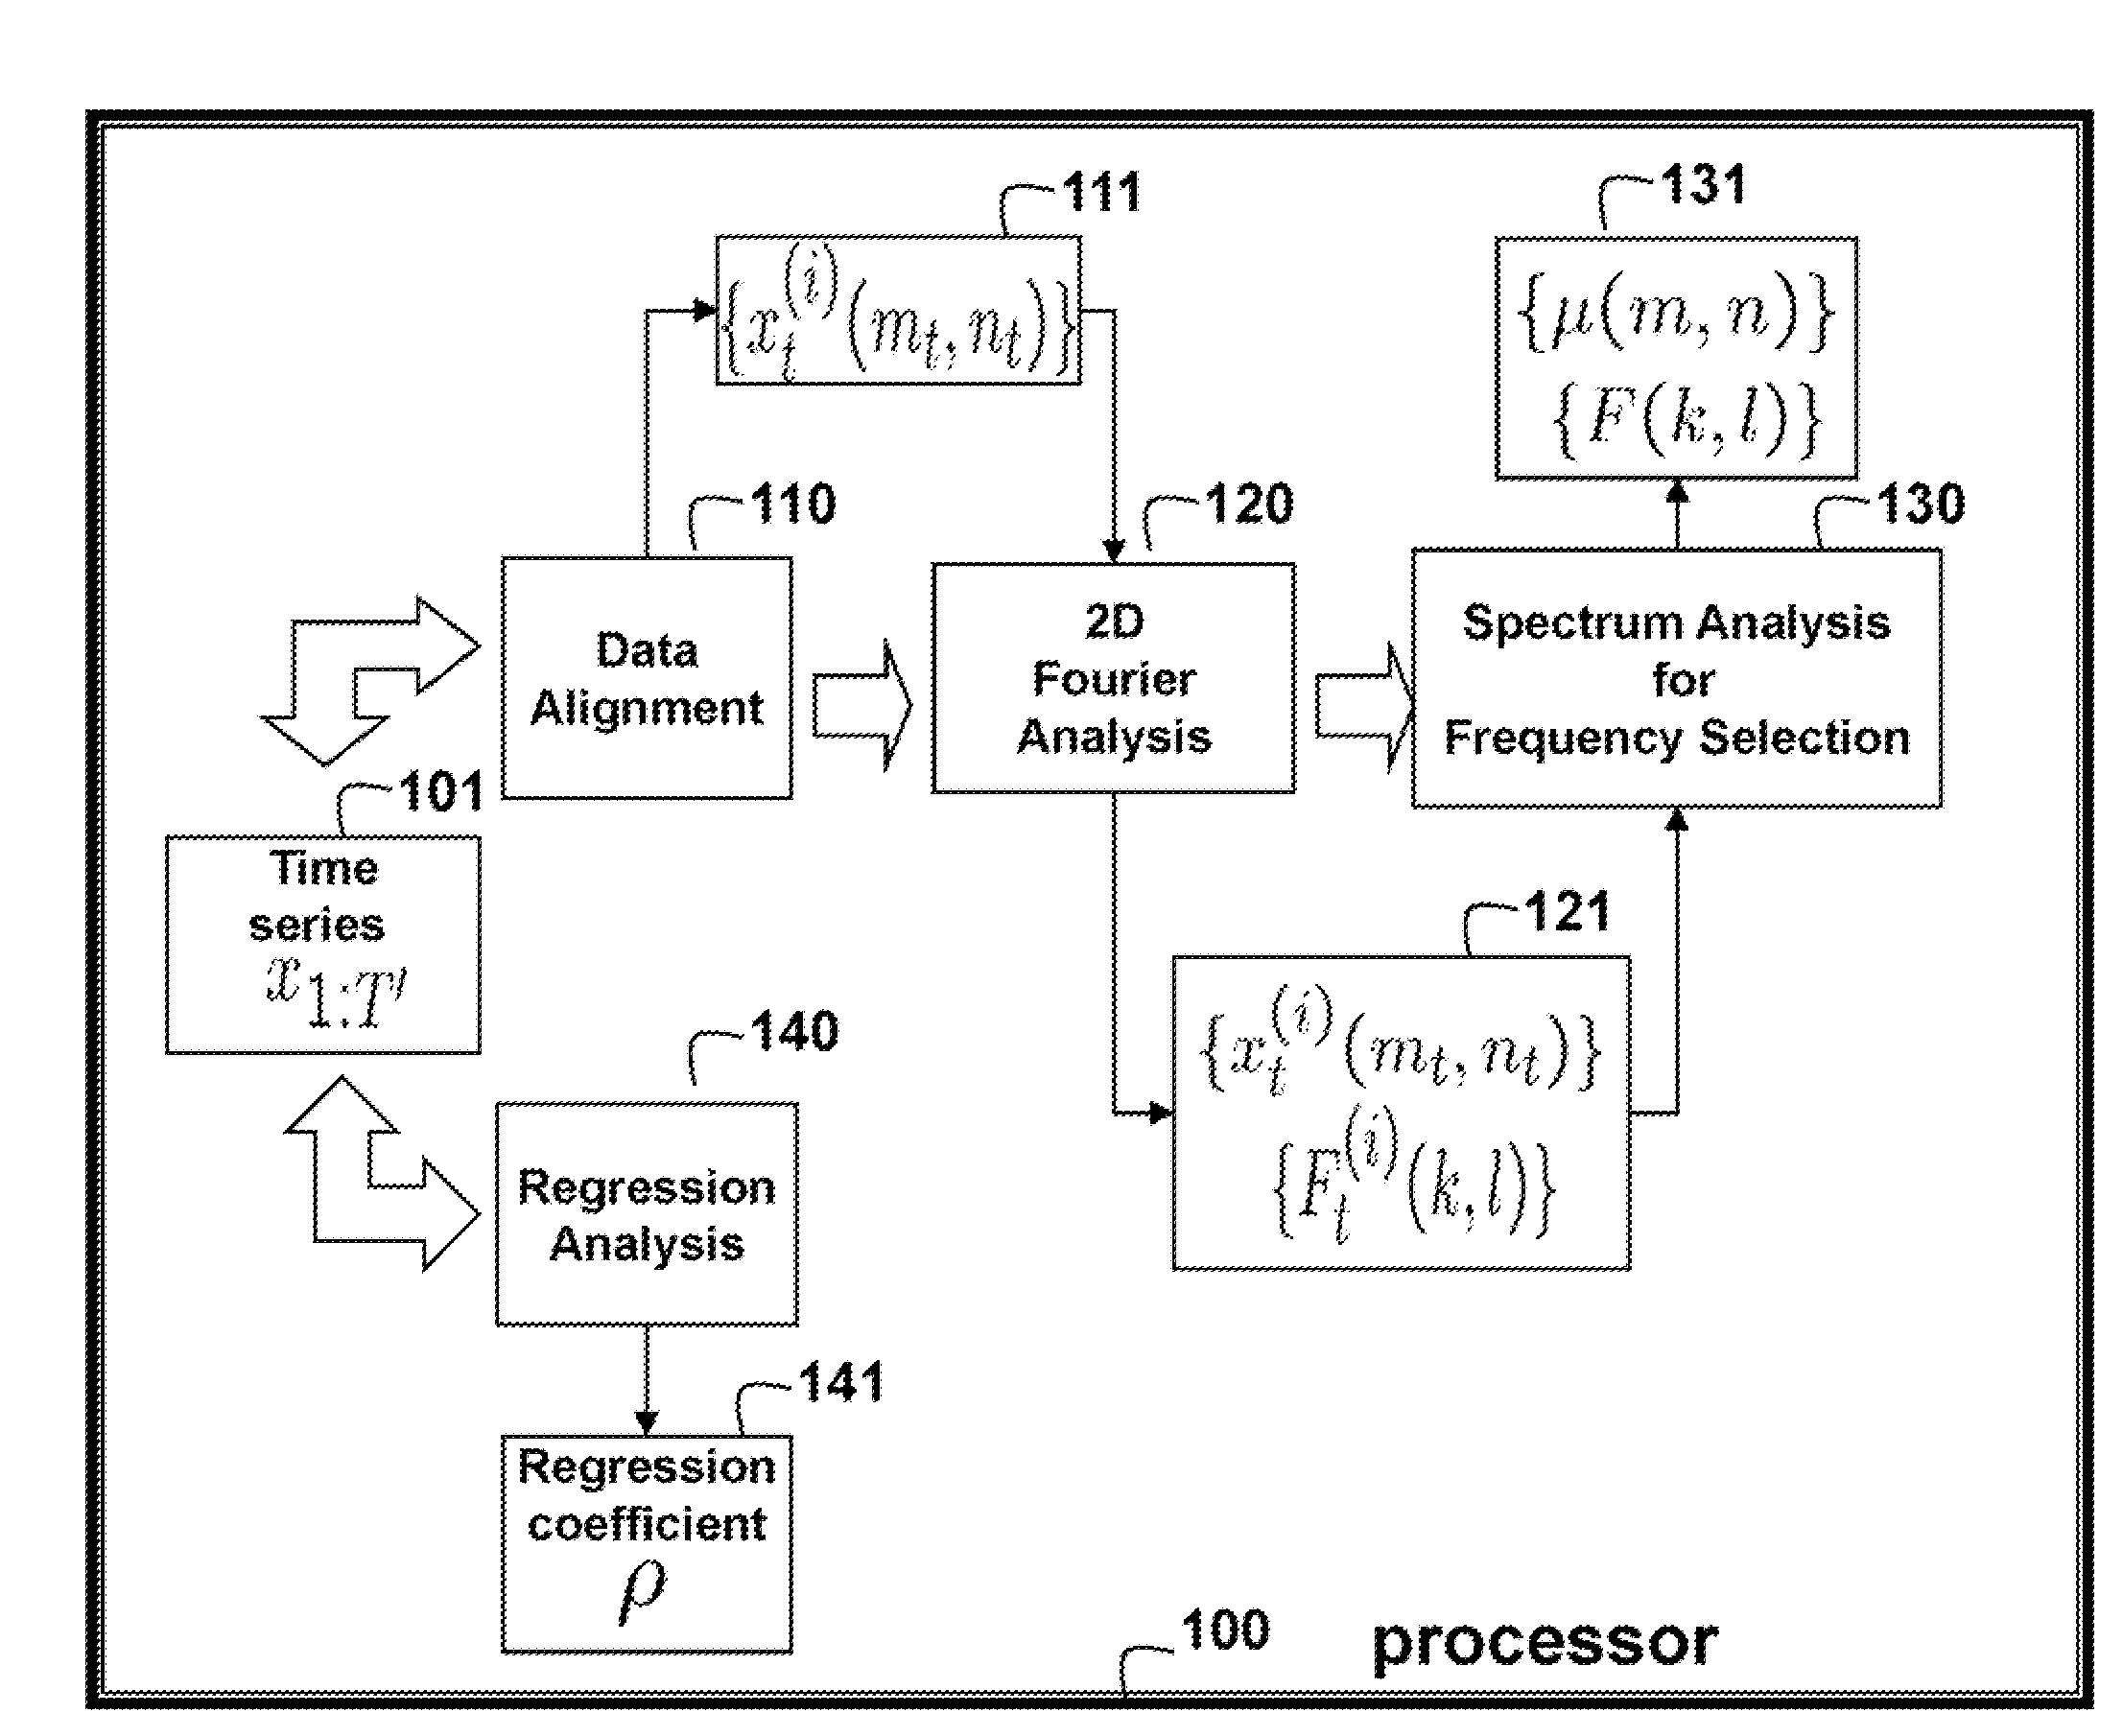
[0021]As shown in FIG. 1, the embodiments of our invention provide a method for predicting an output of a photovoltaic (PV) device. The method operates on historical time series data 101.

[0022]Statistics of the time series data represents contributions of spectrum frequencies to PV generations. Frequencies 121 of the time series data are obtained by a Fourier analysis 120.

[0023]The Fourier analysis explicitly takes into account daily and annual variations in the time series data. Therefore, the data are aligned 110 two-dimensionally (2D) according to the days in a year and hours in a day, and Fourier transformed frequencies are obtained.

[0024]The 2D Fourier analysis reveals how frequencies in daily and annual variations impact the PV generations in a quantitative manner.

[0025]Furthermore, by using spectrum analysis 130 on the Fourier transformed data, we determine the frequencies 131 that substantially contribute to the output of the PV device.

[0026]Thus, the dominating frequencies ...


PUM


Abstract

An output of a photovoltaic (PV) device is predicted by applying Fourier analysis to historical data to obtain frequencies and a mean of the frequencies in the data. Regression analysis is applied to the data to obtain a regression coefficient. Then, the prediction is a sum of the mean at the time step and a deviation from the mean at a previous time step, wherein the means are represented and approximated by selected frequencies, and the deviation for the previous time step is weighted by the regression coefficient.

Description

FIELD OF THE INVENTION[0001]This invention relates generally to predicting an output of a power generator, and more particularly predicting the output of photovoltaic devices using the daily and annual patterns in data series of historical outputs of the devices.BACKGROUND OF THE INVENTION[0002]The use of renewable energy resources by energy providers is increasing. The estimated grid-connected photovoltaic (PV) capacity increased at an annual average rate of 60% from 2004 to 2009, and is the fastest growing energy generation technology in the world.[0003]Increasing the PV capacity can have a major impact on reducing carbon emissions. Therefore, the use of renewable power resources including PV devices has been encouraged by world governments via taxes and subsidies. However, because the outputs of PV devices and other renewable resources are highly volatile, their increased use can also cause reliability issues.[0004]One approach to managing this unreliability is to use a risk cont...

Claims


Application Information

Patent Timeline
IPC IPC(8): G06F17/14
CPCG06Q50/06H02J3/383H02J2003/007Y02E10/563Y02E10/566Y02E60/76G01W1/10G06F17/141Y04S40/22H02J2203/20H02J2300/24H02J3/381H02J3/004Y02E10/56Y02E60/00Y04S40/20Y04S10/50
Inventor ZHANG, WEIHONGNIKOVSKI, DANIEL NIKOLAEV
Owner MITSUBISHI ELECTRIC RES LAB INC
Why Eureka
Try Eureka