Animated transitions for data visualization

Active Publication Date: 2008-08-14
MICROSOFT TECH LICENSING LLC
View PDF9 Cites 208 Cited by
  • Summary
  • Abstract
  • Description
  • Claims
  • Application Information

AI Technical Summary

Benefits of technology

[0009]Consequently, the animation provided by the Charting Animator avoids abrupt changes that can be disorienting to users. Examples of the animations provided by the Charting Animator include animating changes from one chart family to another (e.g., changing a “Bar Chart” into a “Pie Chart”, etc.), changes from one chart type within a chart family to another chart type (e.g., changing from a “2D Bar Chart” into a “3D Bar Chart” or a “Stacked Bar Chart”, etc.), changes to data, etc. In general, these animations are timed to occur over a relatively short period of time that allows the user to visually perceive changes to displayed charts while being sufficiently short in time so that users do not perceive that they are waiting for the system. However, any desired animation length, including varying length for different types animations are enabled by the Charting Animator.
[0010]Further, in various embodiments, elements of the displayed charts are user selectable and provide direct interactive feedback with the underlying data. For example, in various embodiments, the Charting Animator provides the

Problems solved by technology

One of the problems with simply replacing one chart with another is that the user doesn't really get a sense of how the data has changed, especially if those changes are subtle or if they involve mul

Method used


Image

  • Animated transitions for data visualization
  • Animated transitions for data visualization
  • Animated transitions for data visualization

Examples


Embodiment Construction

[0023]In the following description of various embodiments of the present invention, reference is made to the accompanying drawings, which form a part hereof, and in which is shown by way of illustration specific embodiments in which the invention may be practiced. It is understood that other embodiments may be utilized and structural changes may be made without departing from the scope of the present invention.

[0024]1.0 Exemplary Operating Environment:

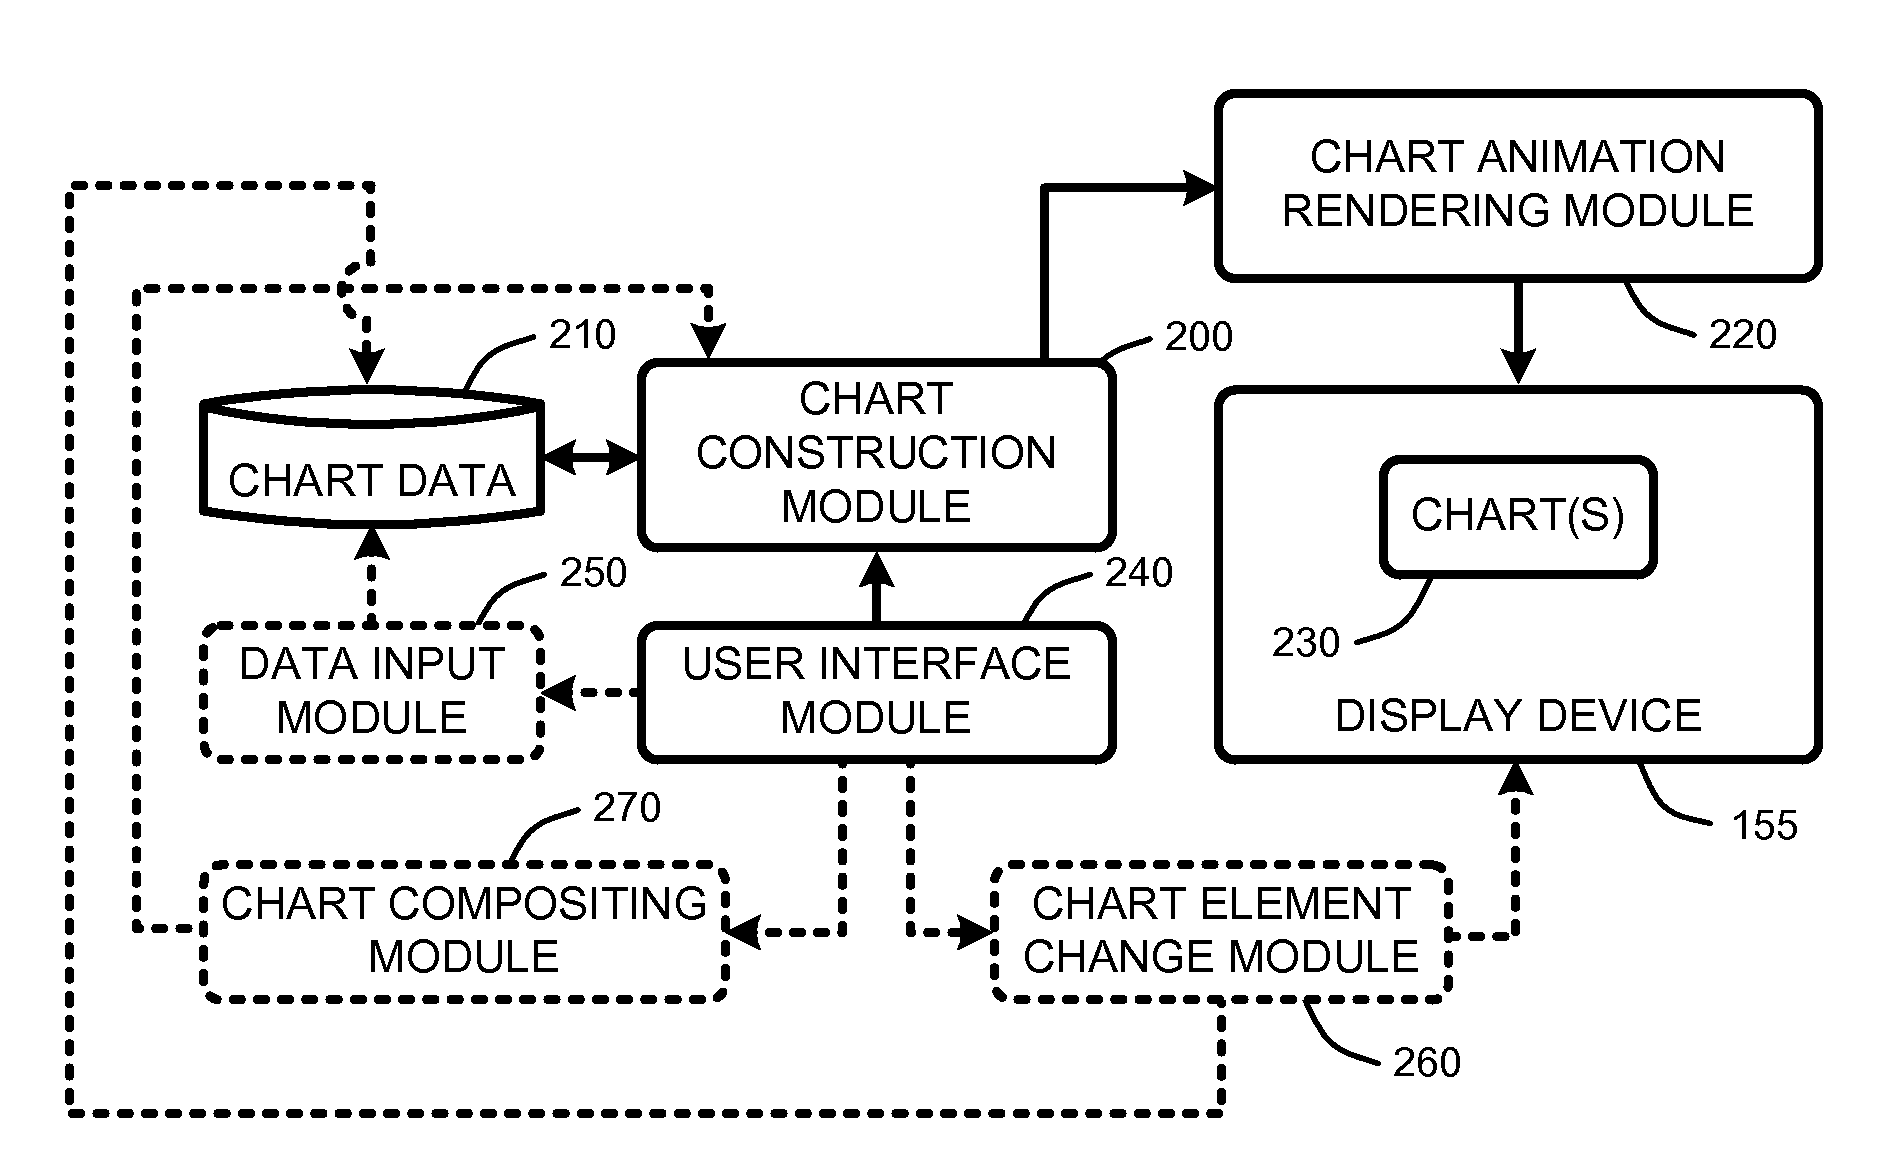
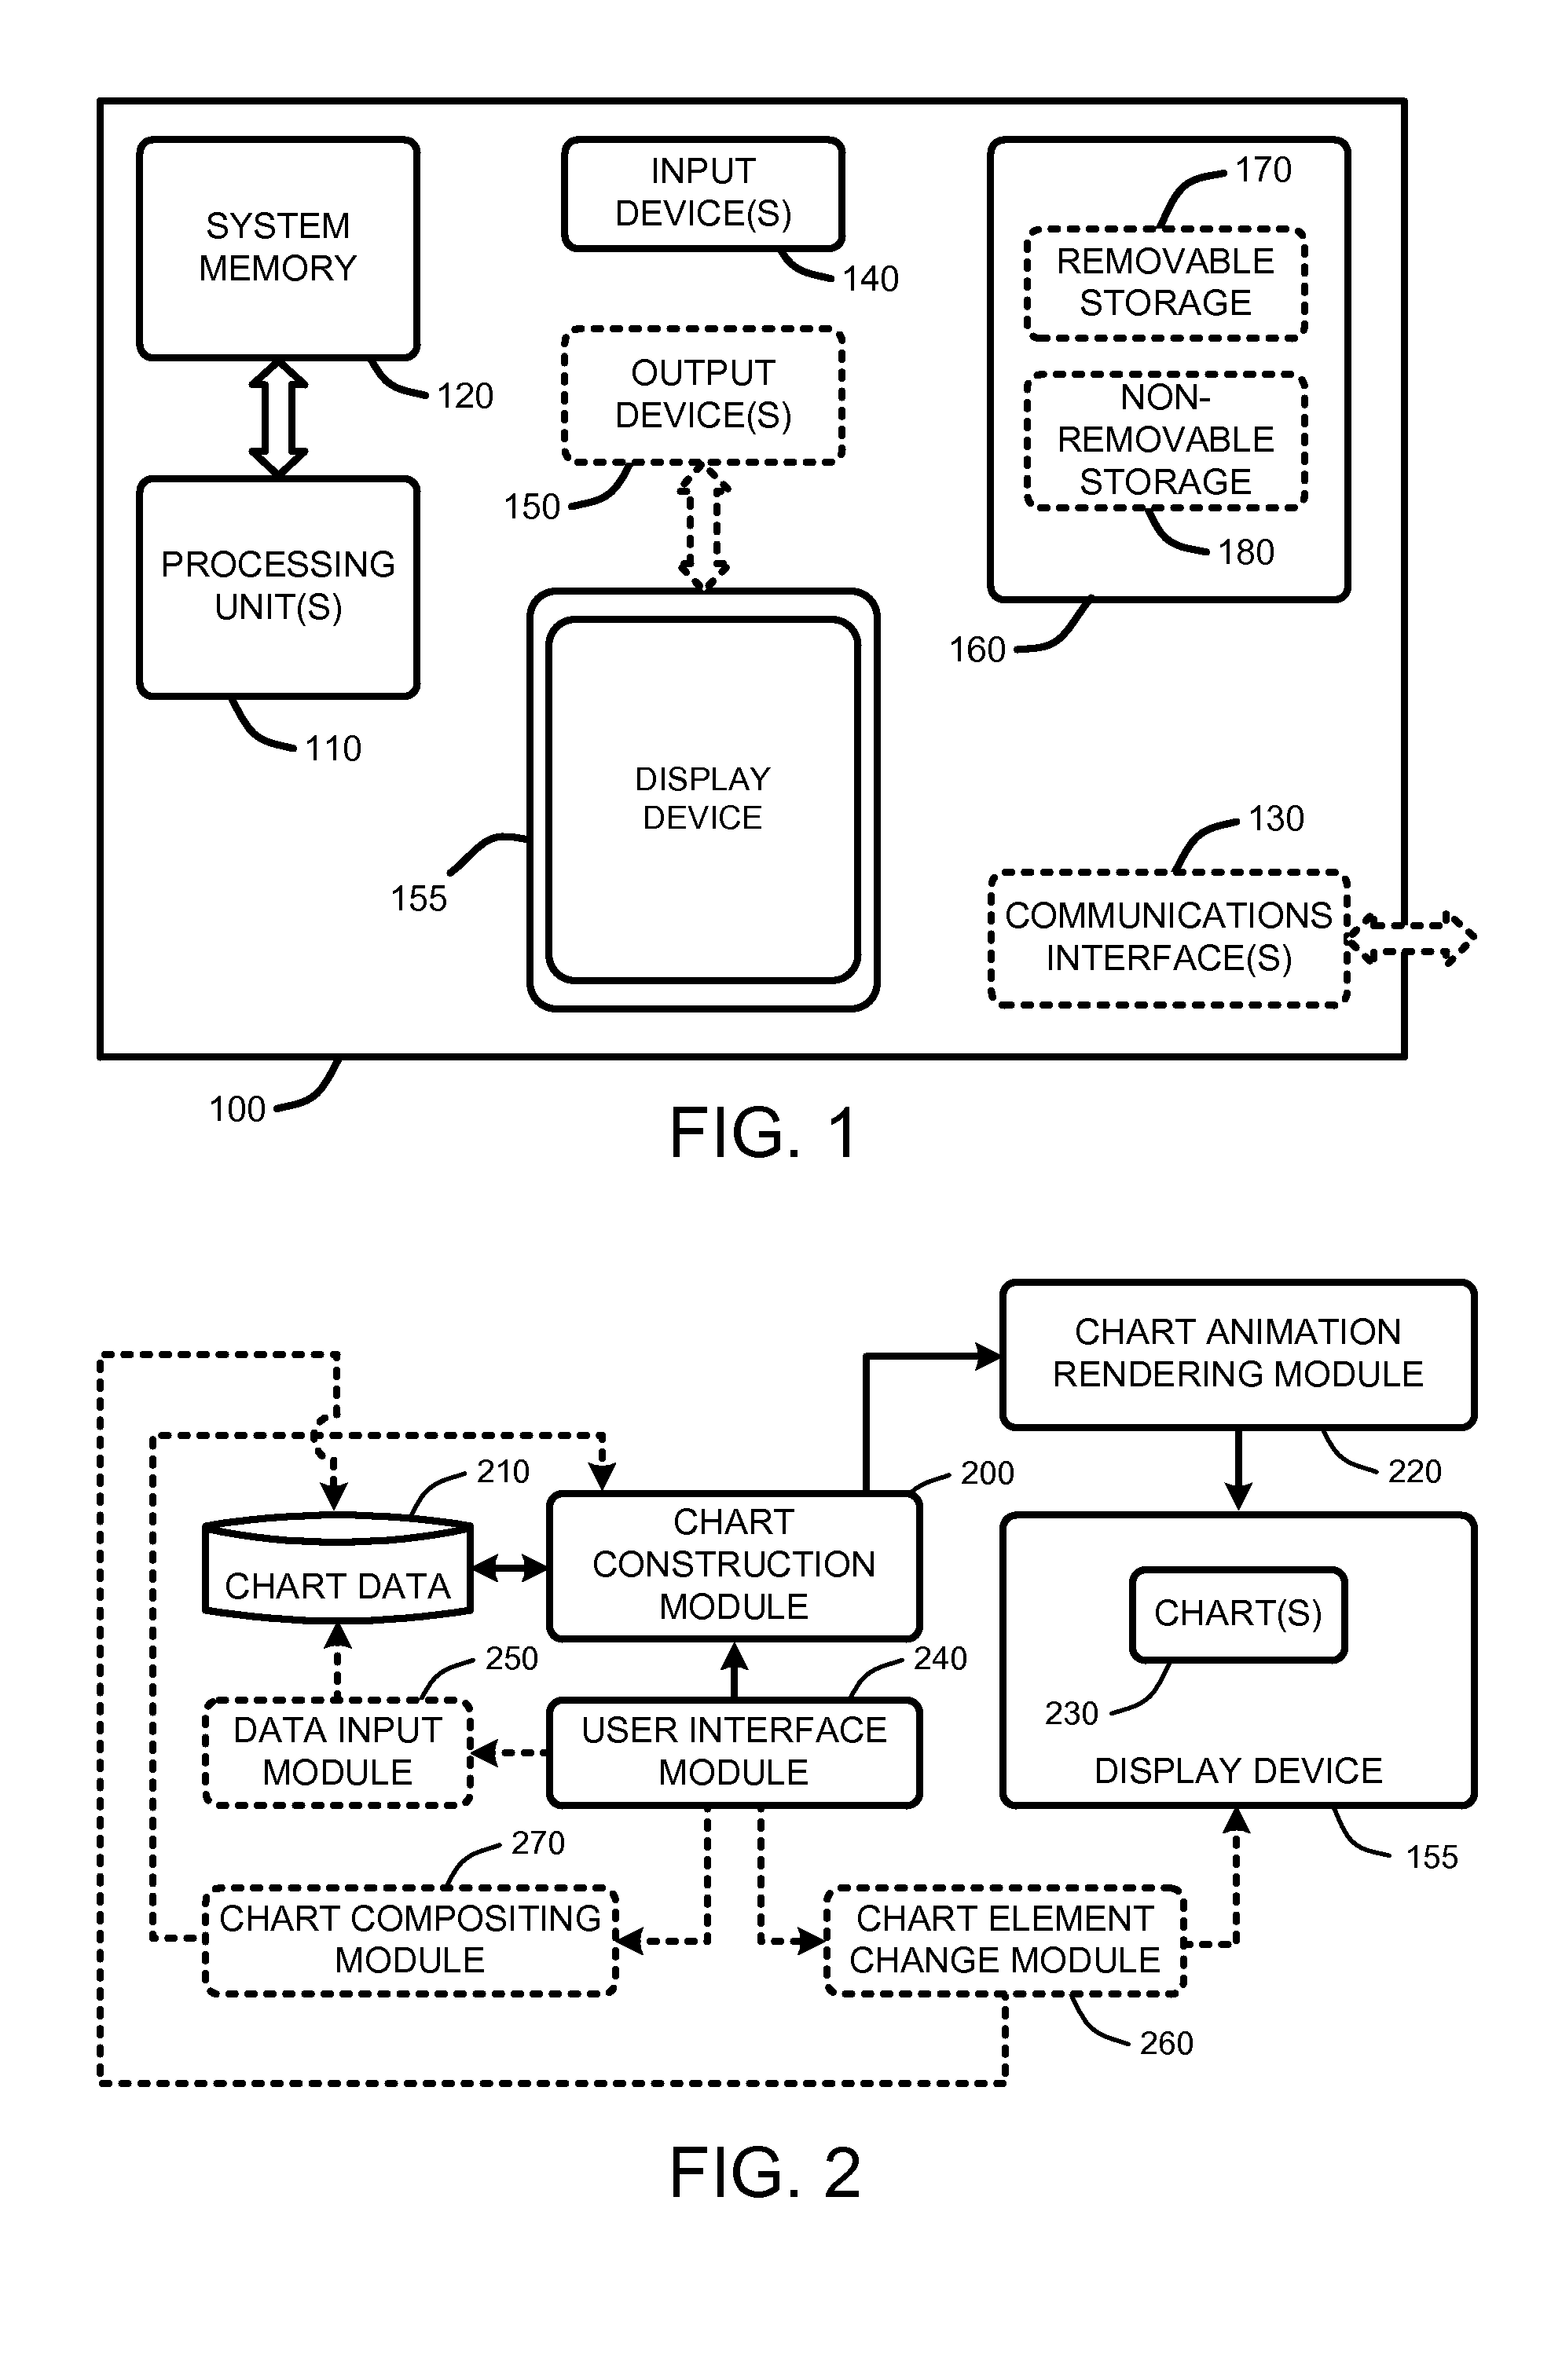
[0025]FIG. 1 illustrates an example of a simplified computing environment on which various embodiments and elements of a “Charting Animator,” as described herein, may be implemented. It should be noted that any boxes that are represented by broken or dashed lines in FIG. 1 represent alternate embodiments of the simplified computing environment, as described herein, and that any or all of these alternate embodiments, as described below, may be used in combination with other alternate embodiments that are described throughout this docume...


PUM


Abstract

A “Charting Animator” enhances computer-based charting/graphing systems by rendering dynamic animations of chart displays. In general, when a user changes from one chart type to another, adds new data to a chart, or changes, sorts or deletes data, a new chart is generated to replace the old chart. Conventional charting systems simply replace the existing chart with the new chart. In contrast to conventional systems, the Charting Animator renders animated transitions that dynamically morph the original chart into the new chart. Consequently, these animations avoid abrupt changes that can disorient users. Examples of these animations include animating changes from one chart family to another (e.g., changing from a “Bar Chart” to a “Pie Chart”), animating changes from one chart type within a chart family to another chart type (e.g., changing 2D Bar Charts to 3D Bar Charts or Stacked Bar Charts), animating data changes, animating sorts, etc.

Description

BACKGROUND[0001]1. Technical Field[0002]The invention is related to computer-based data charting and graphing, and in particular, to a system for automatically animating transitions when changing from one chart or graph type to another and / or when changing data values associated with those charts and graphs.[0003]2. Related Art[0004]Computer-based charting and graphing software tools are well known to those skilled in the art. Such software tools are often used to generate data displays such as, for example, pie charts, bar charts, data graphs, etc. Conventionally, these types of software tools allow a user to select or enter one or more data sets, and then select a chart type for rendering a chart or graph display of that data. Then, whenever a user changes from one chart type to another, or whenever data is added or changed, a new chart is rendered and the original chart is simply replaced by the newly rendered chart.[0005]One of the problems with simply replacing one chart with a...

Claims


Application Information

Patent Timeline
IPC IPC(8): G06T11/20G06T13/80
CPCG06T13/80G06T11/206
Inventor ROBERTSON, GEORGE G.FERNANDEZ, ROLAND L.HOLM-PETERSEN, MORTEN
Owner MICROSOFT TECH LICENSING LLC
Why Eureka
Try Eureka