
Predicting IC manufacturing yield based on hotspots

a technology of manufacturing yield and hotspots, applied in stochastic cad, cad techniques, instruments, etc., can solve the problems of significant increase in manufacturing costs, significant decrease in manufacturing yield, and increase in manufacturing costs

Active Publication Date: 2008-11-27
SYNOPSYS INC
View PDF68 Cites 20 Cited by
  • Summary
  • Abstract
  • Description
  • Claims
  • Application Information

AI Technical Summary

Benefits of technology

[0013]One embodiment of the present invention provides a system that predicts a manufacturing yield of a chip. During operation, the system first receives a chip layout. Next, the system identifies hotspots within the chip layout, wherein a hotspot is a location within the chip layout wherein a yield-indicati...

Problems solved by technology

On the flip side, the constant drive towards ever-decreasing feature sizes has led to a significant increase in manufacturing costs.
One of the main causes of the increasing manufacturing costs is a significant decrease in manufacturing yield.
IC manufacturing processes typically involve complex physical and chemical interactions.
Because it is impossible to control these complex physical and chemical interactions perfectly, yield-indicative variable values tend to fluctuate around corresponding nominal values, leading to systematic yield loss.
However, the feasibility of the CDF approach for predicting yield depends on the availability of the yield-indicative variable distributions.
Unfortunately, it is very difficult to perform yield prediction using the CDF approach because of the difficulties in obtaining the yield-indicative variable distributions.
These difficulties arise for a number of reasons.
(1) Precise process parameter distributions are extremely difficult to obtain due to both technical difficulties and proprietary information issues.
Because raw measurement data of the yield-indicative variables are extremely difficult to obtain from the fabrication plant (FAB) due to both technical difficulties and proprietary information issues, people tend to make assumptions and approximations about this data in order to use the CDF approach.
Unfortunately, the errors introduced by these assumptions are typically quite unstable and unpredictable.

Method used


Image

  • Predicting IC manufacturing yield based on hotspots
  • Predicting IC manufacturing yield based on hotspots
  • Predicting IC manufacturing yield based on hotspots

Examples


examples

[0103]We now present a few illustrative numerical examples to demonstrate the performance of the proposed yield prediction technique.

[0104]In these experiments, we study two hotspots, which are associated with failure rates of fr1=7.22% and fr2=31.09%, respectively. However, note that the proposed technique can be applied to any number of hotspots. The spatial correlations and variances of the yield-indicative variable on these two hotspots can be obtained from the covariance matrix Σ=[4, 0.81; 0.81, 9]. Moreover, the mean values of the yield-indicative variable on these two hotspots can be obtained from process simulation with nominal condition. In these experiments, the mean values are set as p=[3.8; 5.7]. Based on the given hotspot definitions, manufacturing bounds can be obtained. In these examples, we set the lower bound to be l=0, and upper bound to be u=7.

[0105]We further assume a few real distributions on these two hotspots, for example, a Rayleigh distribution with given me...


PUM


Abstract

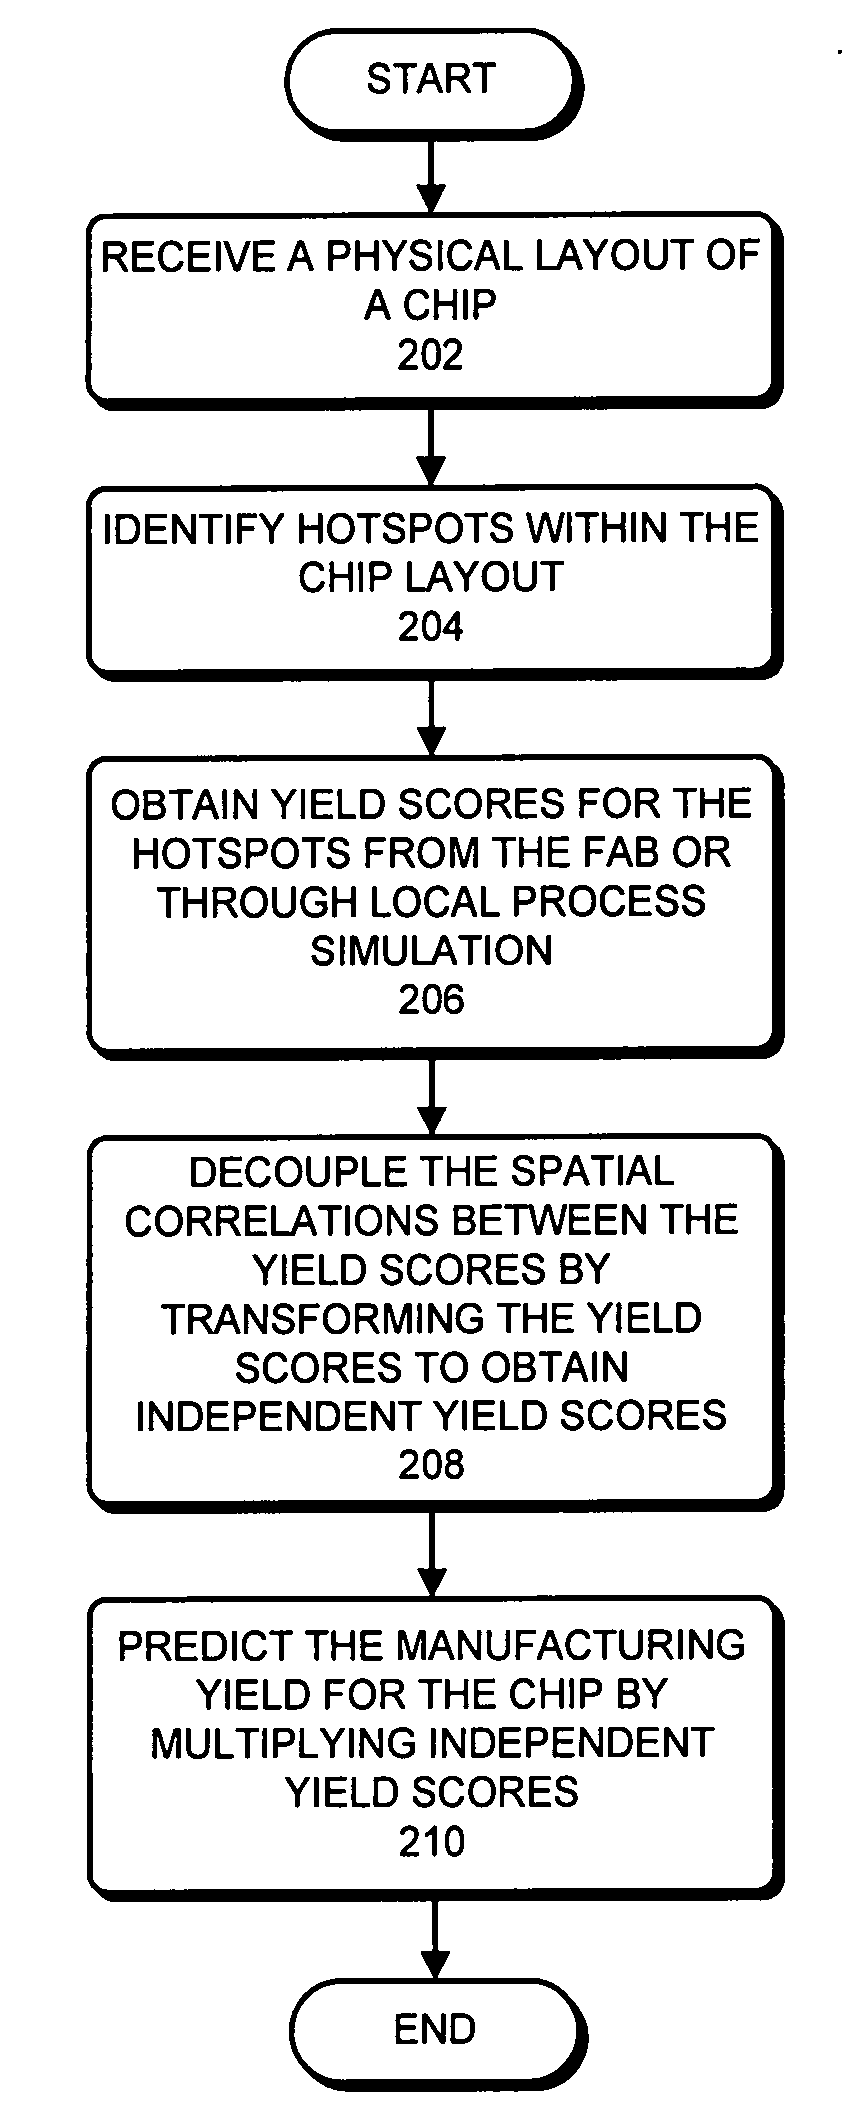
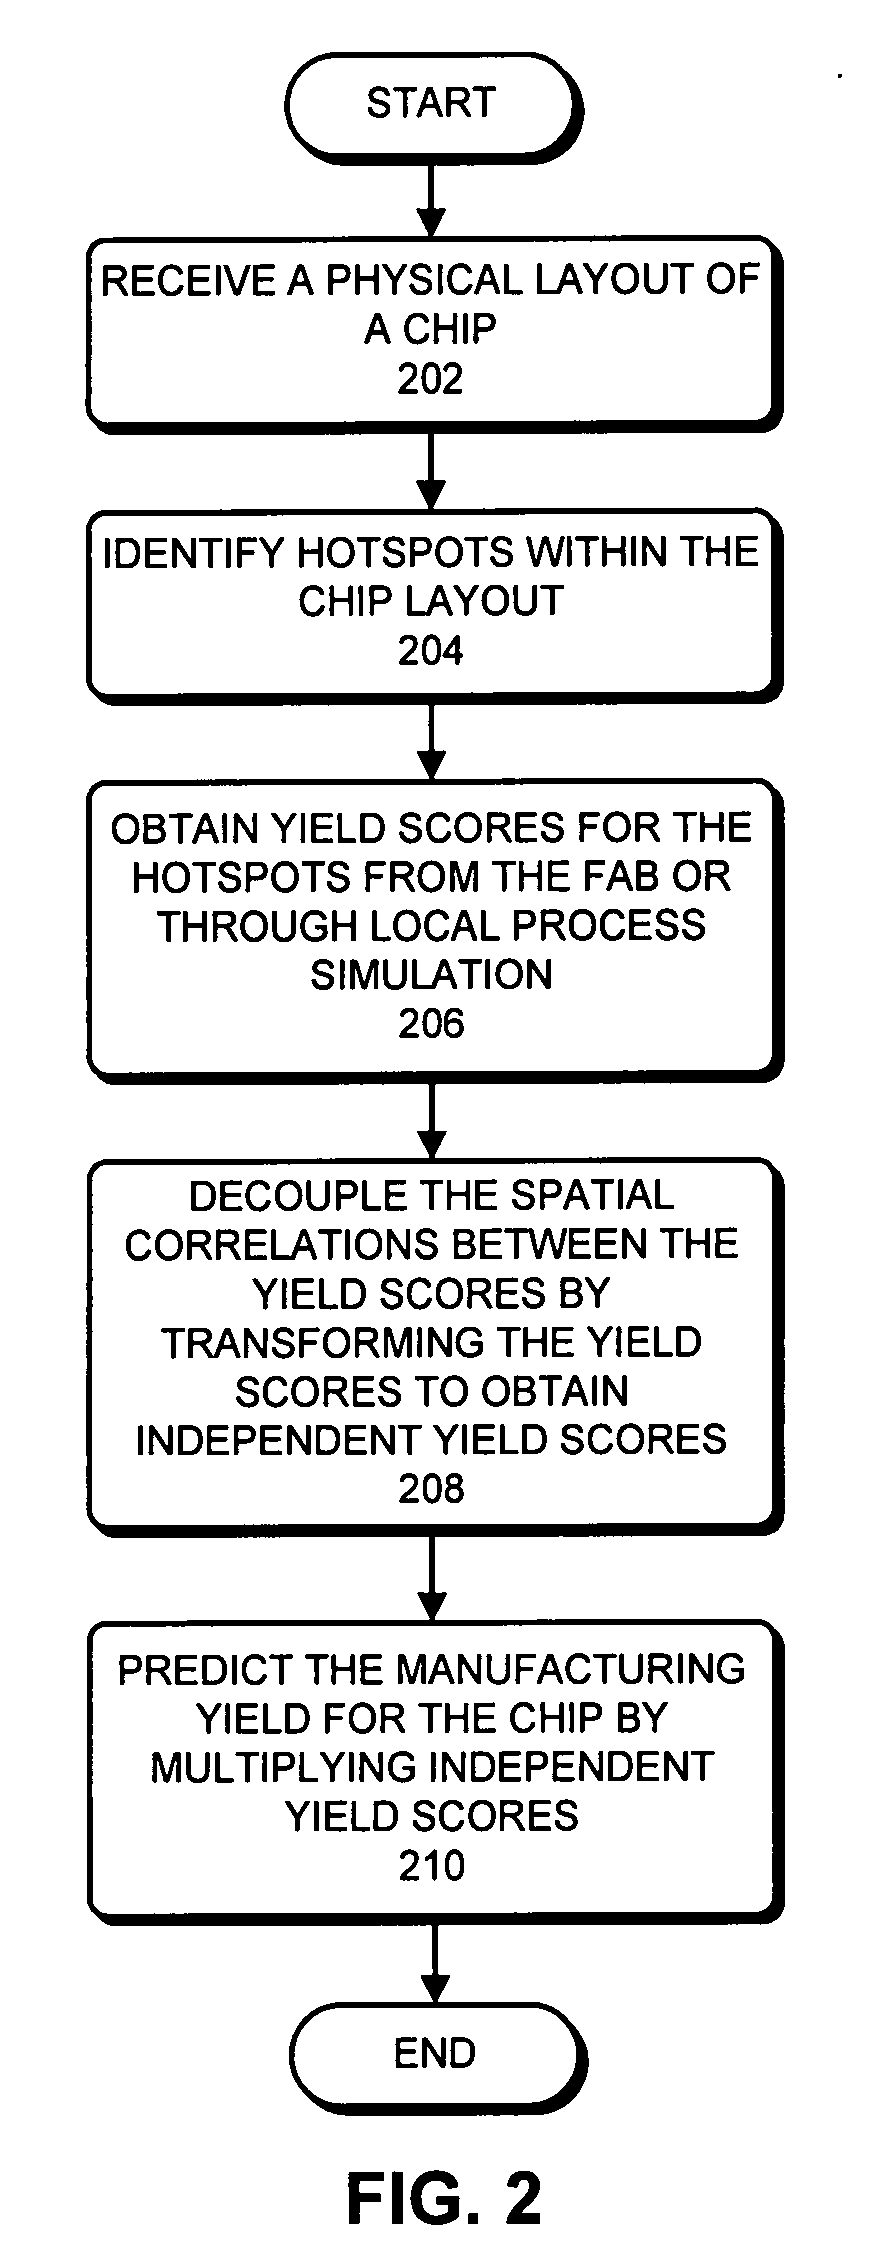
One embodiment of the present invention provides a system that predicts a manufacturing yield of a chip. During operation, the system first receives a chip layout. Next, the system identifies hotspots within the chip layout, wherein a hotspot is a location within the chip layout wherein a yield-indicative variable value falls in a low manufacturable range. The system then obtains yield scores for the hotspots, wherein a yield score indicates a failure probability for a corresponding hotspot. Next, the system predicts the manufacturing yield for the chip based on the hotspots and the yield scores for the hotspots.

Description

BACKGROUND[0001]1. Field of the Invention[0002]The present invention relates to techniques for predicting manufacturing yield for integrated circuit chips. More specifically, the present invention relates to a method and apparatus for predicting manufacturing yield for integrated circuit chips based on hotspots and hotspot-related information collected within the integrated circuit chips.[0003]2. Related Art[0004]Dramatic improvements in semiconductor integration circuit (IC) technology presently make it possible to integrate hundreds of millions of transistors onto a single semiconductor IC chip. These improvements in integration densities have largely been achieved through corresponding improvements in semiconductor manufacturing technologies, which have recently achieved ultra-deep-submicron feature sizes.[0005]On the flip side, the constant drive towards ever-decreasing feature sizes has led to a significant increase in manufacturing costs. One of the main causes of the increasi...

Claims


Application Information

Patent Timeline
IPC IPC(8): G06F17/50
CPCG06F17/5068G06F2217/10G06F30/39G06F2111/08
Inventor SU, QINGCHIANG, CHARLES C.
Owner SYNOPSYS INC
Learn More