System and method for risk assessment and management

a risk assessment and risk management technology, applied in the system field, can solve problems such as difficult to demonstrate a business case for safety investment in many industries and professional activities, high distortion of risk points, and injury costs

Inactive Publication Date: 2009-03-12
KRISHNAMURTHY NATARAJAN
View PDF8 Cites 19 Cited by
  • Summary
  • Abstract
  • Description
  • Claims
  • Application Information

AI Technical Summary

Benefits of technology

[0050]It will be appreciated that the SAFER Diamond is a versatile interactive tool co

Problems solved by technology

While risk assessment and management have been closely tied to safety management systems and considered a prime tool for the elimination and mitigation of mishaps, it has been difficult to demonstrate a business case for investment in safety for many industries and professional activities, particularly those considered “low risk”.
It has been recognised that plotting such values—which generally vary across wide spans—to an arithmetic scale often results in highly distorted locations of risk points.
This may be particularly problematic when time scales vary from days

Method used


Image

  • System and method for risk assessment and management
  • System and method for risk assessment and management
  • System and method for risk assessment and management

Examples


example

Continued, Part 6

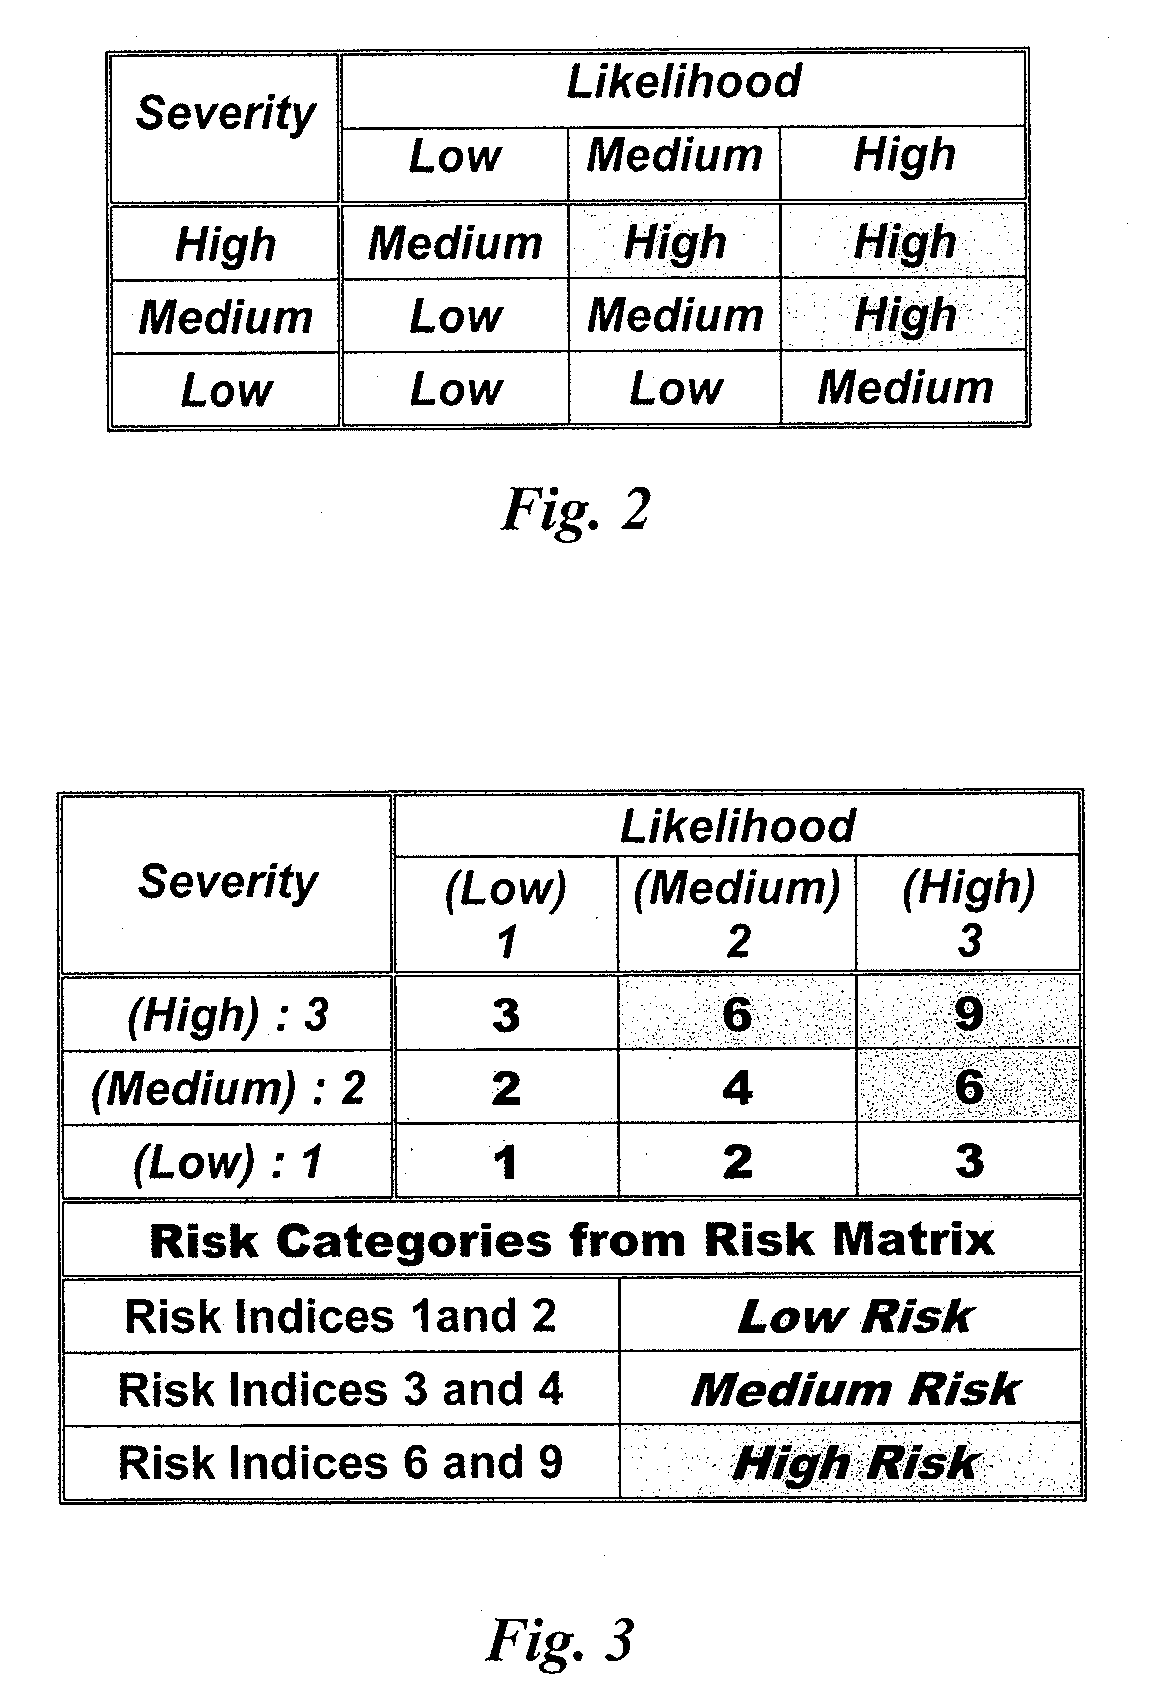
[0218]The actual values for the given feasible percentage danger limits in Example, Part 4, i.e. for a Pi=60%, Si=42.8% and Ri=50%, may be determined from Eq. (9) as:[0219]Pi=10̂(−2.562+60 / 58.2)=10̂(−1.531)=0.0294 mishap per day,[0220]i.e. 1 mishap in 34 days[0221]Si=10̂(2.301+42.8 / 41.7)=10̂3.327=$2125 Per mishap[0222]Ri=10̂(−0.261+50 / 24.3)=10̂1.797=$62.60 Per day[0223]Also, since Ri=Pi·Si, we find, 0.0294×2125=$62.60 per day, as above.[0224]Further decisions may now be made on whether this cost is tolerable or not.

[0225]Many more permutations and combinations of data and computations are possible, all of which may aid in the understanding of the problem, evaluation of the sensitivity of the outcome to changes in the various parameters, etc.

[0226]Forms may be prepared for submission of data and also entry of hand-calculated or machine-computed results in a convenient format, by officials concerned.

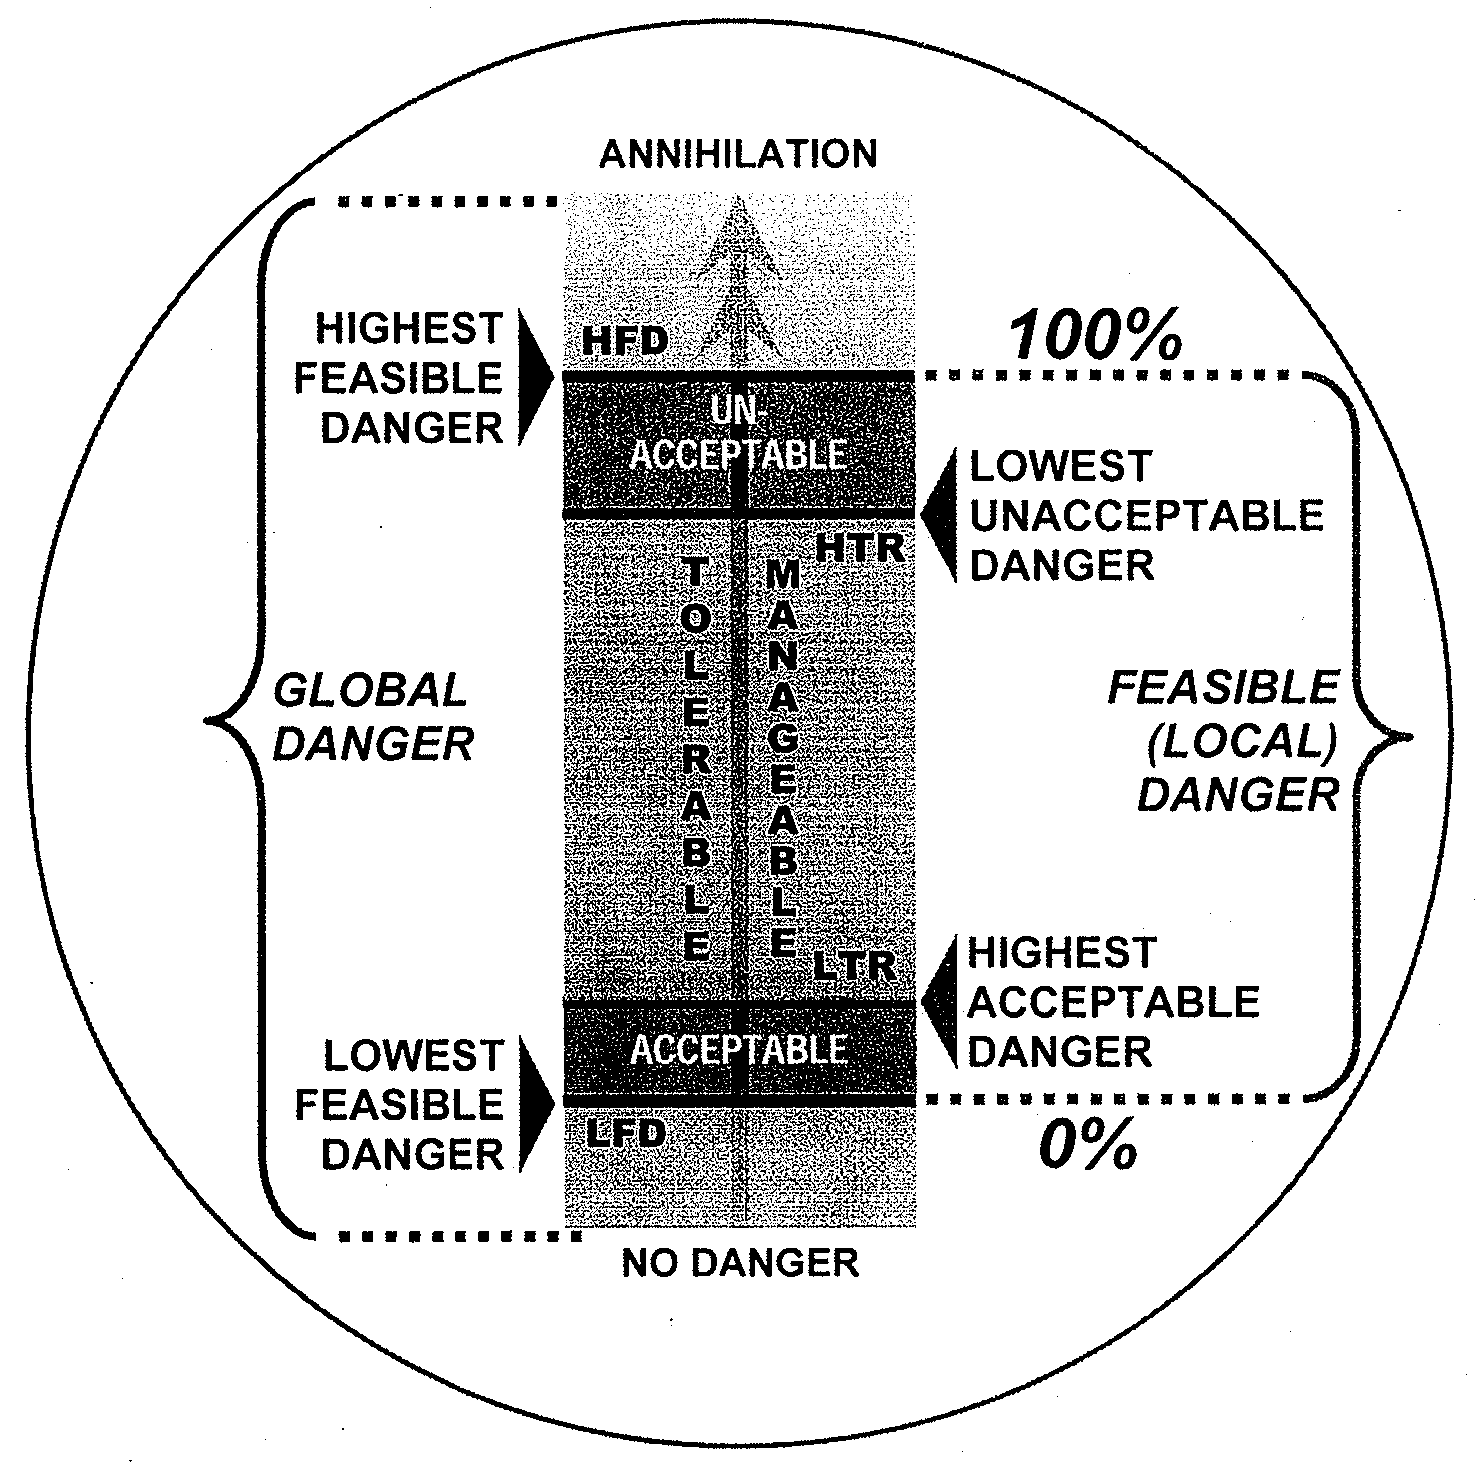
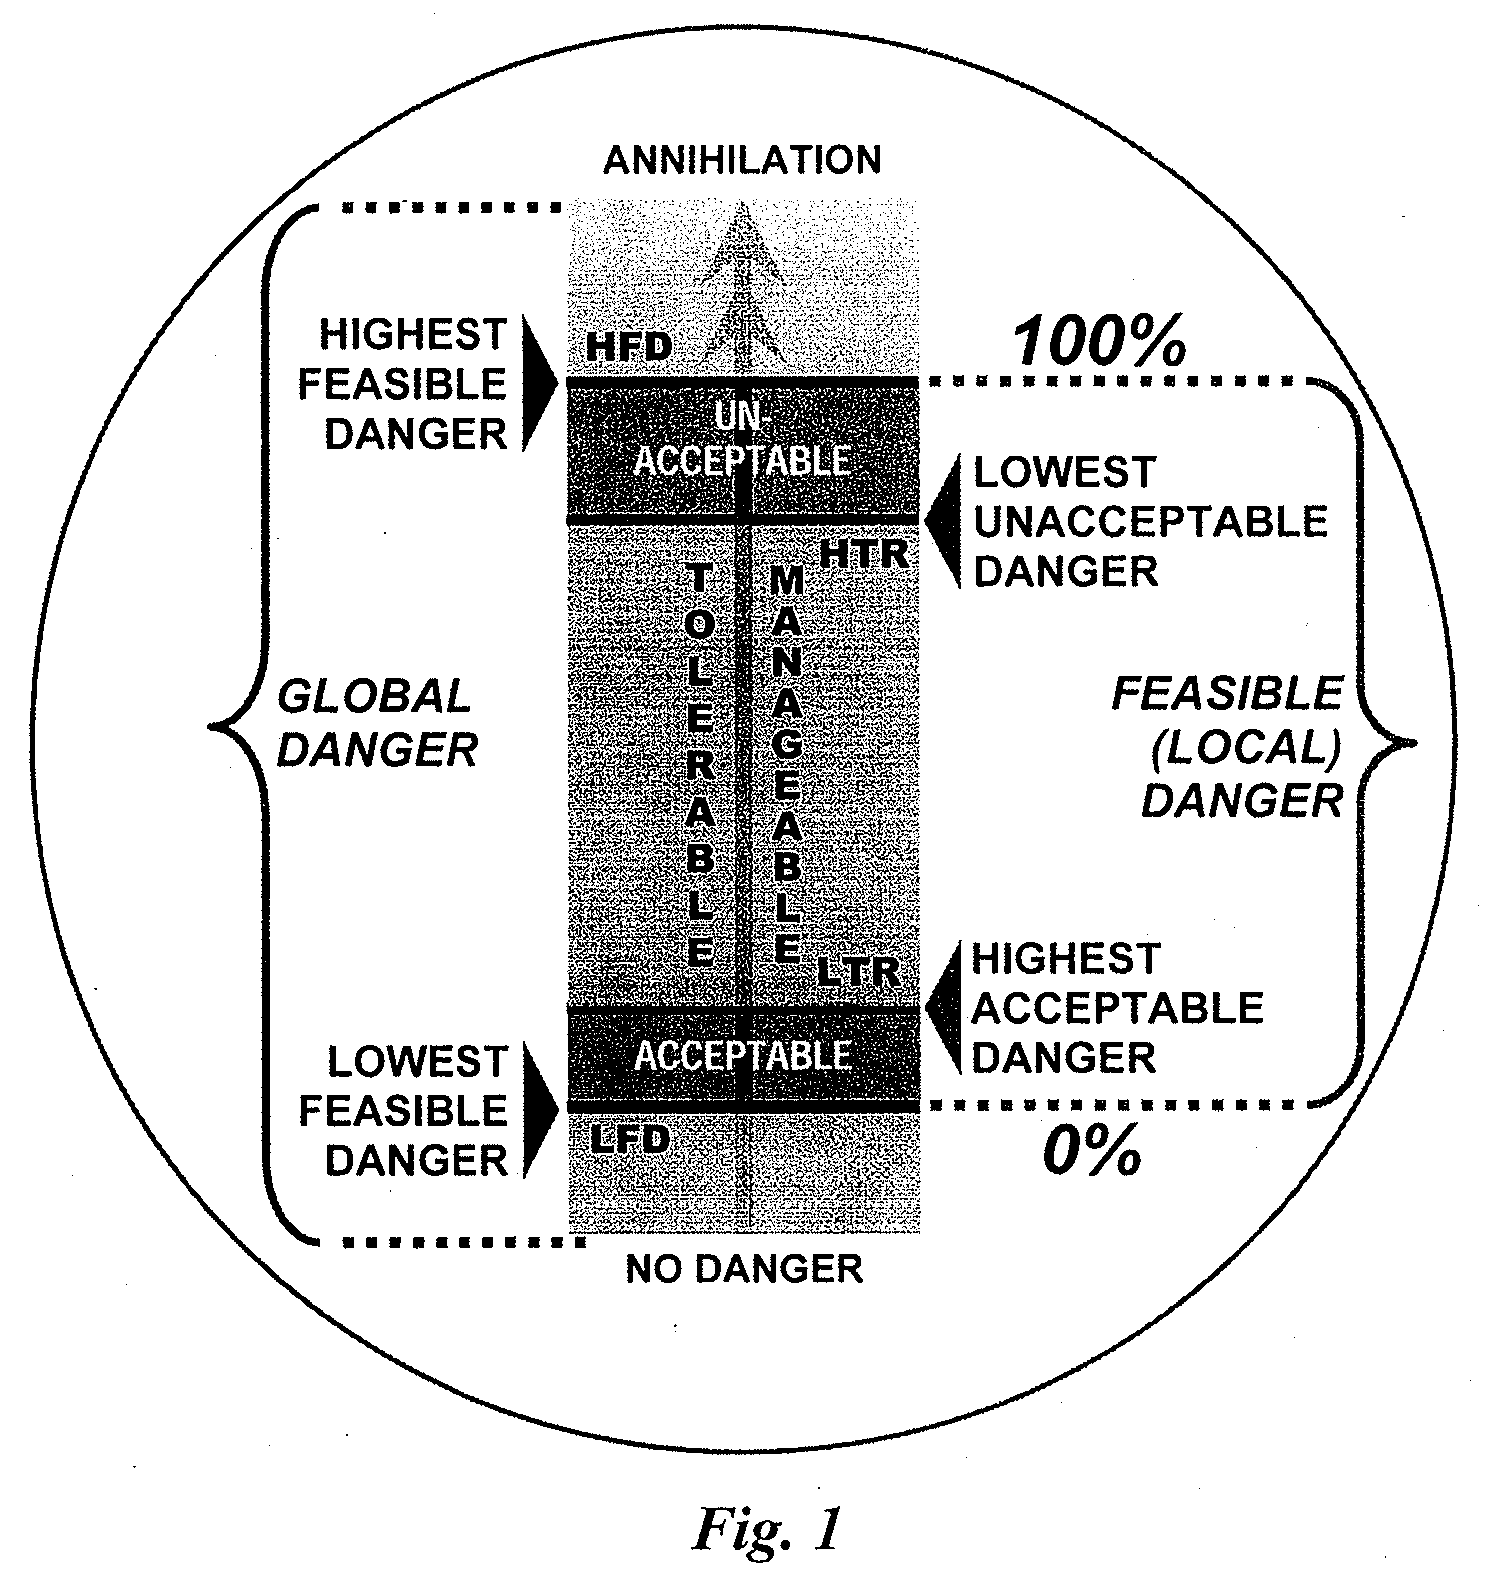
Graphical Representation of Data and Results

[0227]Graphical represent...


PUM


Abstract

There is disclosed a method for assessing and managing risk within a process comprising:
    • (i) receiving data relating to a probability (P) of two or more mishaps occurring within said process, and data relating to a severity (S) of two or more mishaps occurring within the process;
    • (ii) defining a range of probability (P) values and severity (S) values as the span from the minimum to maximum values received;
    • (iii) defining a range of risk (R) as the products of the minimum and maximum (P) and (S) values;
    • (iv) obtaining logarithmic values of probability (P), severity (S), and risk (R) and scaling the ranges of the logarithmic values such that (P), (S), and (R) values are represented as percentages (0-100%);
    • (v) determining a percentage of any values of P and S specified at intermediate stations within their respective ranges;
    • (vi) computing a percentage, rank and value of risk (R) for any intermediate combination of probability (P) and severity (S) values specified; and,
    • (vii) comparing the computed risk results against acceptable and unacceptable criteria to determine whether the risk is tolerable, and hence to be managed with suitable control scenarios.

Description

FIELD OF THE INVENTION[0001]The present invention relates to a system and method for assessing the risk of a hazardous activity, event, or situation, and in particular, to a methodology and format for presenting the numerical values associated with such risks in tabular and graphical format for convenient documentation and visualisation.BACKGROUND[0002]The ability to assess and manage risk is an important aspect of everyday life, particularly where certain activities may result in mishap. As such, risk assessment methods are now an established topic of theoretical analysis and practical management of hazards in any professional endeavour. Generally speaking, risk assessment takes into consideration the probability or likelihood of the mishap occurring, and the severity or consequences of that mishap, along with other relatively minor factors.[0003]Historically, workplace mishaps have occurred and evoked the attention of concerned people throughout the history of human civilisation. ...

Claims


Application Information

Patent Timeline
IPC IPC(8): G06Q90/00
CPCG06Q40/08G06Q10/0635
Inventor KRISHNAMURTHY, NATARAJAN
Owner KRISHNAMURTHY NATARAJAN
Why Eureka
Try Eureka