Method of extracting data and recommending and generating visual displays

a technology of data and visual displays, applied in the field of methods of extracting data and recommending and generating visual displays, can solve the problems of inability to easily discern graphing calculators, inability to distill data into subsets and categories, overwhelming, etc., and achieve the effect of enhancing the features of visualization tools

Inactive Publication Date: 2009-06-18
YUAN MAX
View PDF9 Cites 238 Cited by
  • Summary
  • Abstract
  • Description
  • Claims
  • Application Information

AI Technical Summary

Problems solved by technology

When reviewing a large data source, it can be intimidating, overwhelming, and seemingly impossible to distill the data into subsets and categories for further analysis.
Moreover, it may not be readily discernible the many ways one could visualize the results.
Graphing calculators, however, have a primitive and small display, are highly specialized, lack the ability to expand, and require a user to individually input data.
Moreover, graphing calculators require a battery and can be expensive.
Typically, however, these software tools involve a complex interface, require expensive hardware, have poor collaboration, have limited customization capability are subject to restrictive licensing with high licensing fees, involve multiple editions, and require maintenance and upgrade costs.
Furthermore, these software tools lack the ability to access, distill, analyze, and organize data and recommend appropriate visualization options to a user.
Currently available Web-based computing tools, however, have limited features and poor navigation.
Additionally, current Web-based computing tools have confusing interfaces and are not scalable or reusable.
Finally, the current tools lack a user community, have no collaboration features, and lack the ability to distill, analyze and organize varied data for visualization.

Method used


Image

  • Method of extracting data and recommending and generating visual displays
  • Method of extracting data and recommending and generating visual displays
  • Method of extracting data and recommending and generating visual displays

Examples


Embodiment Construction

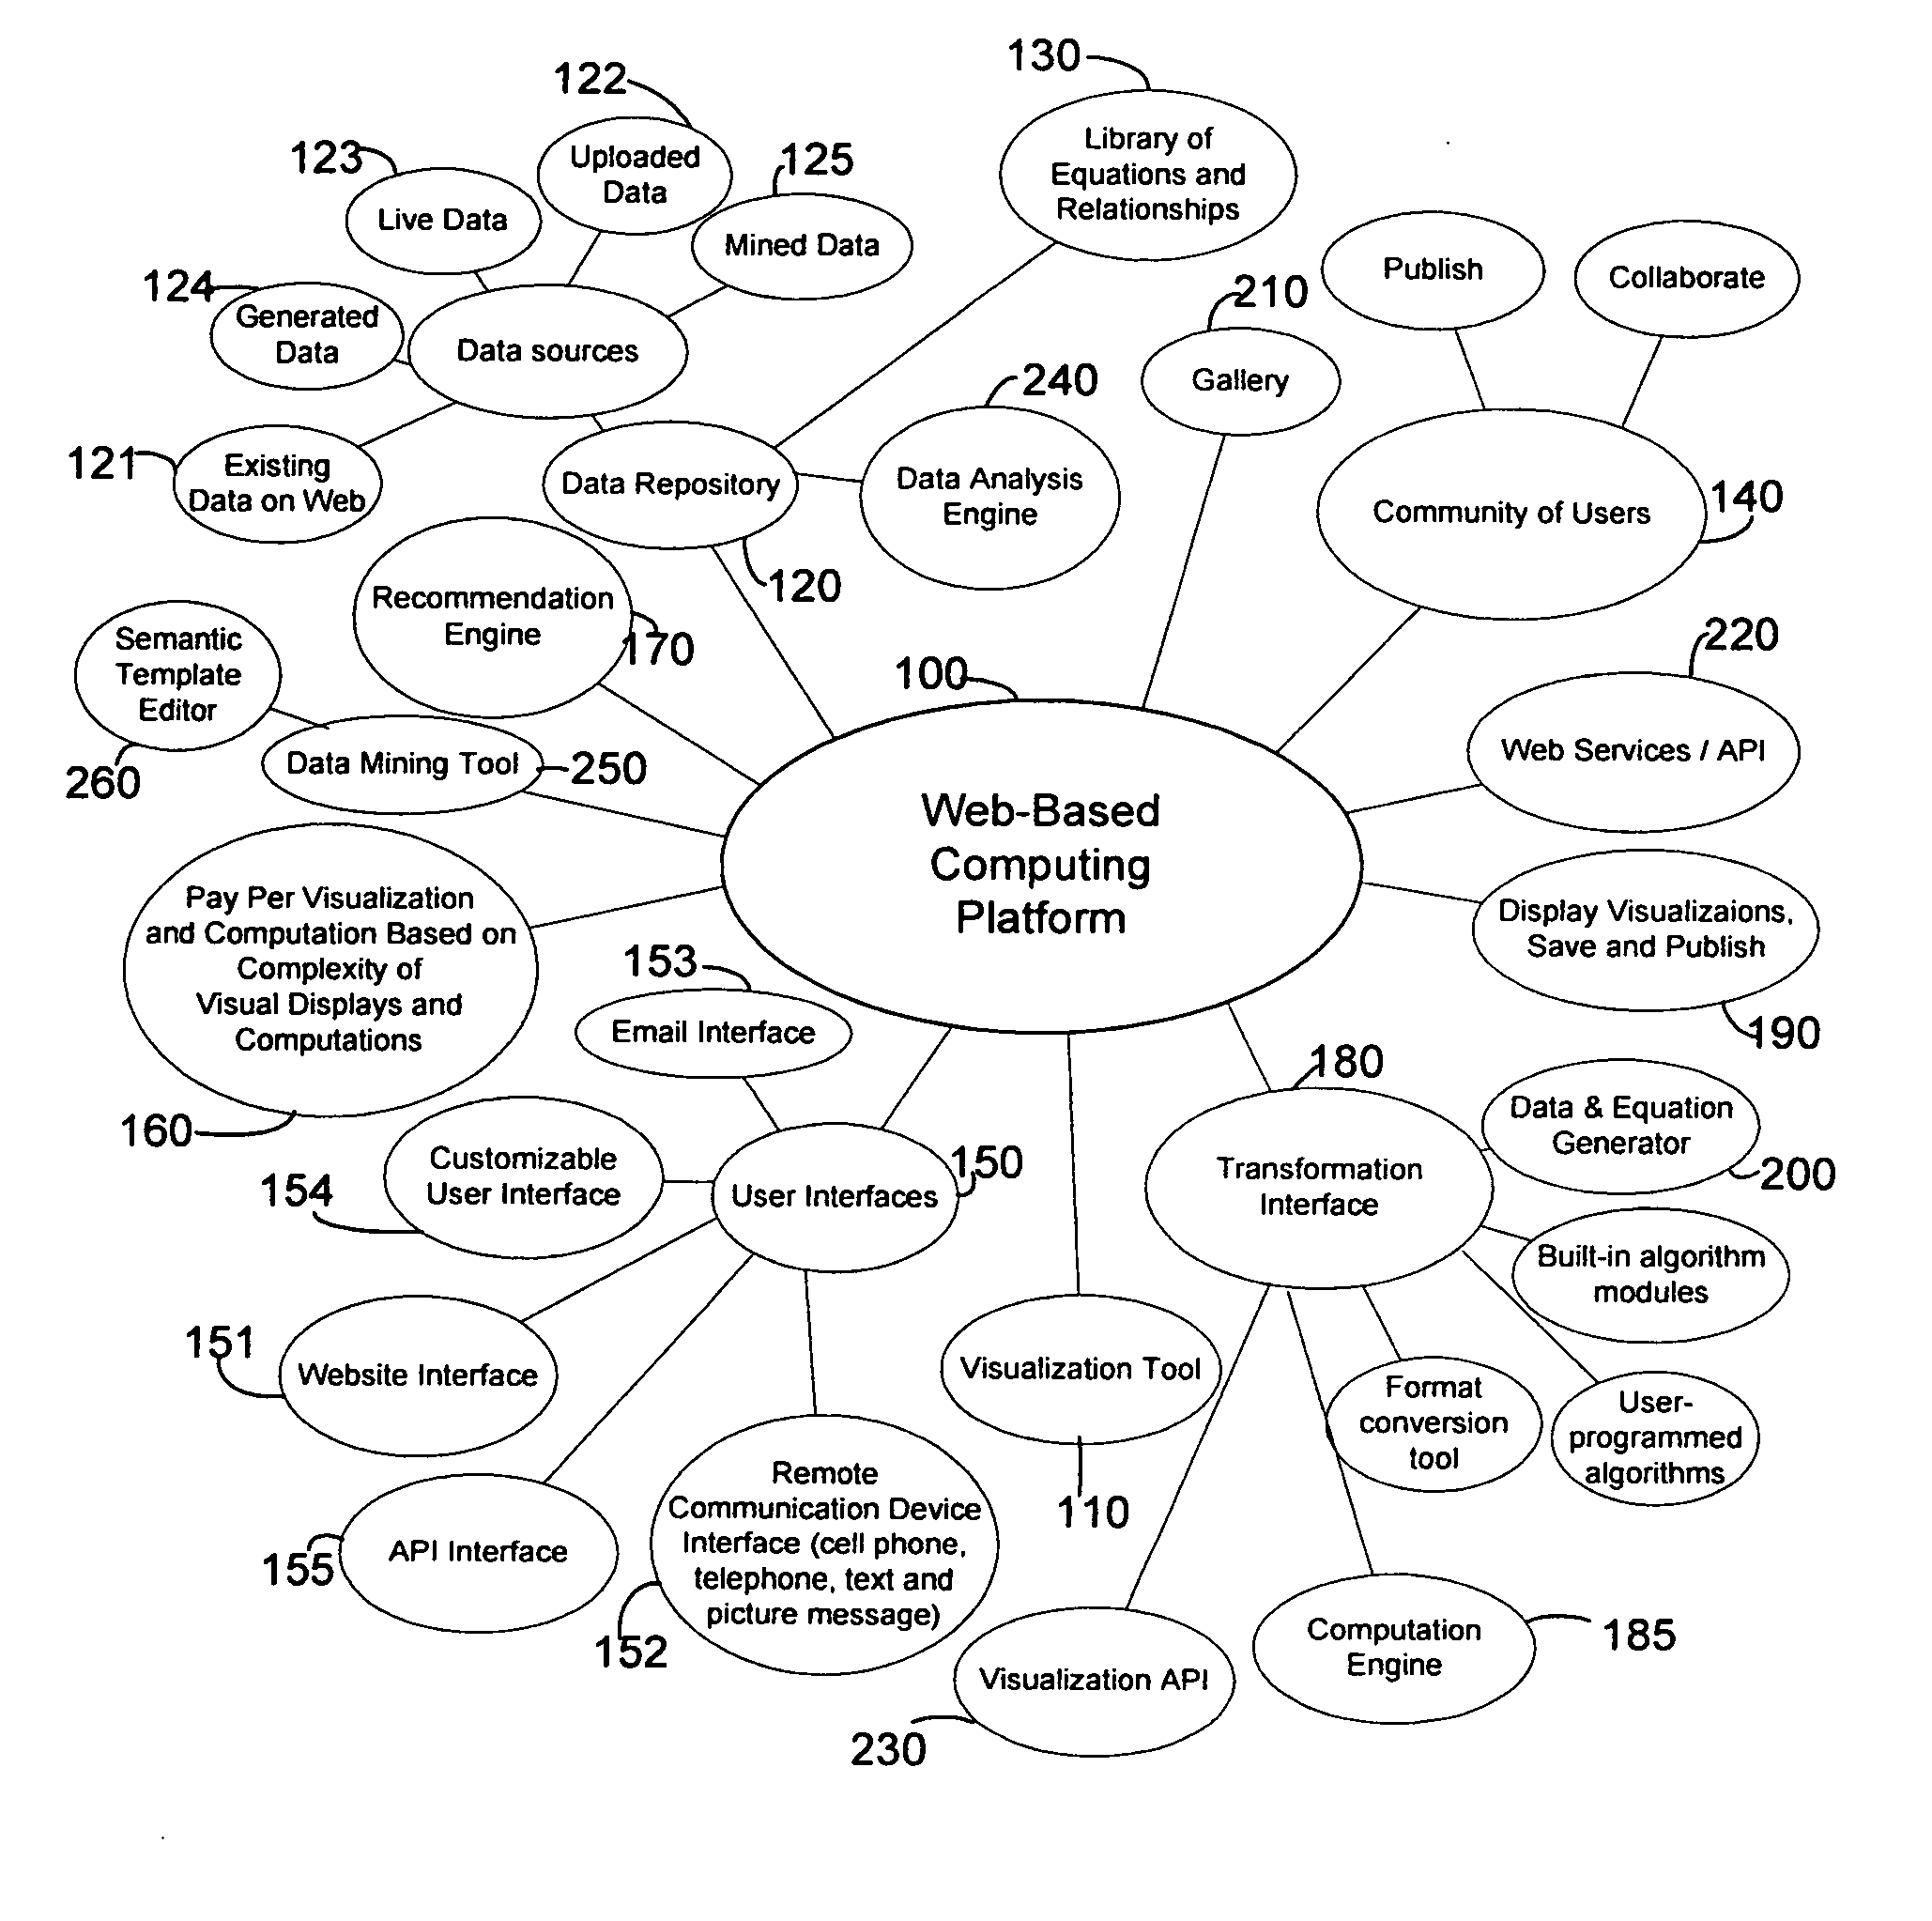
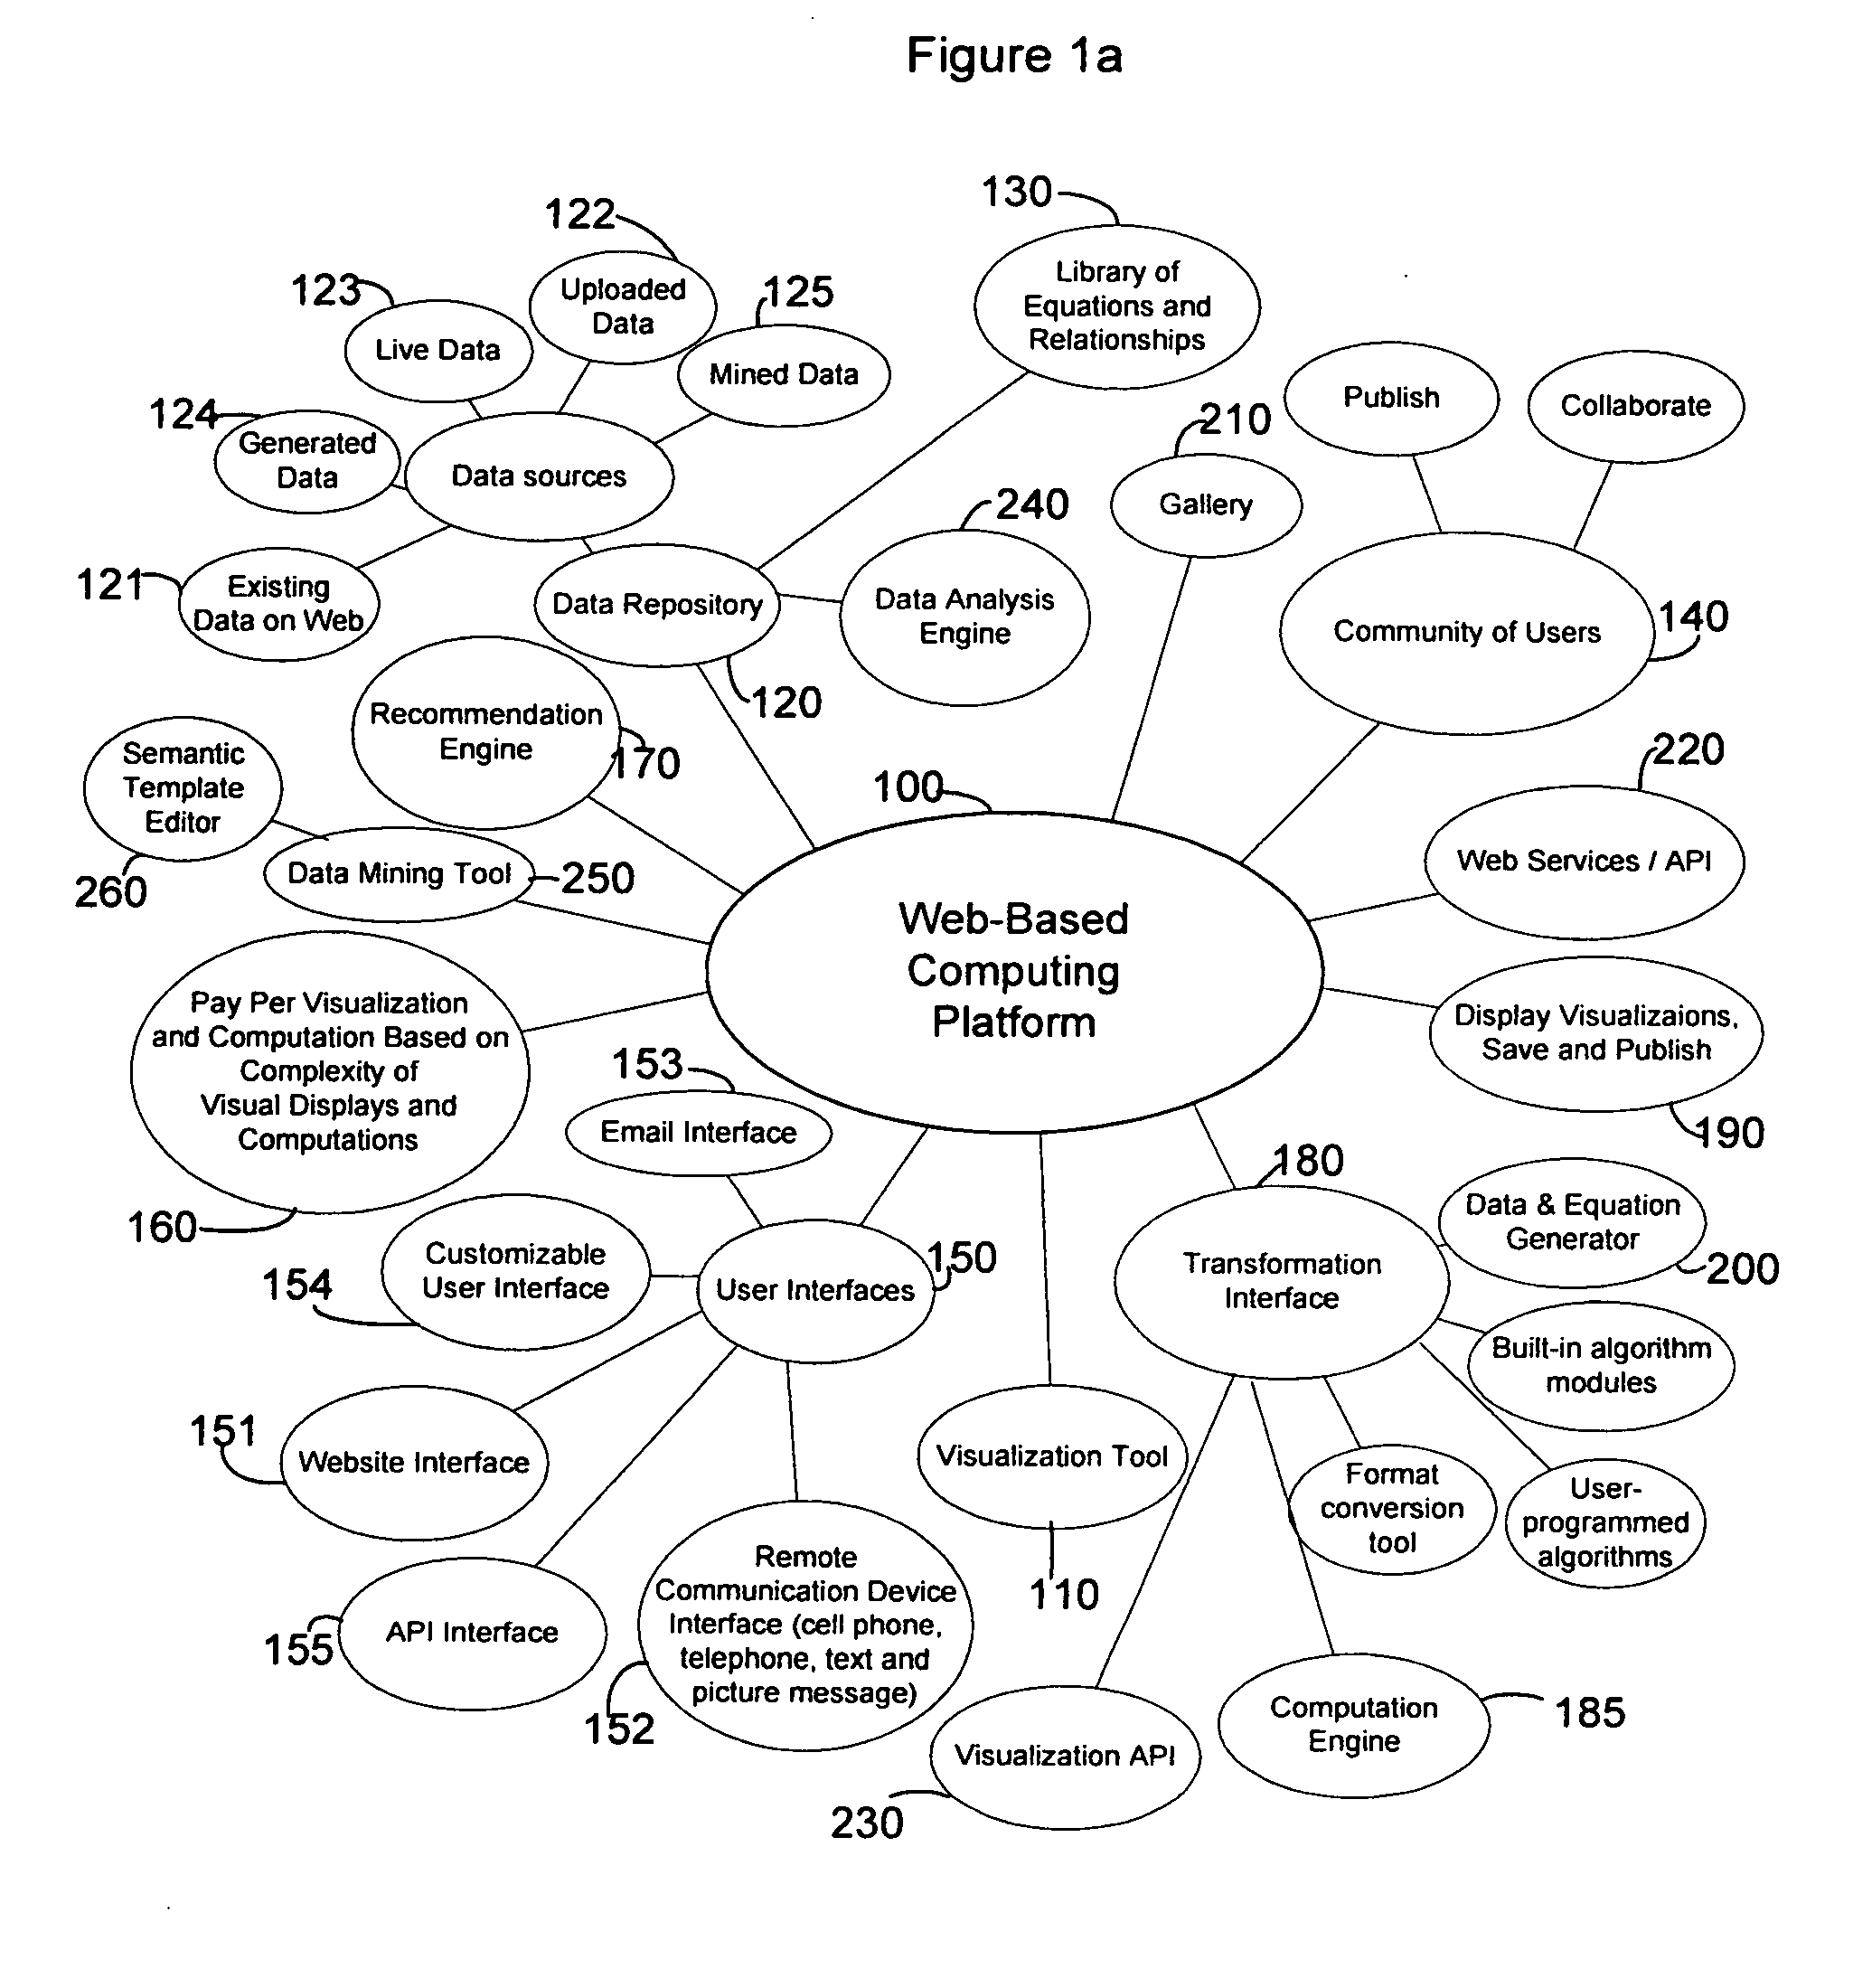
[0035]FIG. 1a illustrates the overall features of the Web-based computing platform 100 that includes and supports a visualization tool 110. As shown, the Web-based computing platform includes the visualization tool 110, a data repository 120, a library of equations and relationships 130; a community of users 140; multiple user interfaces 150; and a payment system 160. The Web-based computing platform 100 also includes a recommendation engine 170, transformation interfaces 180, abilities to display visualizations 190, a data and equation generator 200, a gallery 210, Web services 220, and a data mining tool 250. In general, the computing platform 100 provides the ability to create, import, export, tag, share, and store data and visualizations and associated programs and research; access to a community for publishing visualizations and collaborate; and a point-based payment method related to the complexity of the visualizations and associated computations. The visualization tool 110 a...


PUM


Abstract

A method of recommending and generating visual displays of data by executing a visualization tool that operates as part of a comprehensive Web-based computing platform can be accessed via a website, customizable interface, email, telephone, or other remote communication device. The visualization tool operates by accessing the data source and then executing an analysis engine to parse numerical and other forms of data. If necessary, a data mining tool can also be used to download data and a semantic template editor can be used to generate a template for parsing any type of data. The data and data format are identified, and the visualization tool executes a recommendation engine that considers the data and data format and recommends suitable visual display styles and visual display options and recommends additional compatible algorithms. Additionally, users can provide their own compatible algorithms for data processing. The user then selects one or more display styles or graphs and display options. If there are compatible algorithms, the user can select a pre-programmed algorithm or a user-generated algorithm as well. The computation engine executes the algorithms, performs calculations associated with the chosen visual display style, and outputs a file according to a given API protocol. A presentation program uses the output file to generate a visual display. Finally, the visualization tool delivers the display to the user, saves the display, and / or publishes the display.

Description

CROSS-REFERENCE TO RELATED APPLICATIONS[0001]This application claims the benefit of U.S. Provisional Application No. 61 / 000,618 filed Oct. 26, 2007.FIELD OF THE INVENTION[0002]This invention relates to a method of extracting data and recommending and generating visual displays of data on a computer system. In particular, this invention relates to executing a visualization tool accessible on a Web-based computing platform.BACKGROUND TO THE INVENTION[0003]Computing tools include tools that perform simple or complex computations as well as tools that display data and computations in charts, graphs, and other visual forms for an end user. When reviewing a large data source, it can be intimidating, overwhelming, and seemingly impossible to distill the data into subsets and categories for further analysis. For example, a review of the United States Patent and Trademark Office online database of issued patents contains a large volume of data, including classifications, priority dates, fili...

Claims


Application Information

Patent Timeline
Patent Type & Authority Applications(United States)
IPC IPC(8): G06F17/30G06F3/048G06Q30/00
CPCG06F17/30864G06Q10/101G06F17/30905G06F16/951G06F16/9577
Inventor YUAN, MAX
Owner YUAN MAX
Why Eureka
Try Eureka