Method for calibrating seismic imaging velocities
- Summary
- Abstract
- Description
- Claims
- Application Information
AI Technical Summary
Problems solved by technology
Method used
Image

Examples
an example study
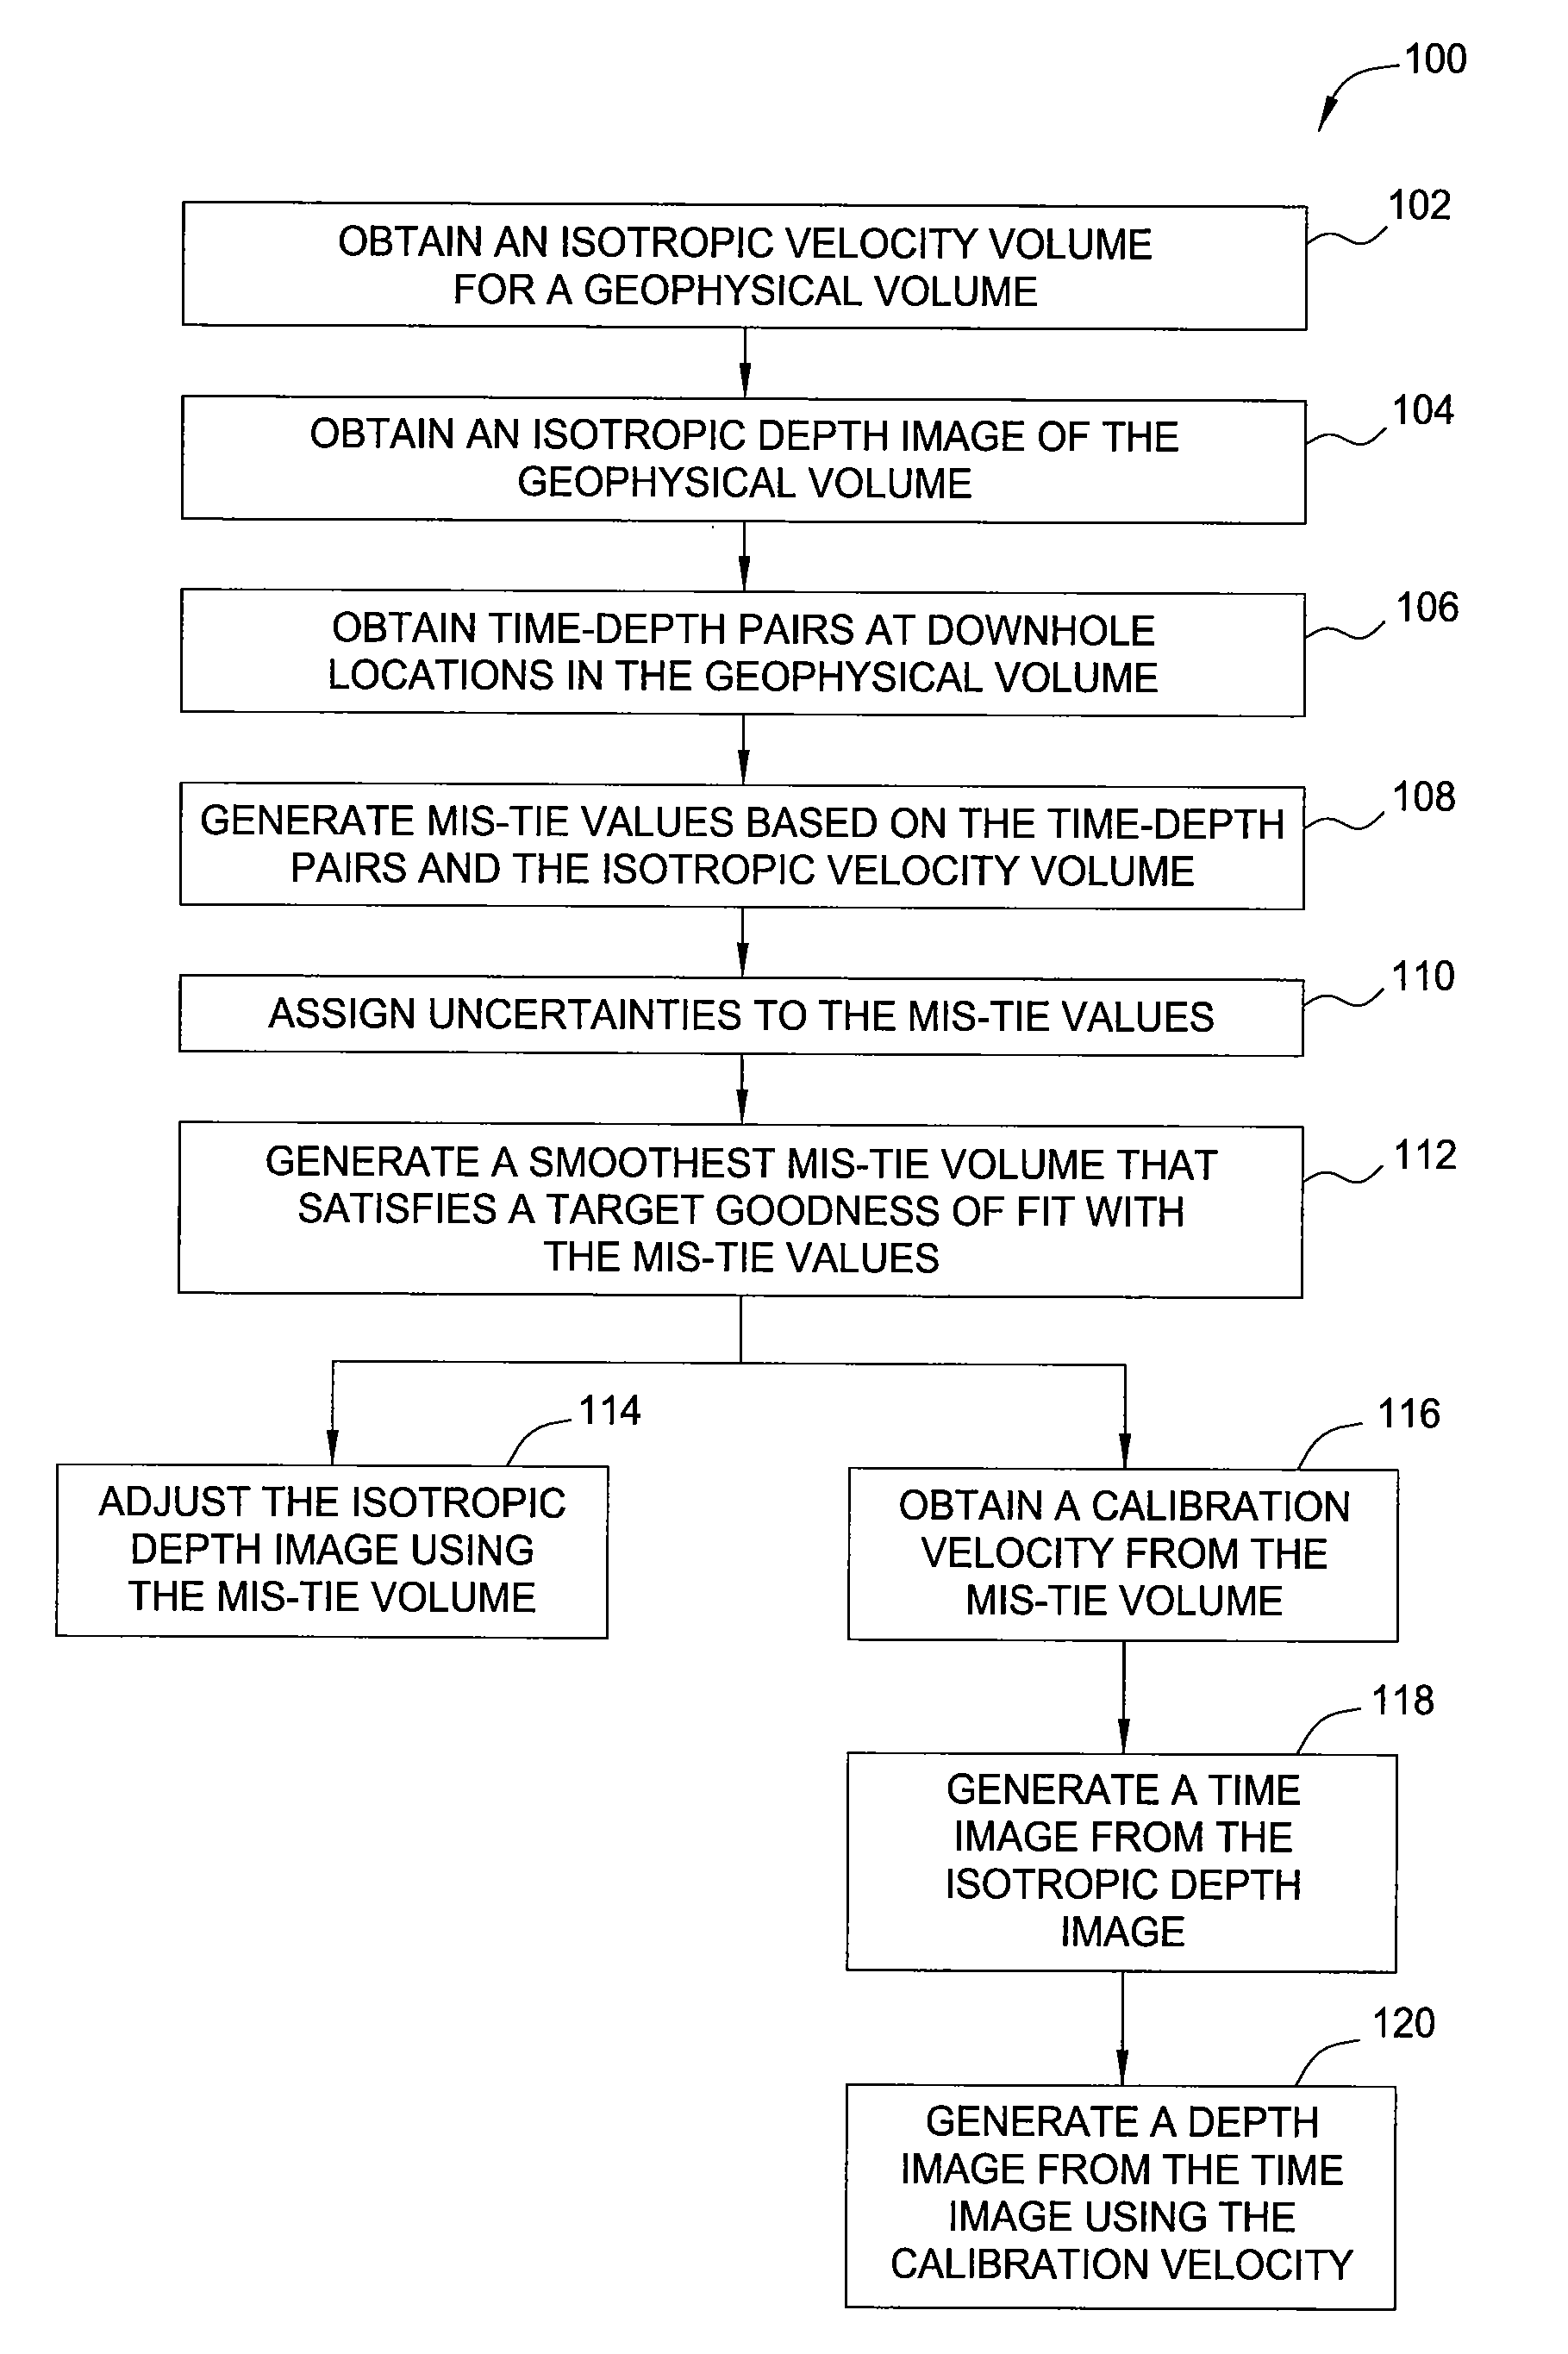
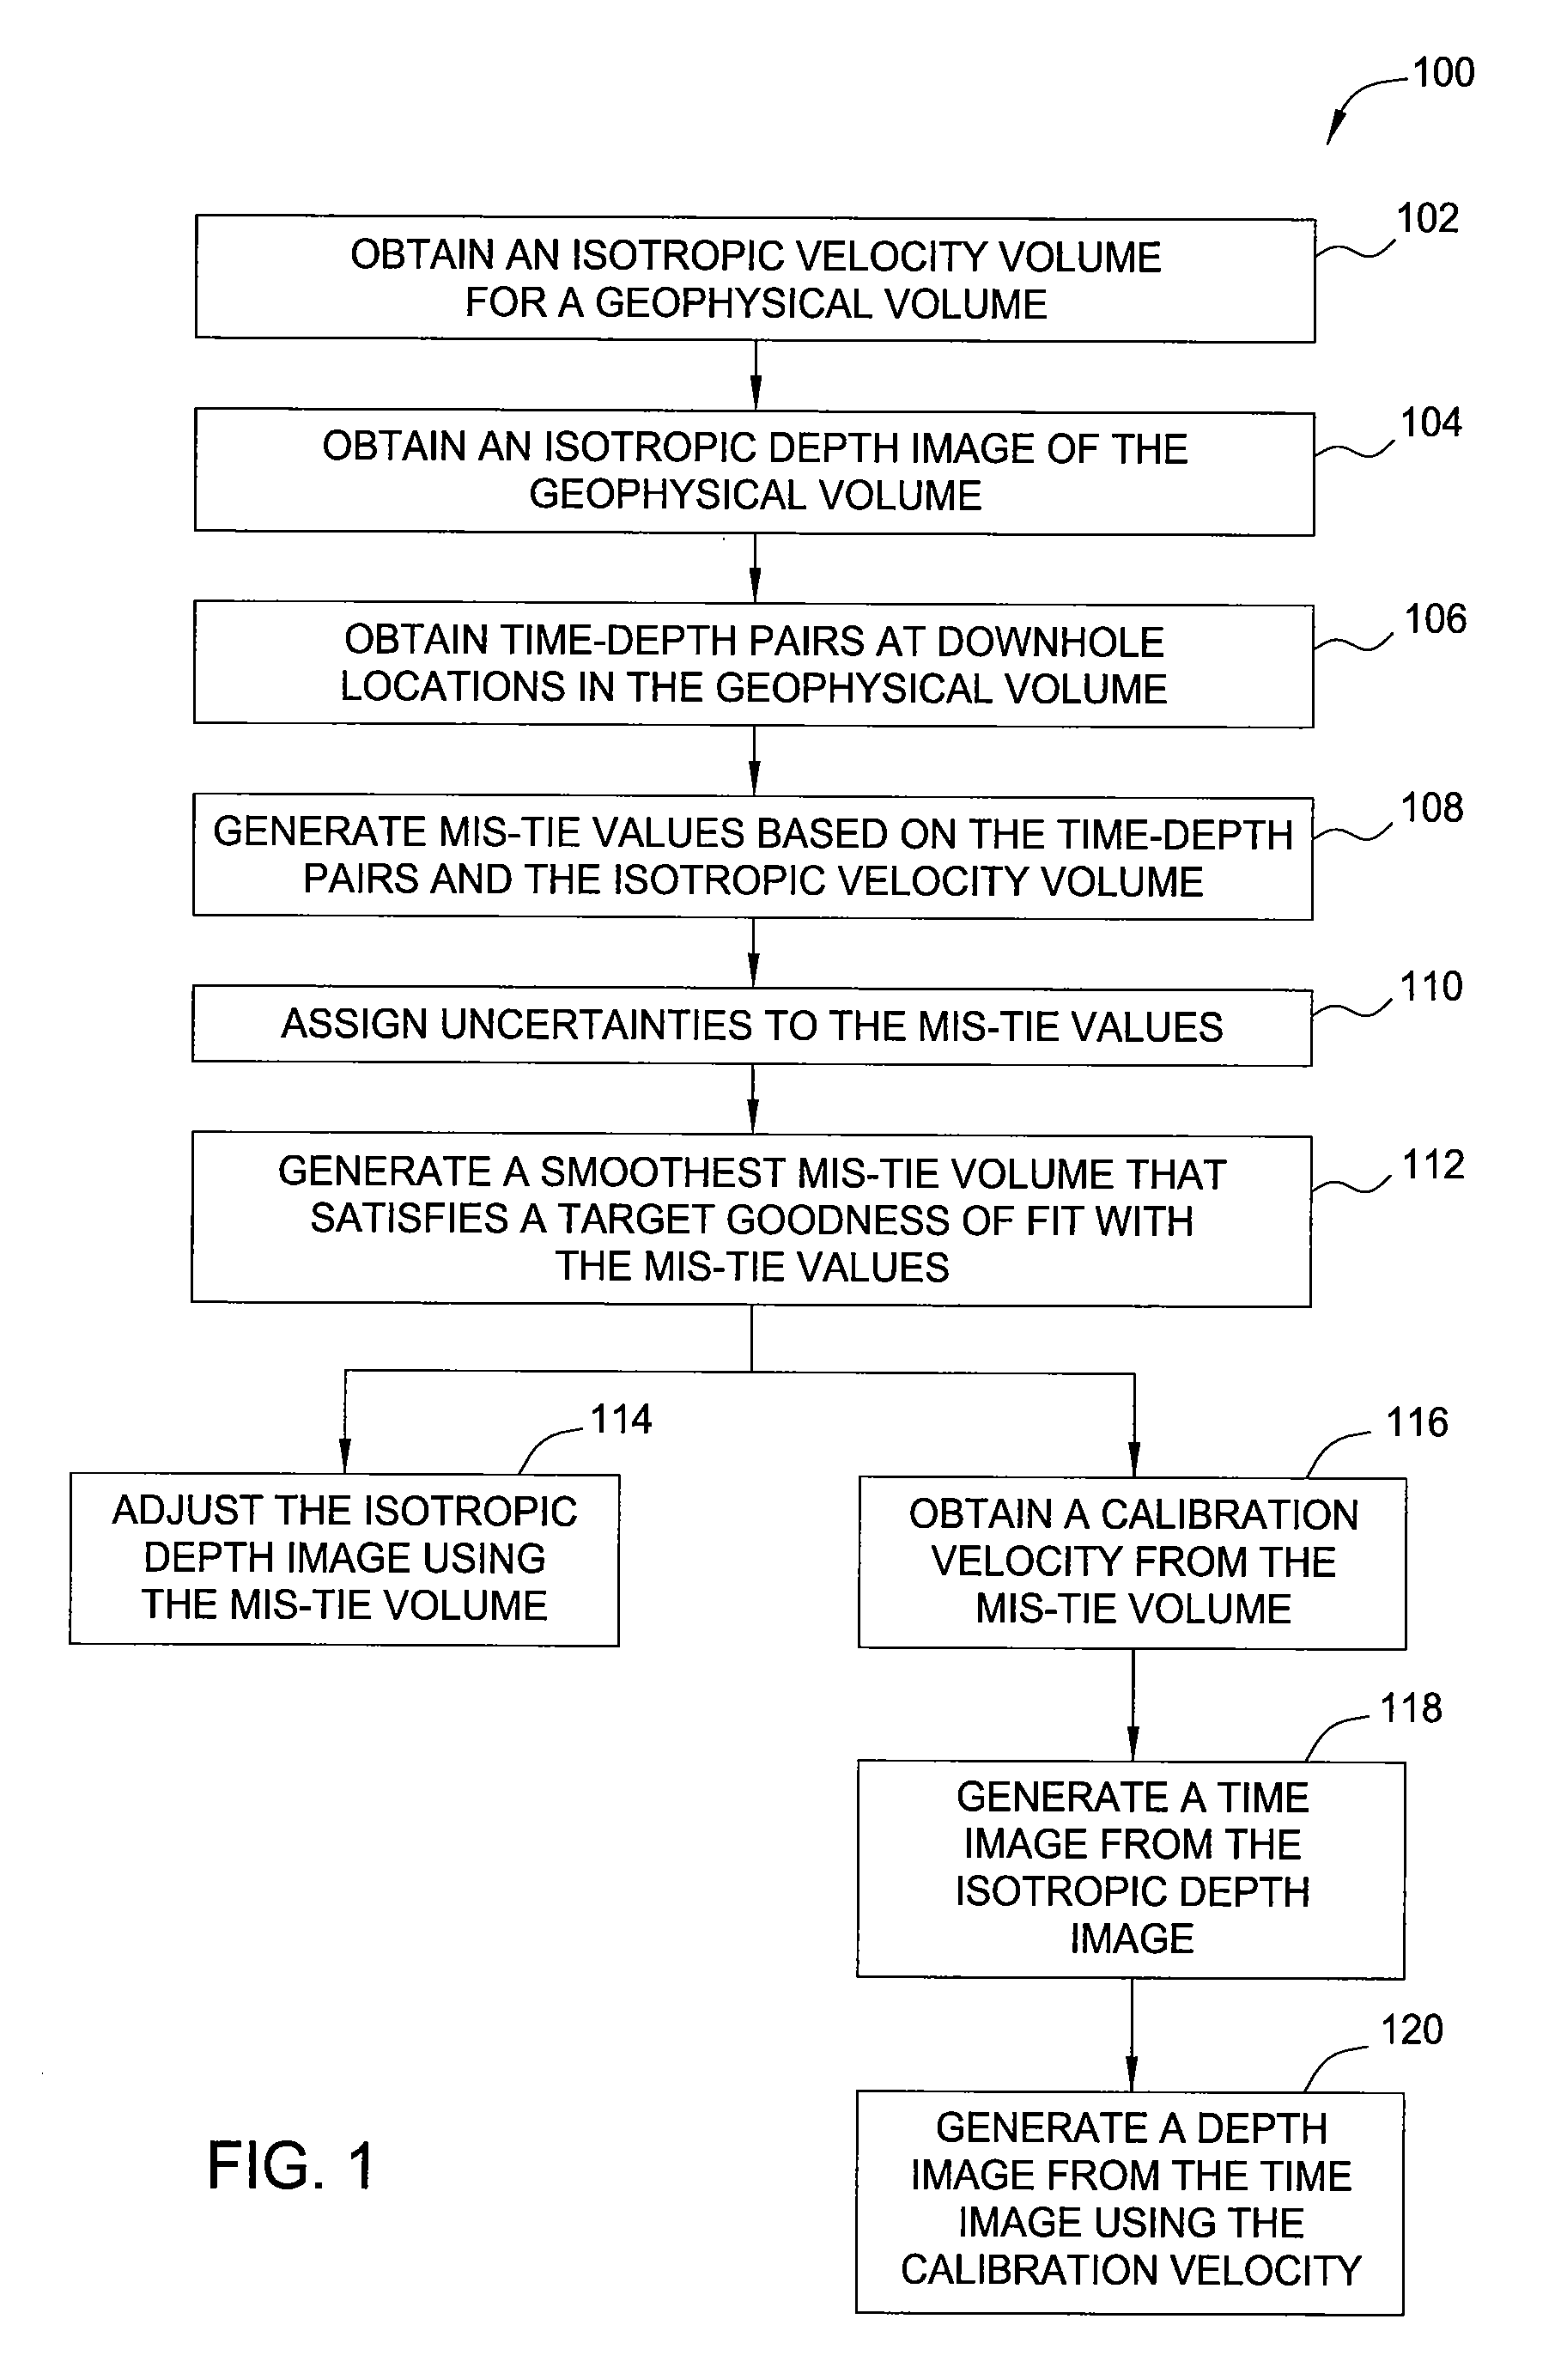
[0037]The following Figures illustrate how the technique presented herein may be applied to adjust an image.
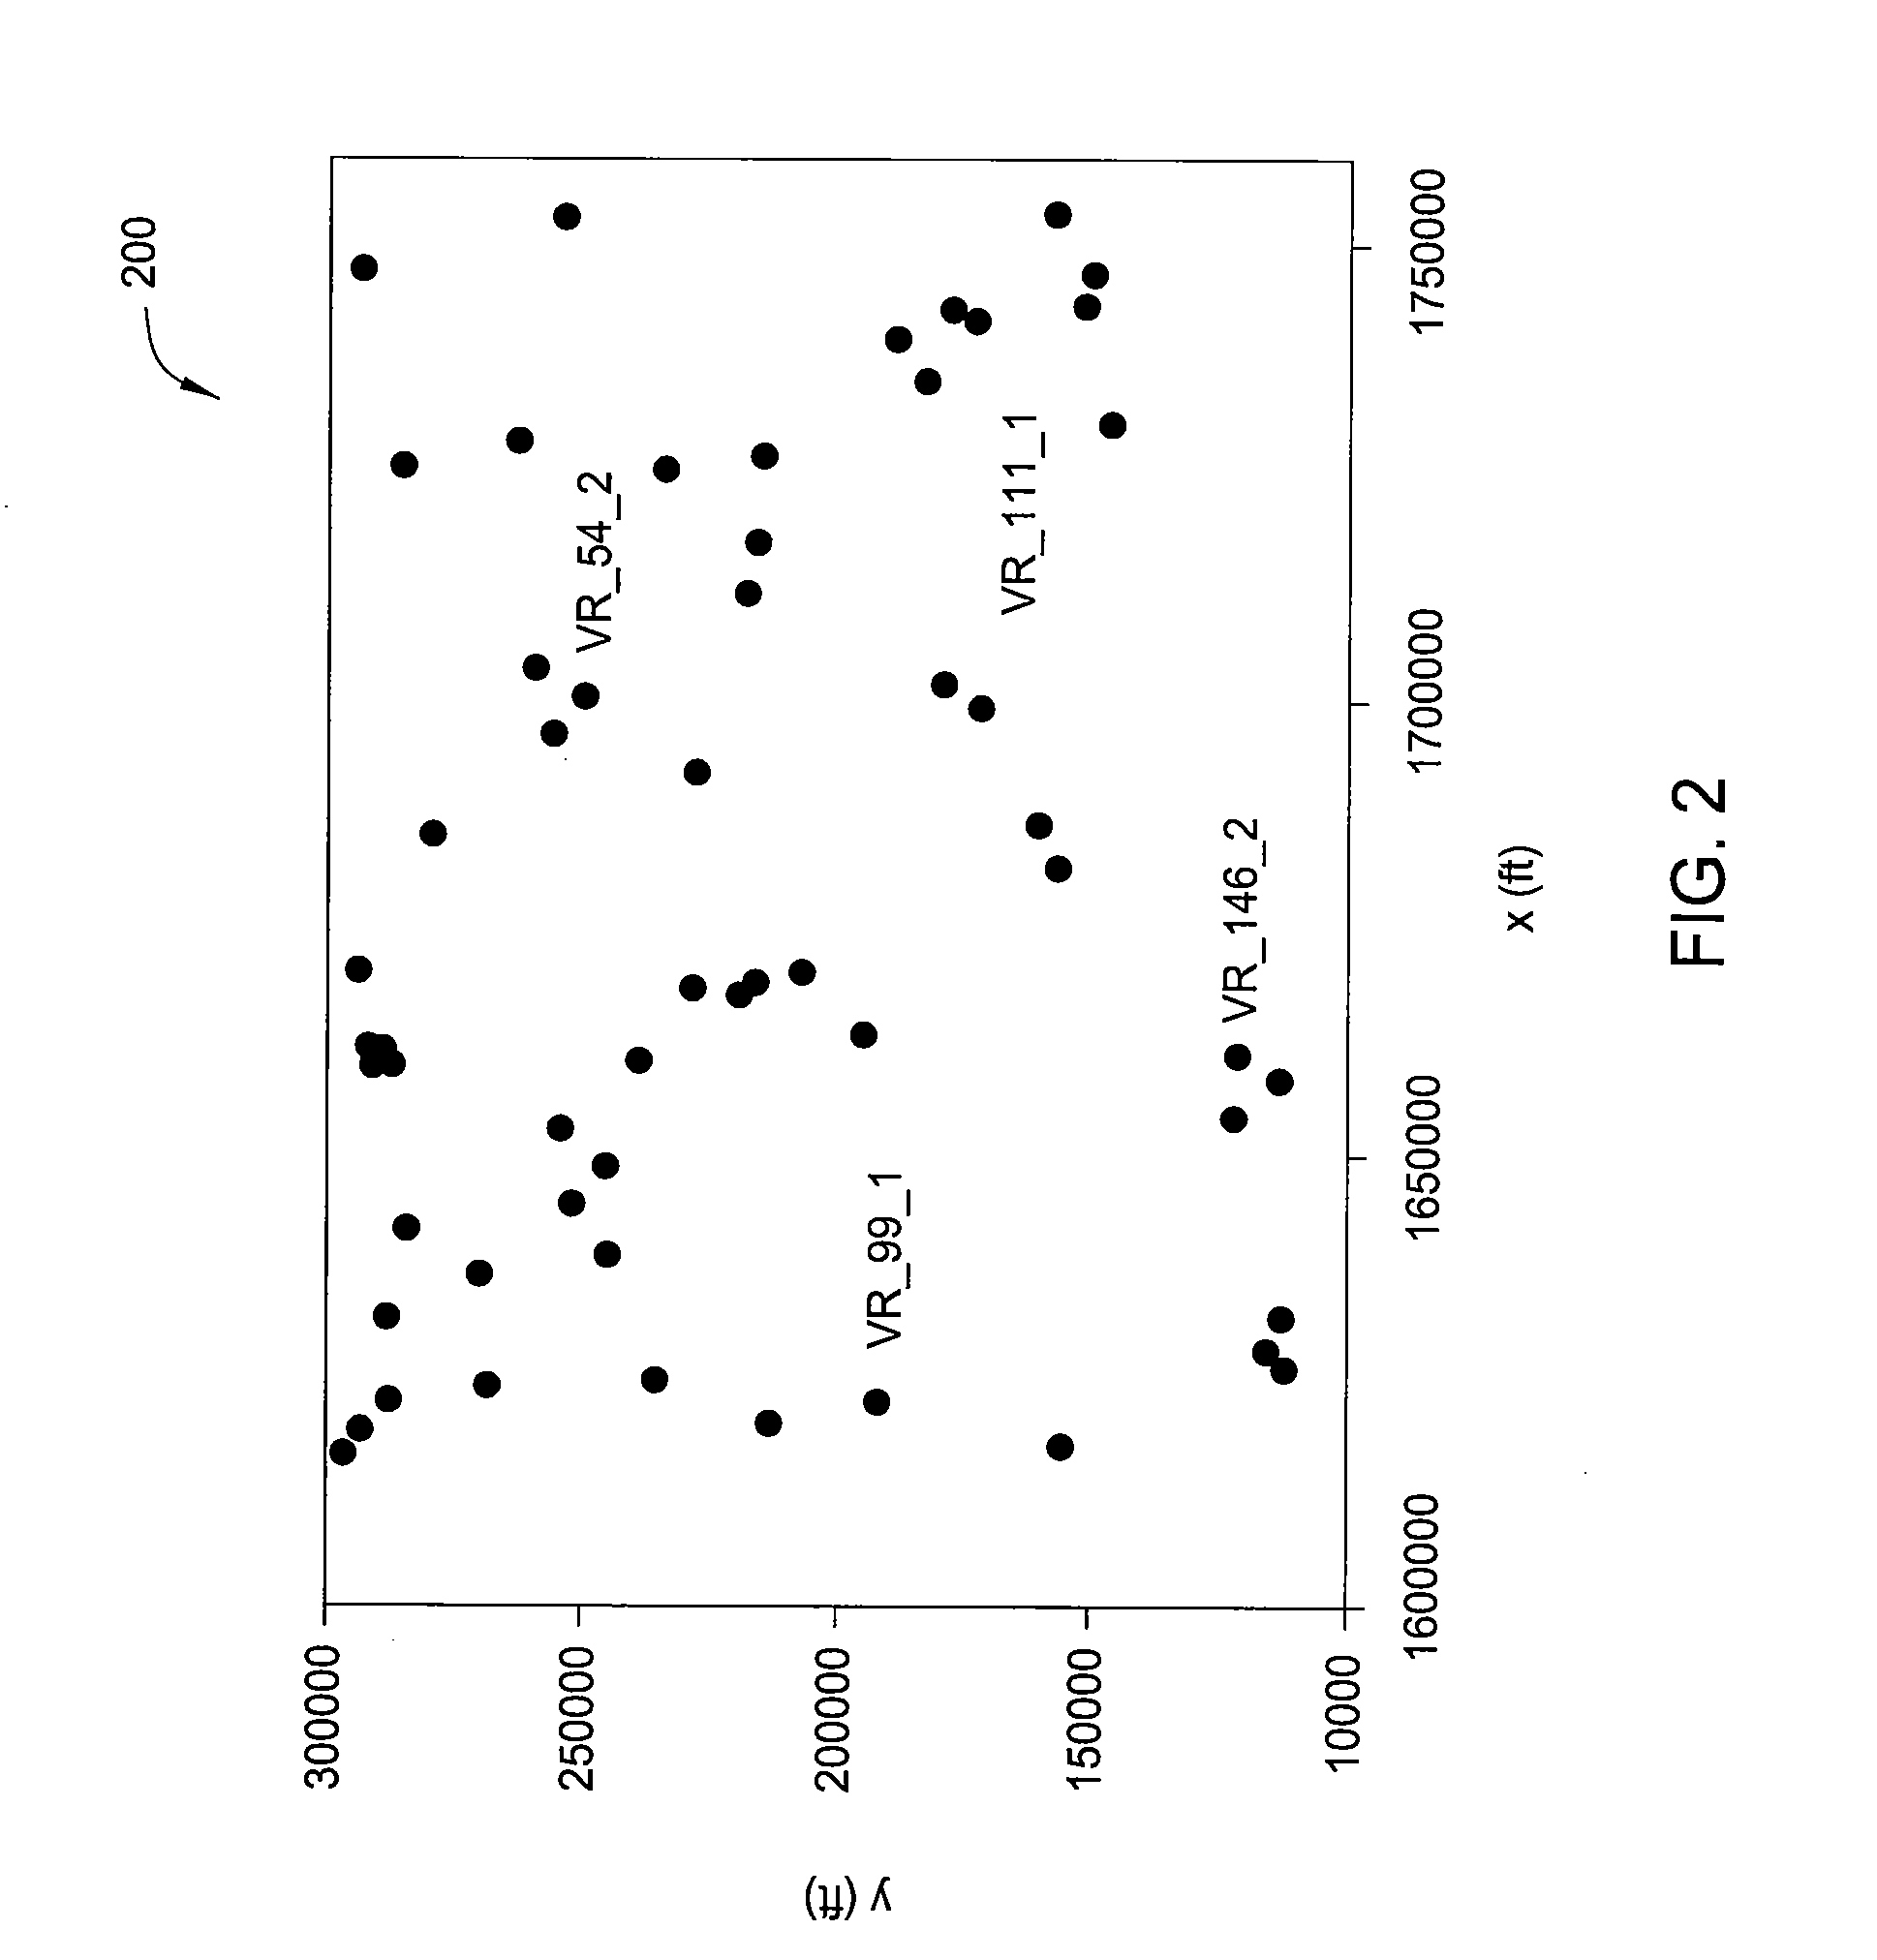
[0038]FIG. 2 indicates locations 200 of the 59 wells that provided check shots for the study. Axes units are feet and the vertical axis points towards north. The area shown is approximately 1200 square miles. Velocities at the four labeled wells are plotted in FIGS. 6A-6D. Mis-ties were computed using a velocity model obtained from isotropic migration velocity analysis and tomography. The check shots yielded a total of 1846 mis-ties M in equation (7)).
[0039]FIG. 3 illustrates mis-ties 300 in feet plotted as a function of time. Positive mis-tie may indicate that the corresponding depth in an isotropic image may be greater than true depth in the earth (equation (3)). This may clearly be the case for times greater than about 1500 ms and may be characteristic of the occurrence of anisotropic, possibly pressured, shales. Shallow times may indicate the reverse trend, with mis-tie be...
PUM
 Abstract
Description
Claims
Application Information
 - R&D Engineer
- R&D Manager
- IP Professional
- Industry Leading Data Capabilities
- Powerful AI technology
- Patent DNA Extraction
Browse by: Latest US Patents, China's latest patents, Technical Efficacy Thesaurus, Application Domain, Technology Topic.
© 2024 PatSnap. All rights reserved.Legal|Privacy policy|Modern Slavery Act Transparency Statement|Sitemap