Graphical user interface (GUI) for scientific reference comprising a three-dimentional, multi-framed unification of concept presentations

a scientific reference and user interface technology, applied in the field of scientific reference tools and materials, can solve the problems of not being able to show the relationship between the various scientific branches, not being able to use and not being able to achieve the most effective visualization techniqu

Inactive Publication Date: 2010-08-26
CHANNON MARTIN GERARD
View PDF6 Cites 6 Cited by
  • Summary
  • Abstract
  • Description
  • Claims
  • Application Information

AI Technical Summary

Benefits of technology

[0015]The plot is a composite of multiple individual diagrams each representing one of the phenomena plotted within the graphical time / space coordinate system. By navigating between the text listing of primary phenomena, the viewer pane, and the composite plot, the user can drill down to obtain more detailed information on any one of said phenomena.
[0016]More specifically, the list of phenomena 6 comprises a categorization of the thirty primary forms of phenomena studied in the various intellectual disciplines, appearing on the right-hand side of the schematic, and each being a hyperlink that loads classification tables (e.g., the periodic table) into a far-right viewer frame. The classification tables likewise include hyperlinks that act back on the unified schematic, singling out individual schematics (e.g., clicking the Hydrogen entry H in the periodic table engenders a cross-section for hydrogen 1s state to a face-on view). Further, links in the classification tables act on the right viewer frame, loading supplemental diagrams (e.g., the hydrogen energy level diagram). Links in these supplemental diagrams also act back on the unified schematic, loading more detailed diagrams and information.

Problems solved by technology

However, the design considerations for a 3D GUI are more complex than for a 2D GUI.
Unfortunately, each software program to date has tended to devote itself to one particular branch of science, and is constrained to a simple 2D “table-of-contents-like” user interface.
This is not the most effective visualization technique, and it utterly fails to show any relationships between the various scientific branches.

Method used


Image

  • Graphical user interface (GUI) for scientific reference comprising a three-dimentional, multi-framed unification of concept presentations
  • Graphical user interface (GUI) for scientific reference comprising a three-dimentional, multi-framed unification of concept presentations
  • Graphical user interface (GUI) for scientific reference comprising a three-dimentional, multi-framed unification of concept presentations

Examples


Embodiment Construction

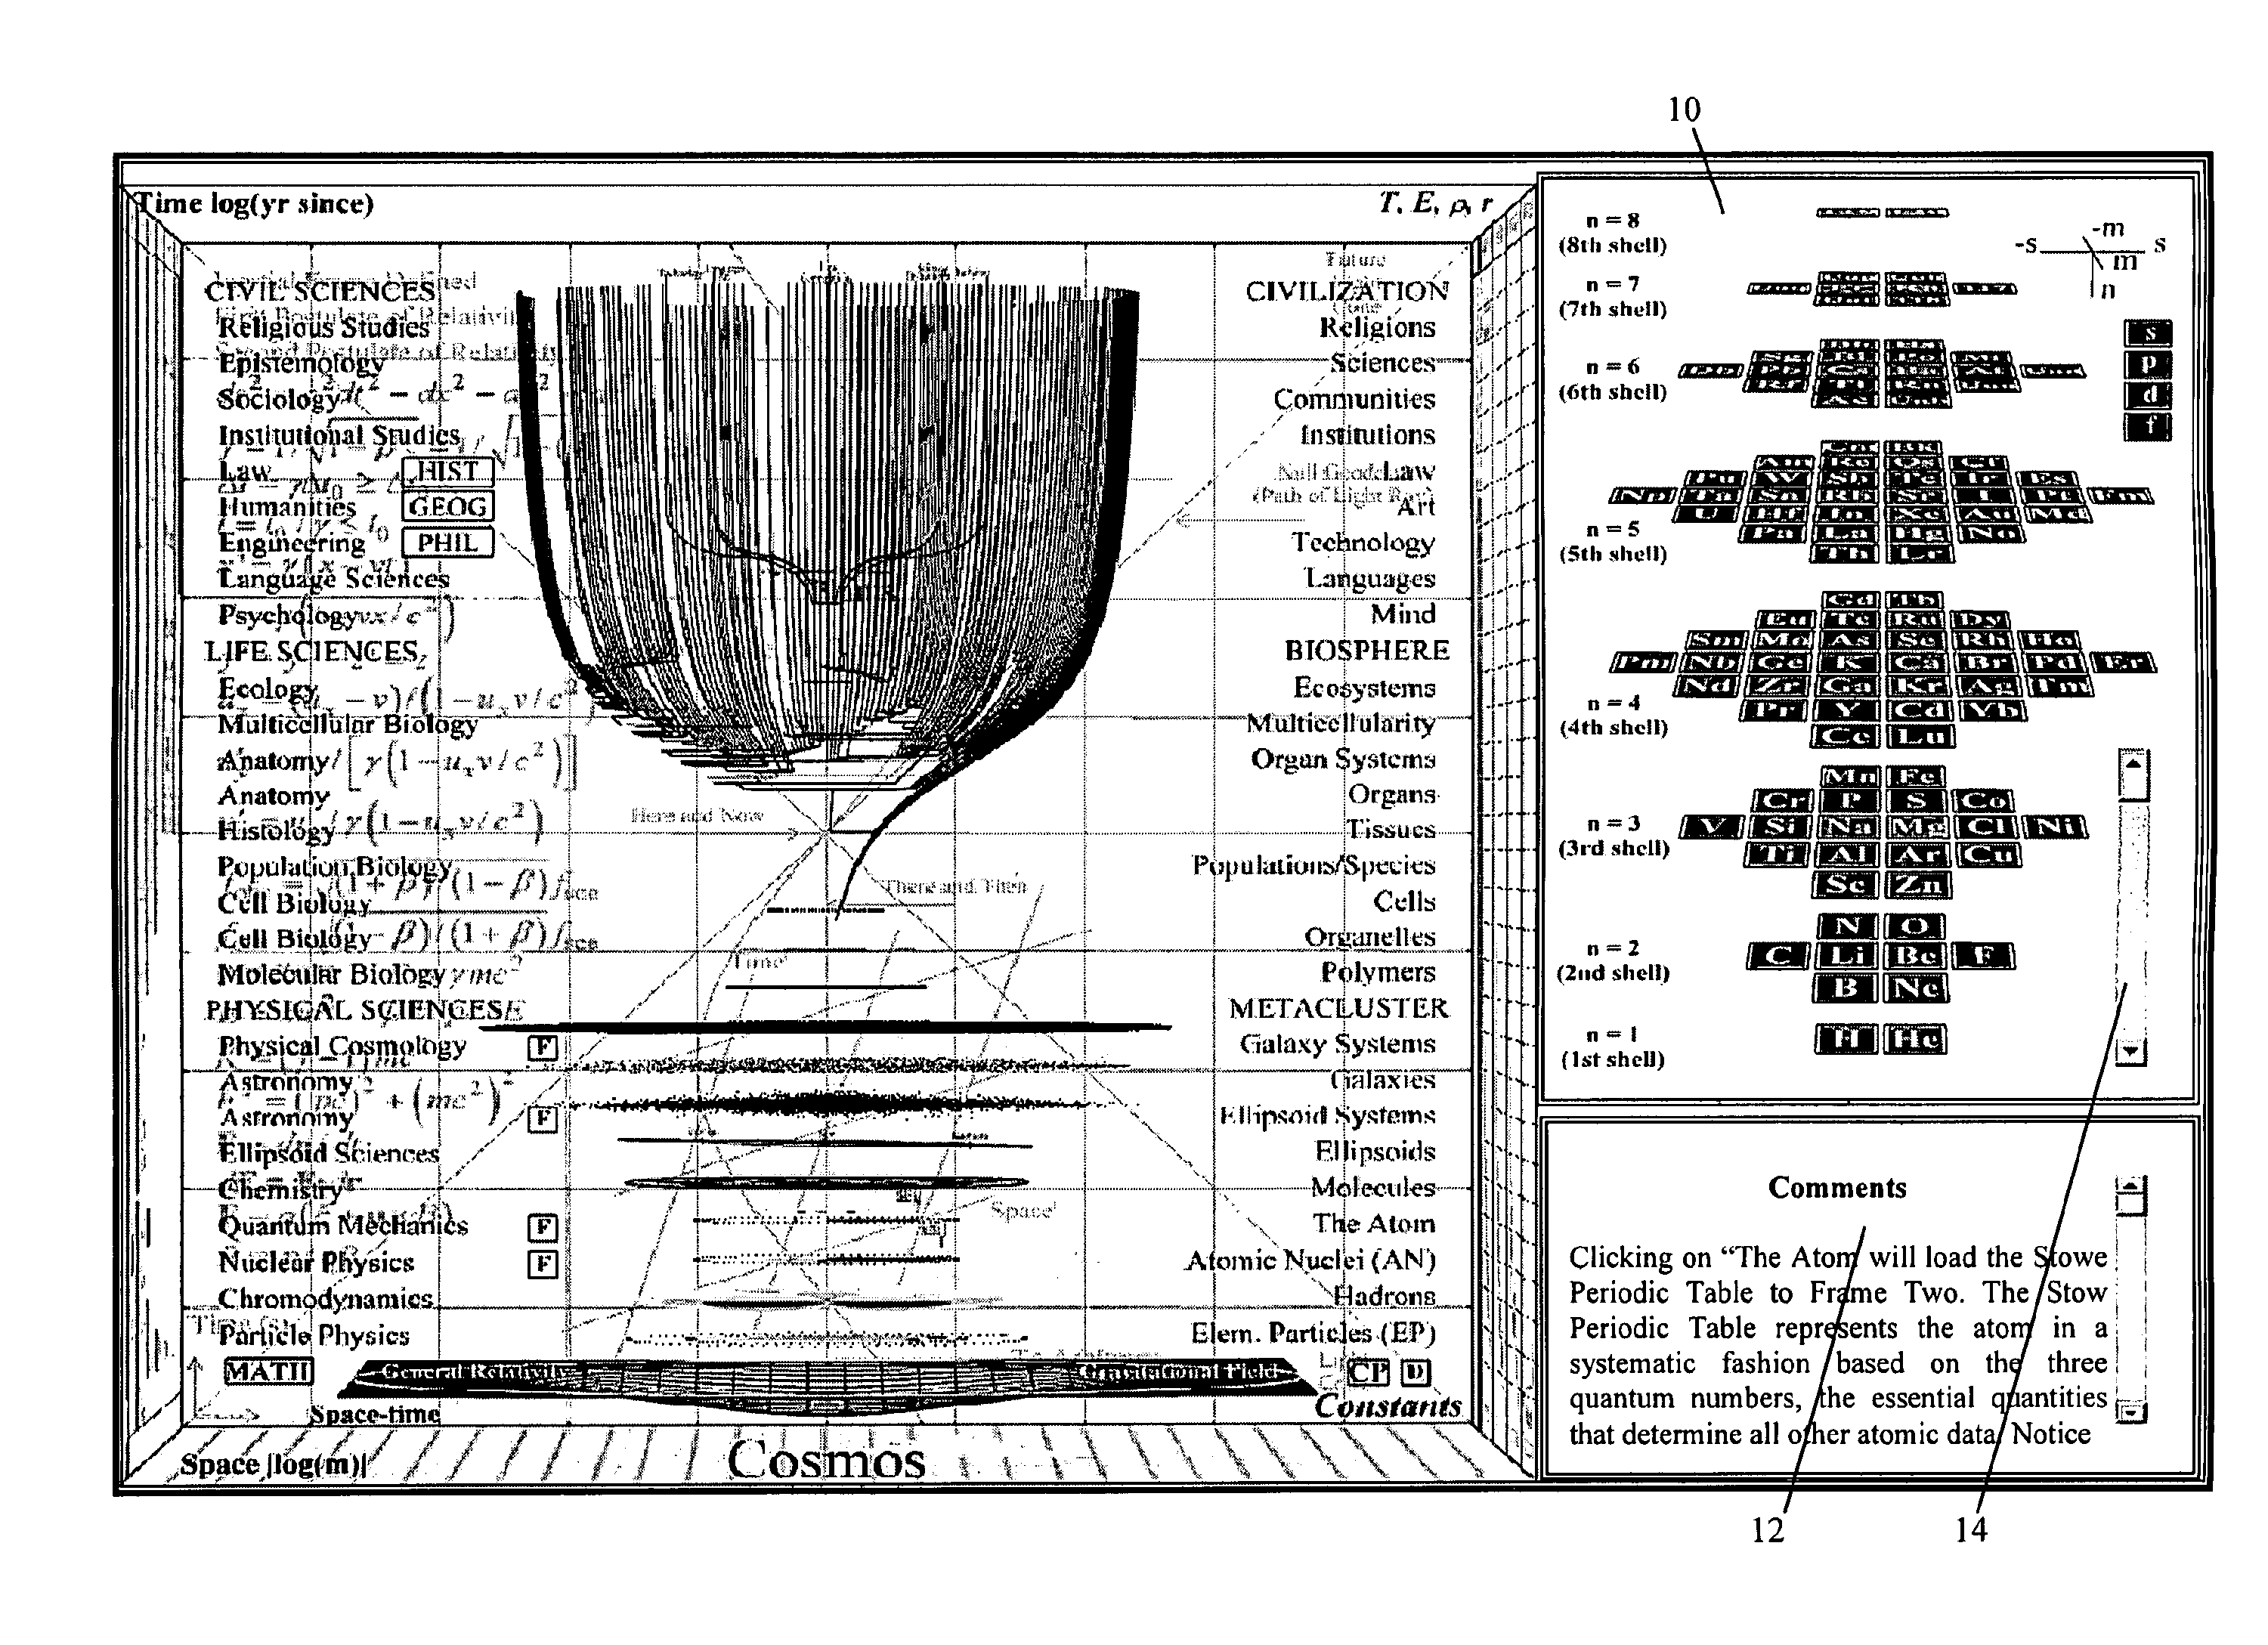
[0029]The present invention is a three-dimensional mapping software method, suitable for use as a scientific reference, that maps scientific and technical aspects of the known cosmos into a 3D time / space coordinate system. This software serves as a science-related reference tool: one that takes the form of a graphics-based summation of concepts. It is a useful source for data, concepts and graphical illustrations of most all phenomena, and is helpful to scientists, students and anyone who would otherwise use a scientific reference or encyclopedia.

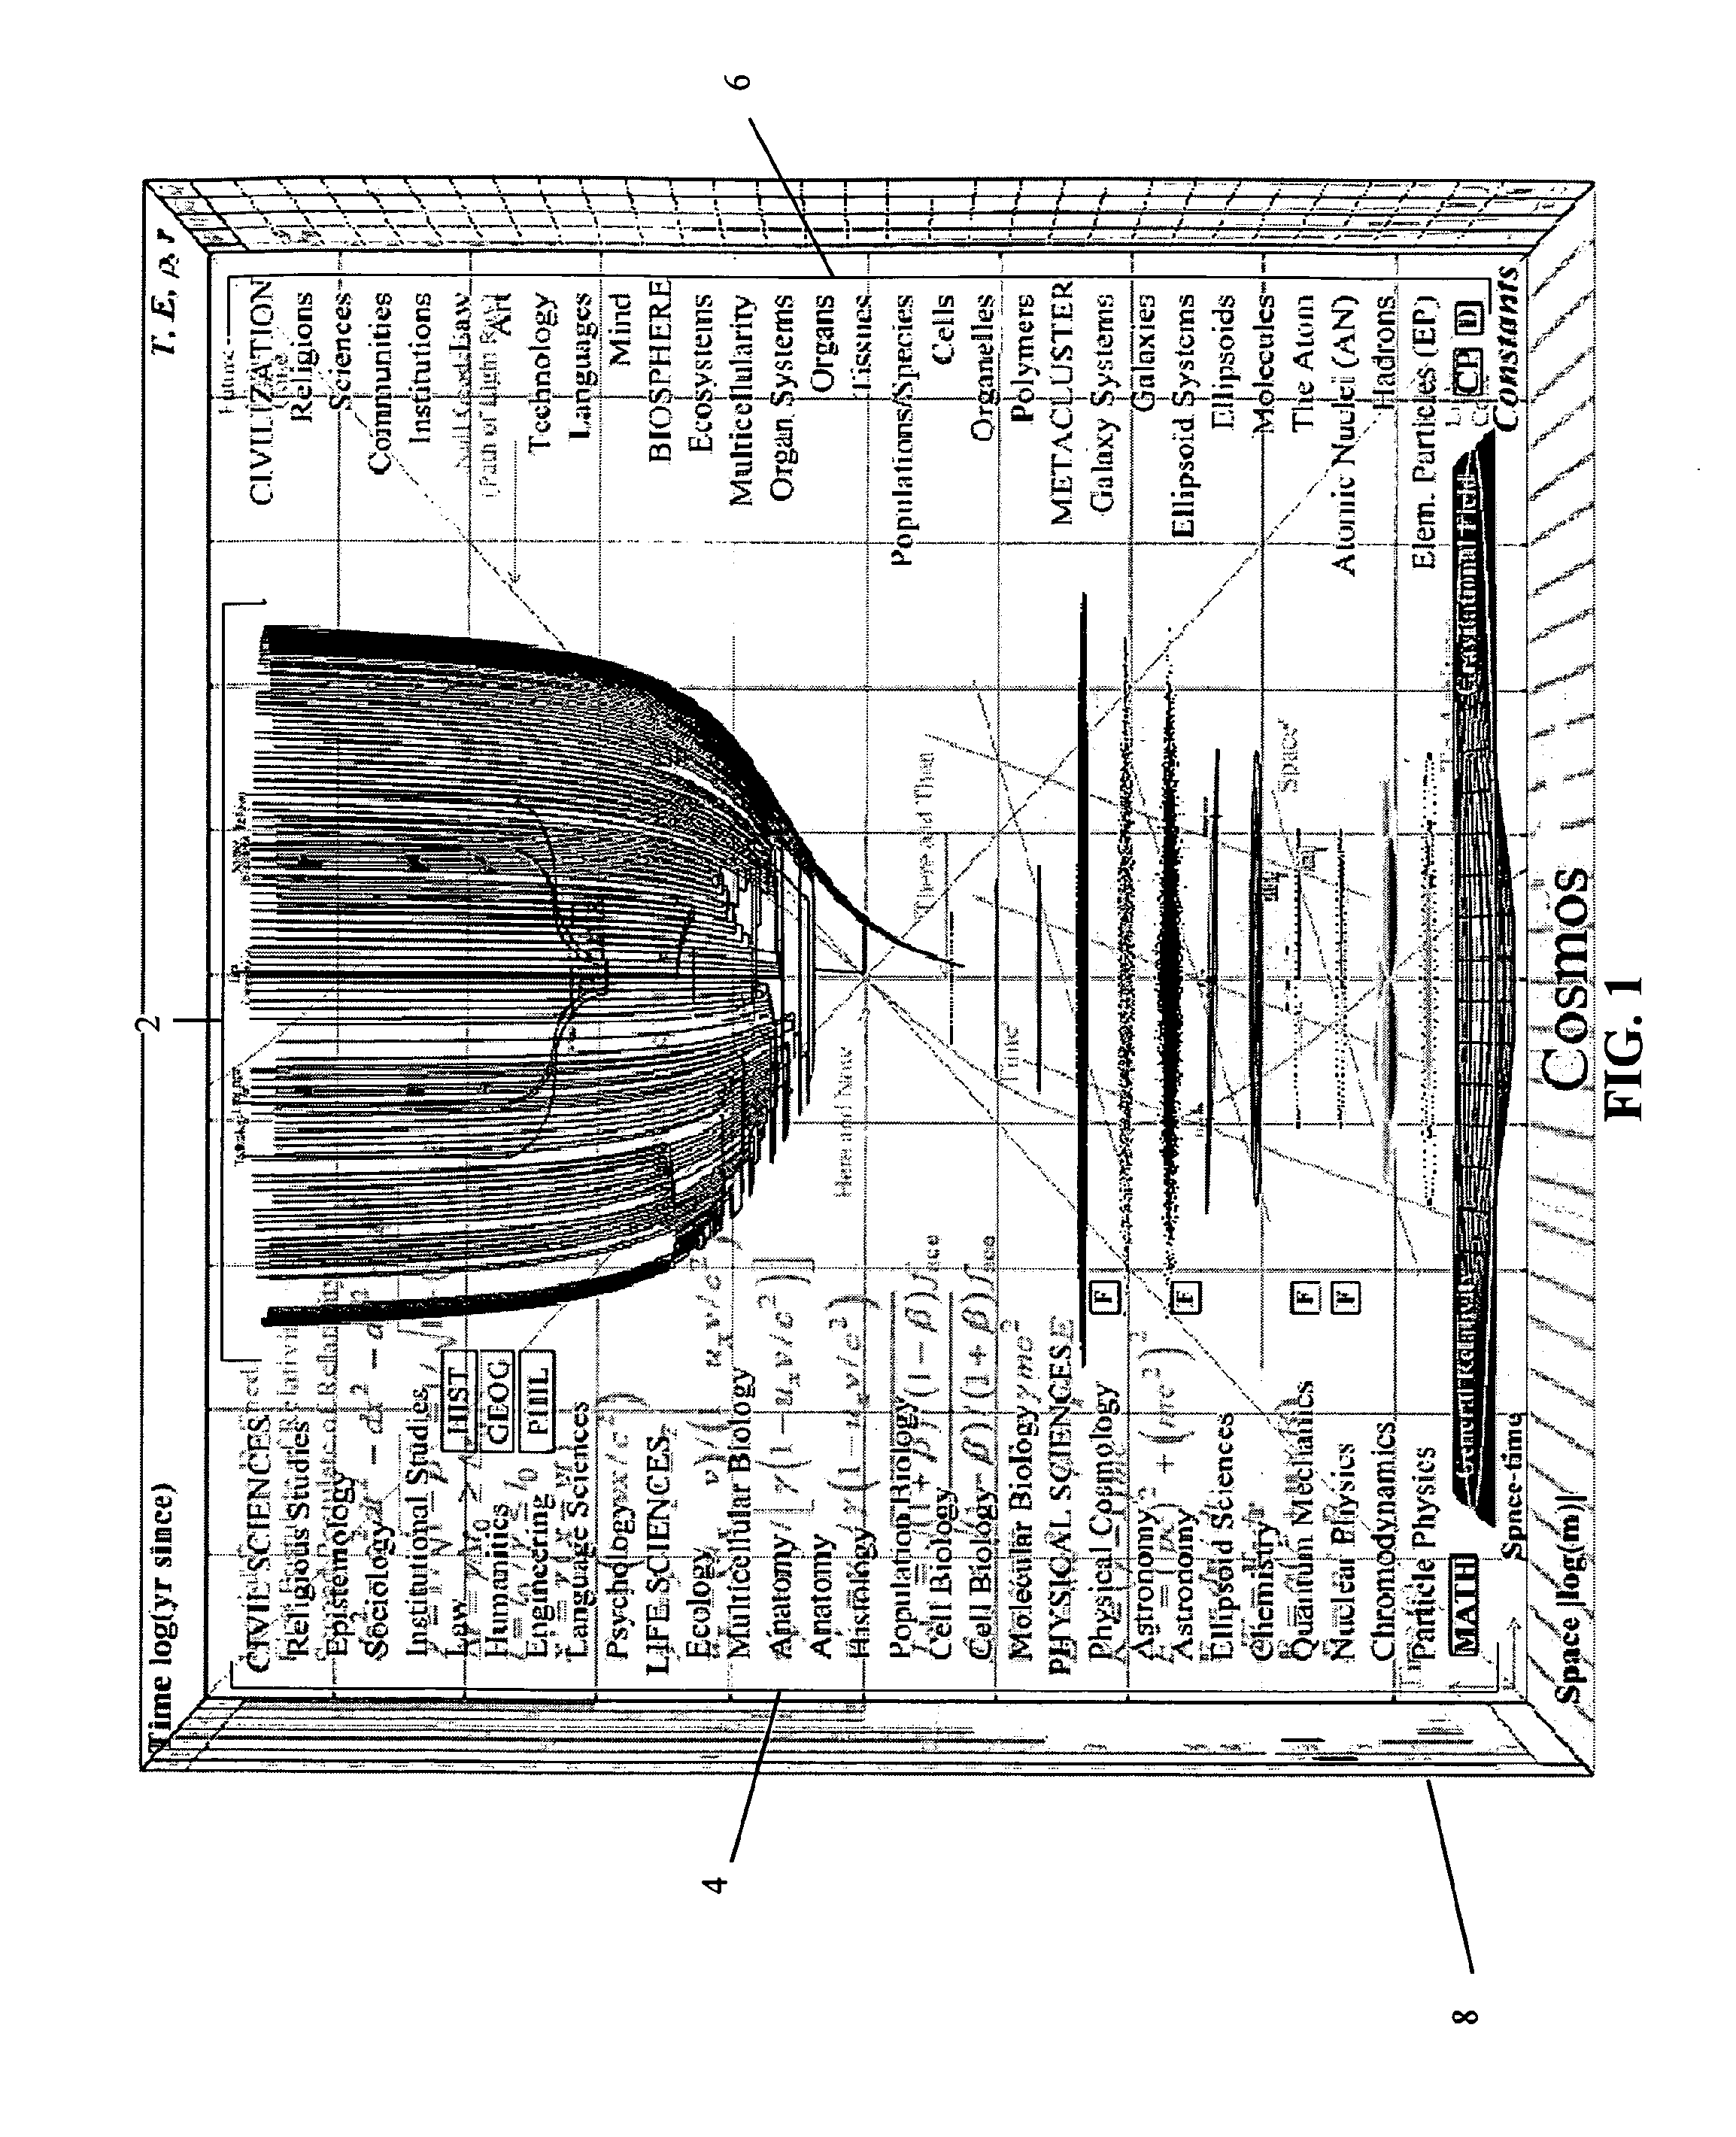
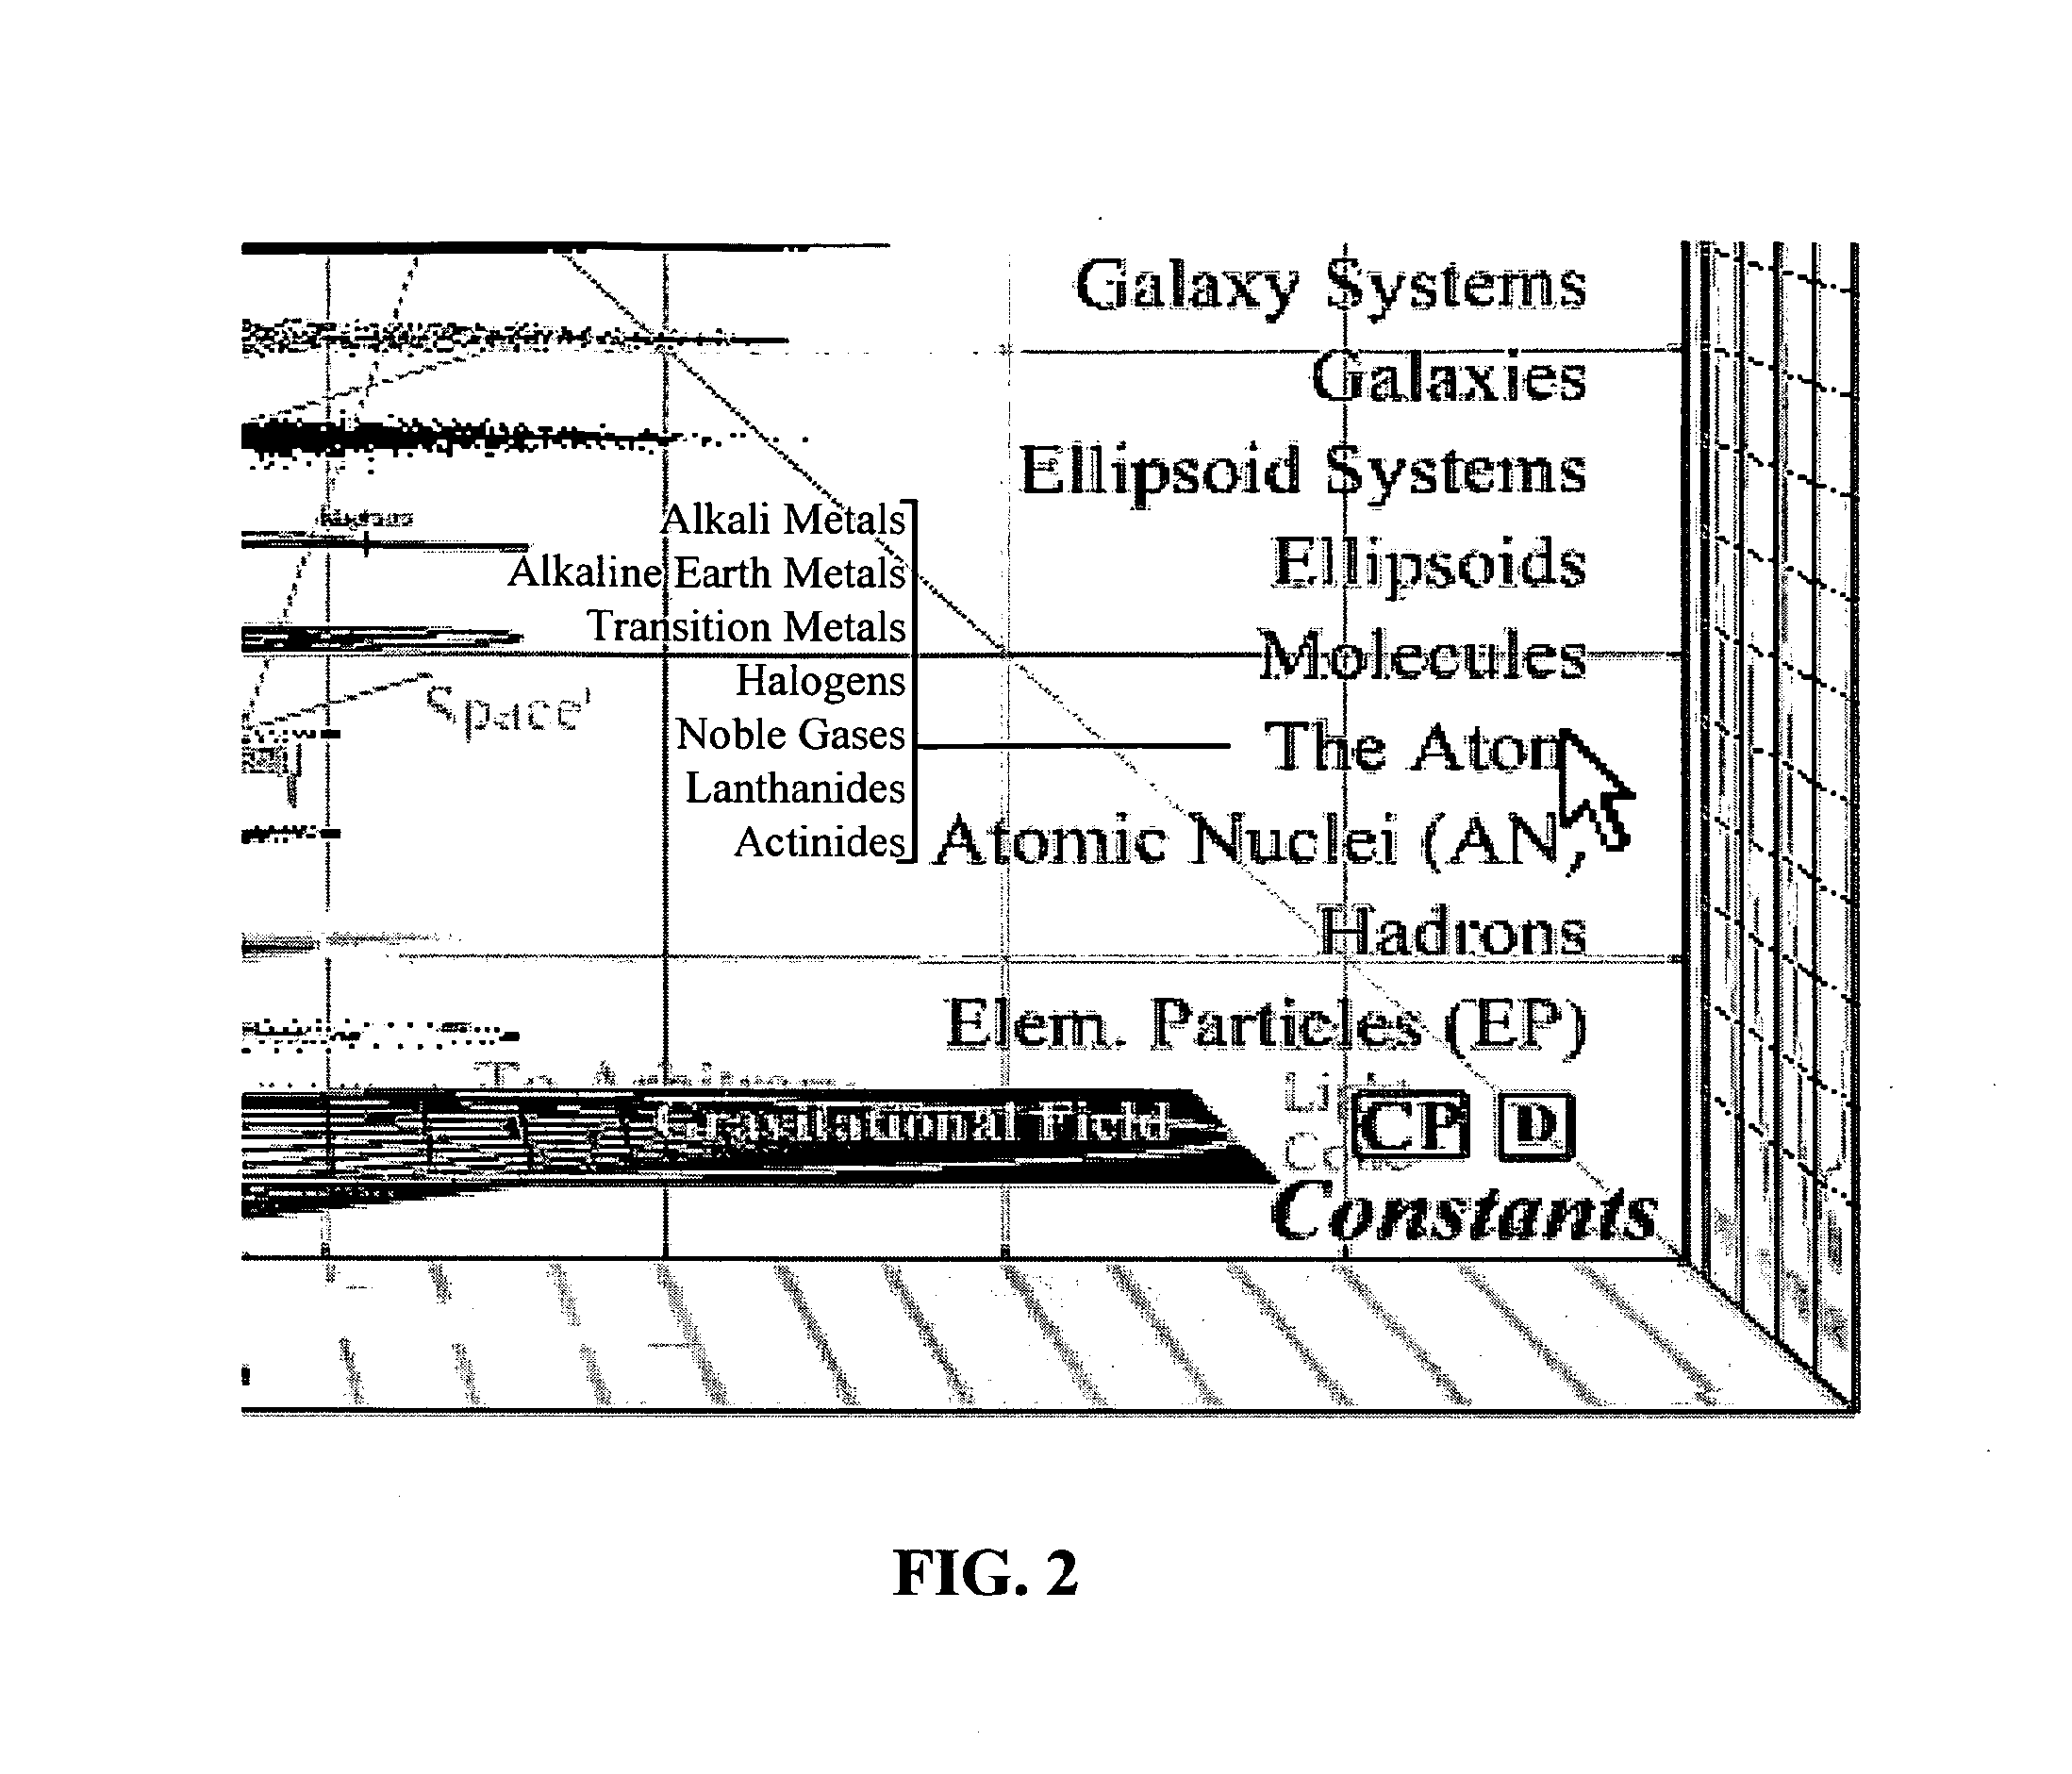
[0030]FIG. 1 is a screen print of the main user interface of the present invention, which appears as a user-navigable unified schematic for the cosmos as a whole, rendered by arranging within a time / space coordinate system the standard schematics for all particle, biological and civil science phenomena. The interface allows the user to drill down through levels of data to obtain detailed information much more quickly.

[0031]More specifically...


PUM


Abstract

A three-dimensional scientific reference software program for generating a graphical user interface is disclosed. The interface includes a categorical listing of primary science and humanities disciplines/sub-disciplines providing a hyperlink to detailed information, and a categorical listing of cosmological phenomena corresponding to the primary science and humanities disciplines/sub-disciplines. Including the foregoing categorical text listings, a 3D unified schematic is displayed representing the cosmos as a whole, including a composite of multiple individual diagrams representing a cosmological phenomena and plotted within a graphical time/space coordinate system. Anyone of the individual diagrams may be displayed in enlarged isolated format, and the user can drill down to obtain more detailed information on anyone of said phenomena. Controls are provided for manipulating the unified schematic in three-dimensional space. The scientific reference software serves as a 3D graphics-based summation of science and humanities concepts for expedient reference.

Description

BACKGROUND OF THE INVENTION[0001]1. Technical Field[0002]The invention relates to scientific reference tools and materials to help optimize the ability to retrieve scientific information. More particularly, the invention relates to scientific reference software including a graphical user interface (GUI) comprising a three-dimensional, multi-framed unification of scientific concept presentations (including civil, life, physical, biological, and astronomical sciences) to provide expedient access to detailed content and to highlight relationships heretofore unseen.[0003]2. Background Art[0004]Maps are used in many fields of endeavor to depict physical relationships. In this regard a map's visualization techniques are as important as its information content. When data is graphically presented using appropriate visualization techniques, it can accetuate key relationships, and stimulate discovery.[0005]Computers rely on maps called graphical user interfaces (GUI) which have become firmly ...

Claims


Application Information

Patent Timeline
Patent Type & Authority Applications(United States)
IPC IPC(8): G06F3/048G06F3/14
CPCG06F17/30061G06Q10/10G06F17/30064G06F16/444G06F16/447
Inventor CHANNON, MARTIN GERARD
Owner CHANNON MARTIN GERARD
Why Eureka
Try Eureka