Systems and Methods for Visualization of Data Analysis

a data analysis and data visualization technology, applied in the field of data visualization, can solve the problems of insufficient methods of analysis of large multidimensional datasets, insufficient computational efficiency, and clustering of tools often too blunt to identify important relationships

Active Publication Date: 2010-12-09
SYMPHONYAI SENSA LLC
View PDF15 Cites 172 Cited by
  • Summary
  • Abstract
  • Description
  • Claims
  • Application Information

AI Technical Summary

Problems solved by technology

Unfortunately, previous methods of analysis of large multidimensional datasets tend to be insufficient (if possible at all) to identify important relationships and may be computationally inefficient.
Clustering is often too blunt an instrument to identify important relationships in the data.
Similarly, previous methods of linear regression, projection pursuit, principal component analysis, and multidimensional scaling often do not reveal important relationships.
Existing linear algebraic and analytic methods are too sensitive to large scale distances and, as a result, lose detail.
Further, even if the data is analyzed, sophisticated experts are often necessary to interpret and understand the output of previous methods.
Although some previous methods allow graphs depicting some relationships in the data, the graphs are not interactive and require considerable time for a team of such experts to understand the relationships.
Further, the output of previous methods does not allow for exploratory data analysis where the analysis can be quickly modified to discover new relationships.

Method used


Image

  • Systems and Methods for Visualization of Data Analysis
  • Systems and Methods for Visualization of Data Analysis
  • Systems and Methods for Visualization of Data Analysis

Examples


Embodiment Construction

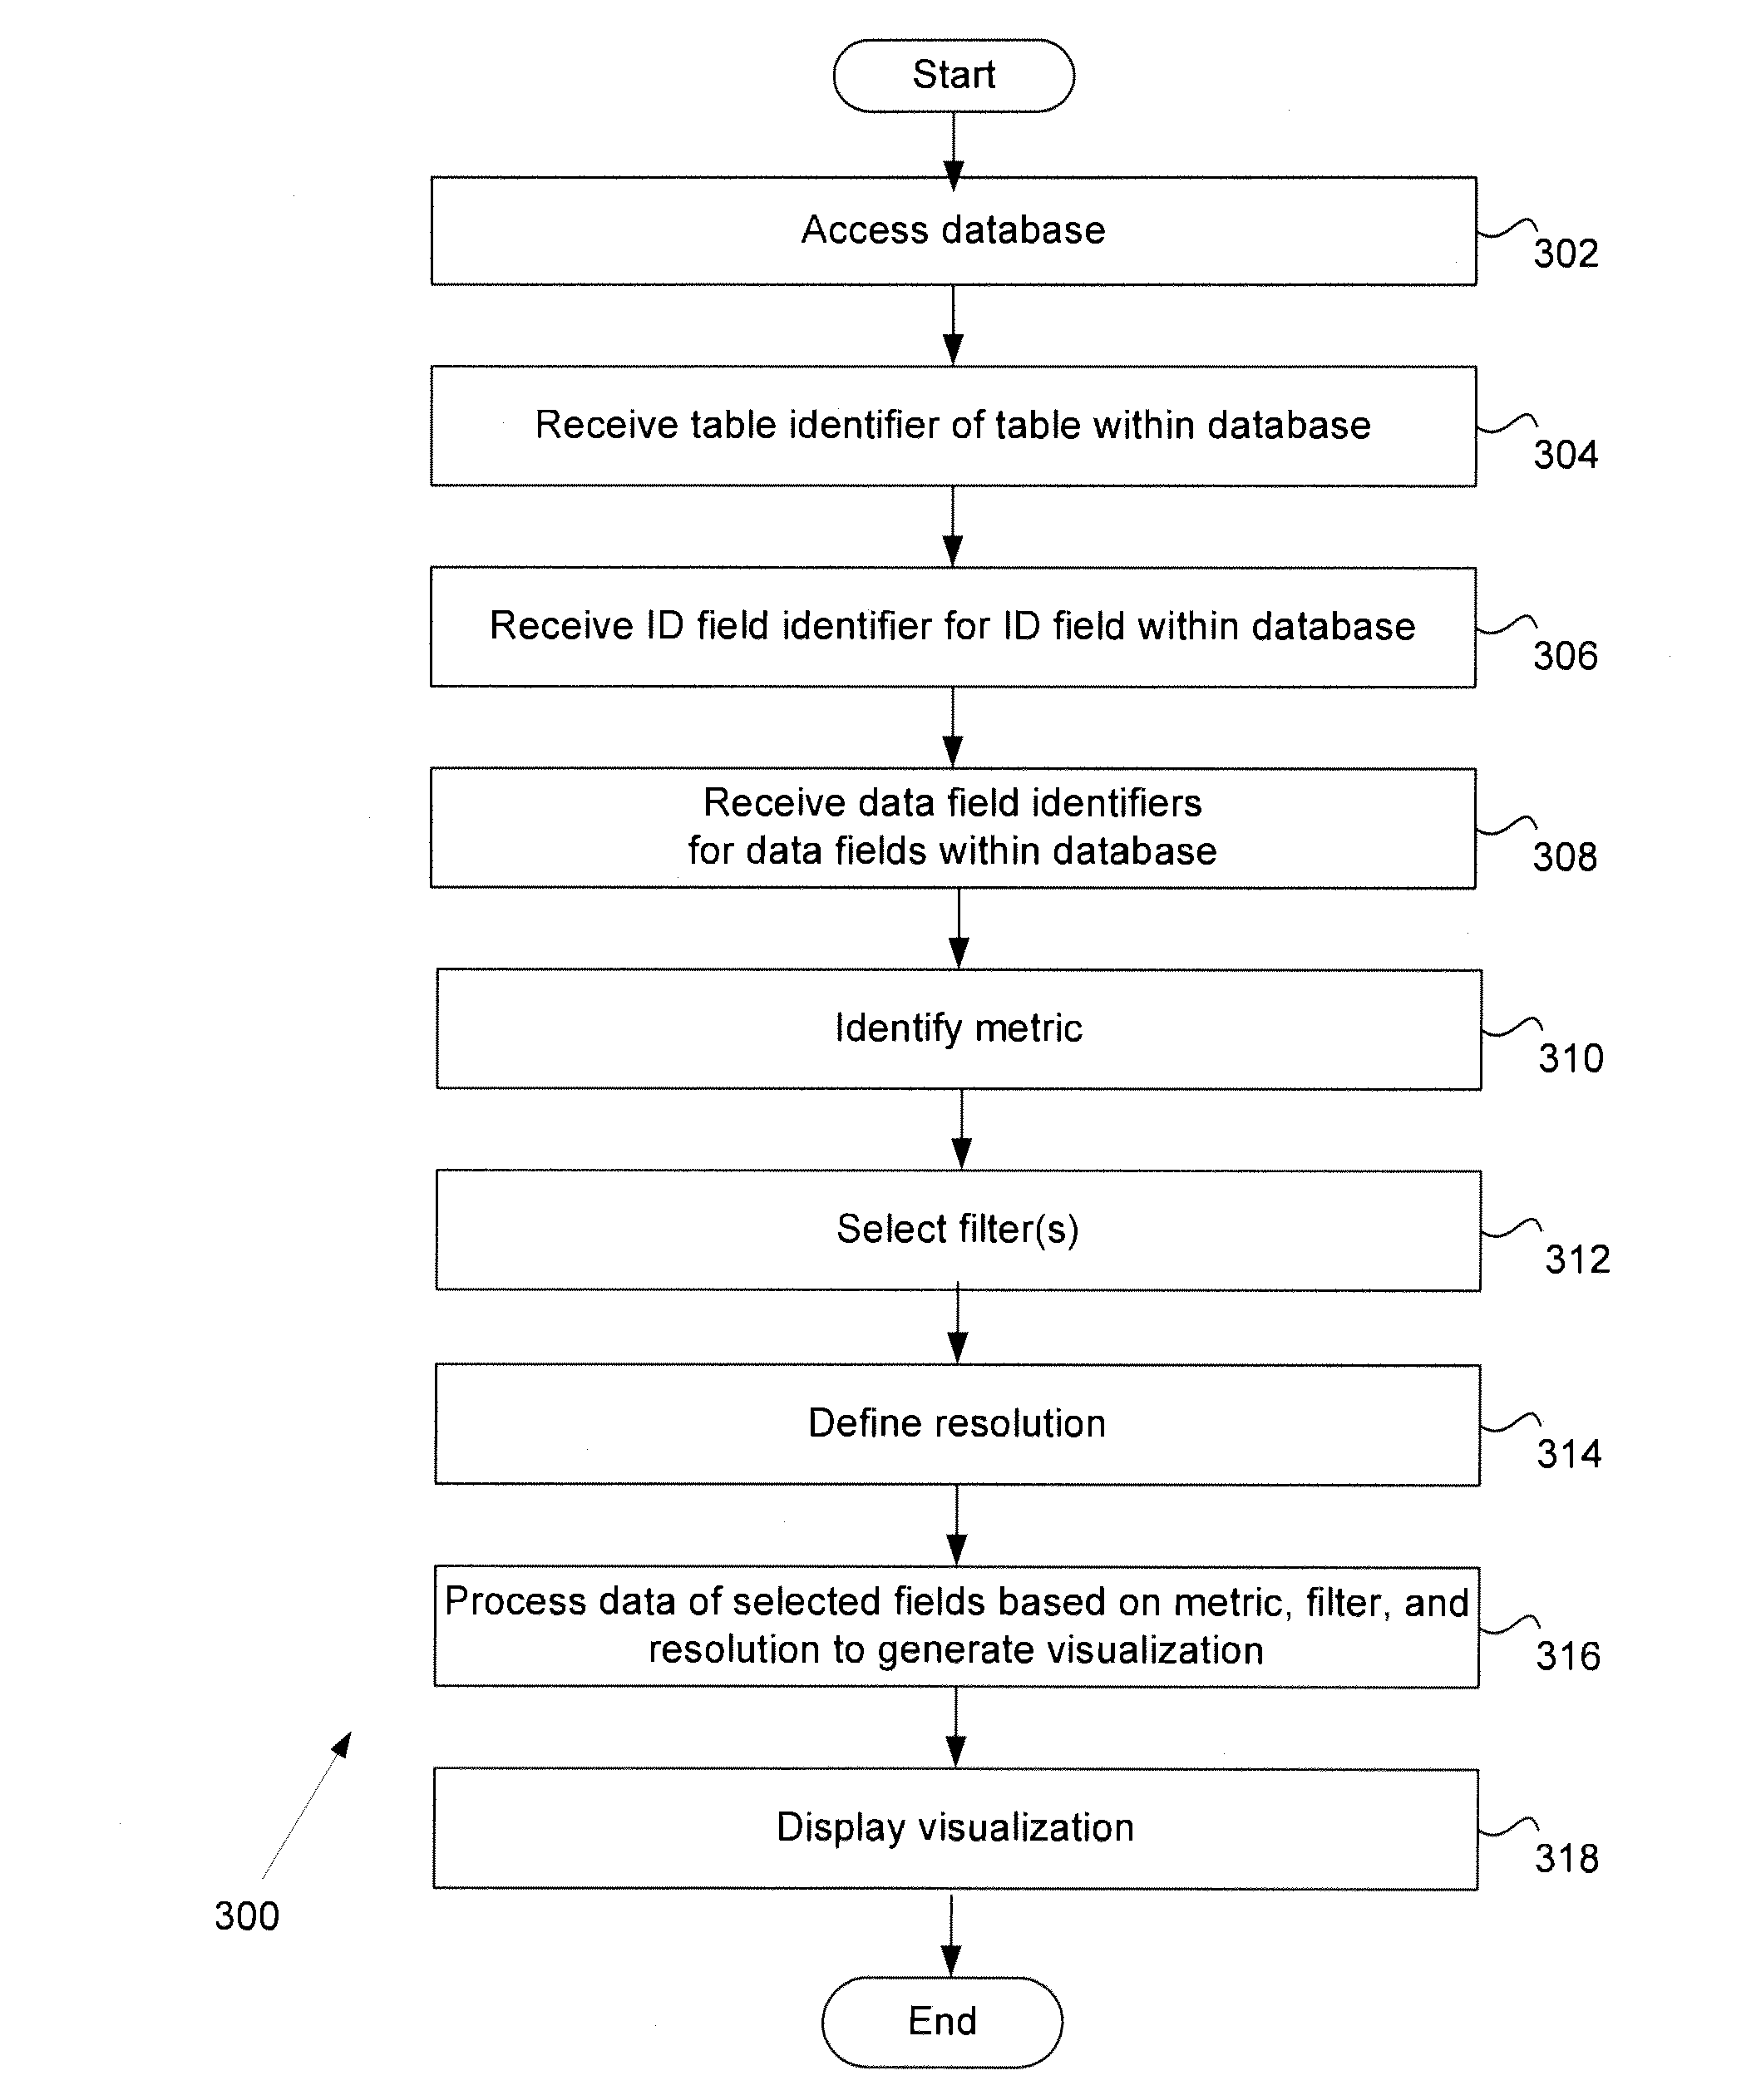
[0026]In various embodiments, a system for handling, analyzing, and visualizing data using drag and drop methods as opposed to text based methods is described herein. Philosophically, data analytic tools are not necessarily regarded as “solvers,” but rather as tools for interacting with data. For example, data analysis may consist of several iterations of a process in which computational tools point to regions of interest in a data set. The data set may then be examined by people with domain expertise concerning the data, and the data set may then be subjected to further computational analysis. In some embodiments, methods described herein provide for going back and forth between mathematical constructs, including interactive visualizations (e.g., graphs), on the one hand and data on the other.

[0027]In one example of data analysis in some embodiments described herein, an exemplary clustering tool is discussed which may be more powerful than existing technology, in that one can find ...


PUM


Abstract

Exemplary systems and methods for visualization of data analysis are provided. In various embodiments, a method comprises accessing a database, analyzing the database to identify clusters of data, generating an interactive visualization comprising a plurality of nodes and a plurality of edges wherein a first node of the plurality of nodes represents a cluster and an edge of the plurality of edges represents an intersection of nodes of the plurality of nodes, selecting and dragging the first node in response to a user action, and reorienting the interactive visualization in response to the user action of selecting and dragging the first node.

Description

CROSS REFERENCE TO RELATED APPLICATIONS[0001]This application seeks priority to U.S. provisional application Ser. No. 61 / 151,488, entitled “Mapper: an Environment for Visual Data Analysis,” filed Feb. 10, 2009, which is hereby incorporated by reference herein.BACKGROUND[0002]1. Field of the Invention[0003]Embodiments of the present invention are directed to visualization of data analysis and more particularly to displaying an interactive visualization of the analysis.[0004]2. Related Art[0005]As the collection and storage data has increased, there is an increased need to analyze and make sense of large amounts of data. Examples of large datasets may be found in financial services companies, oil expiration, biotech, and academia. Unfortunately, previous methods of analysis of large multidimensional datasets tend to be insufficient (if possible at all) to identify important relationships and may be computationally inefficient.[0006]In one example, previous methods of analysis often us...

Claims


Application Information

Patent Timeline
Patent Type & Authority Applications(United States)
IPC IPC(8): G06F17/30G06F3/048
CPCG06F16/287G06F16/288G06F3/0484G06F3/04842
Inventor CARLSSON, GUNNARSEXTON, HARLANSINGH, GURJEET
Owner SYMPHONYAI SENSA LLC
Why Eureka
Try Eureka