Data Visualization Interface

a data visualization and interface technology, applied in the field of data visualization interface generation, can solve the problems of affecting the efforts of those managing a business to quickly understand the significance, complicated interrelationships, and tedious generation

Inactive Publication Date: 2012-07-26
OPDOTS
View PDF8 Cites 112 Cited by
  • Summary
  • Abstract
  • Description
  • Claims
  • Application Information

AI Technical Summary

Problems solved by technology

Further, some data may reflect potentially complex interrelationships between other portions of the data.
Frequently, however, the amount of data and complexity of relationships between various fields of data impedes efforts by those managing a business to quickly understand the significance of the data to their business.
These reports are typically tedious to generate, offer relatively limited understanding of the data, and in the event that the reports inspire additional lines of inquiry by their audience, another round of querying and reports is often required, thereby slowing the process of investigating the data.
More sophisticated tools for analyzing business data than Excel exist, but these tools are often difficult to op

Method used


Image

  • Data Visualization Interface
  • Data Visualization Interface
  • Data Visualization Interface

Examples


Embodiment Construction

[0023]One or more specific embodiments of the present invention will be described below. In an effort to provide a concise description of these embodiments, not all features of an actual implementation are described in the specification. It should be appreciated that in the development of any such actual implementation, as in any engineering or design project, numerous implementation-specific decisions must be made to achieve the developers' specific goals, such as compliance with system-related and business-related constraints, which may vary from one implementation to another. Moreover, it should be appreciated that such a development effort might be complex and time consuming but would nevertheless be a routine undertaking of design, implementation, and manufacture for those of ordinary skill having the benefit of this disclosure.

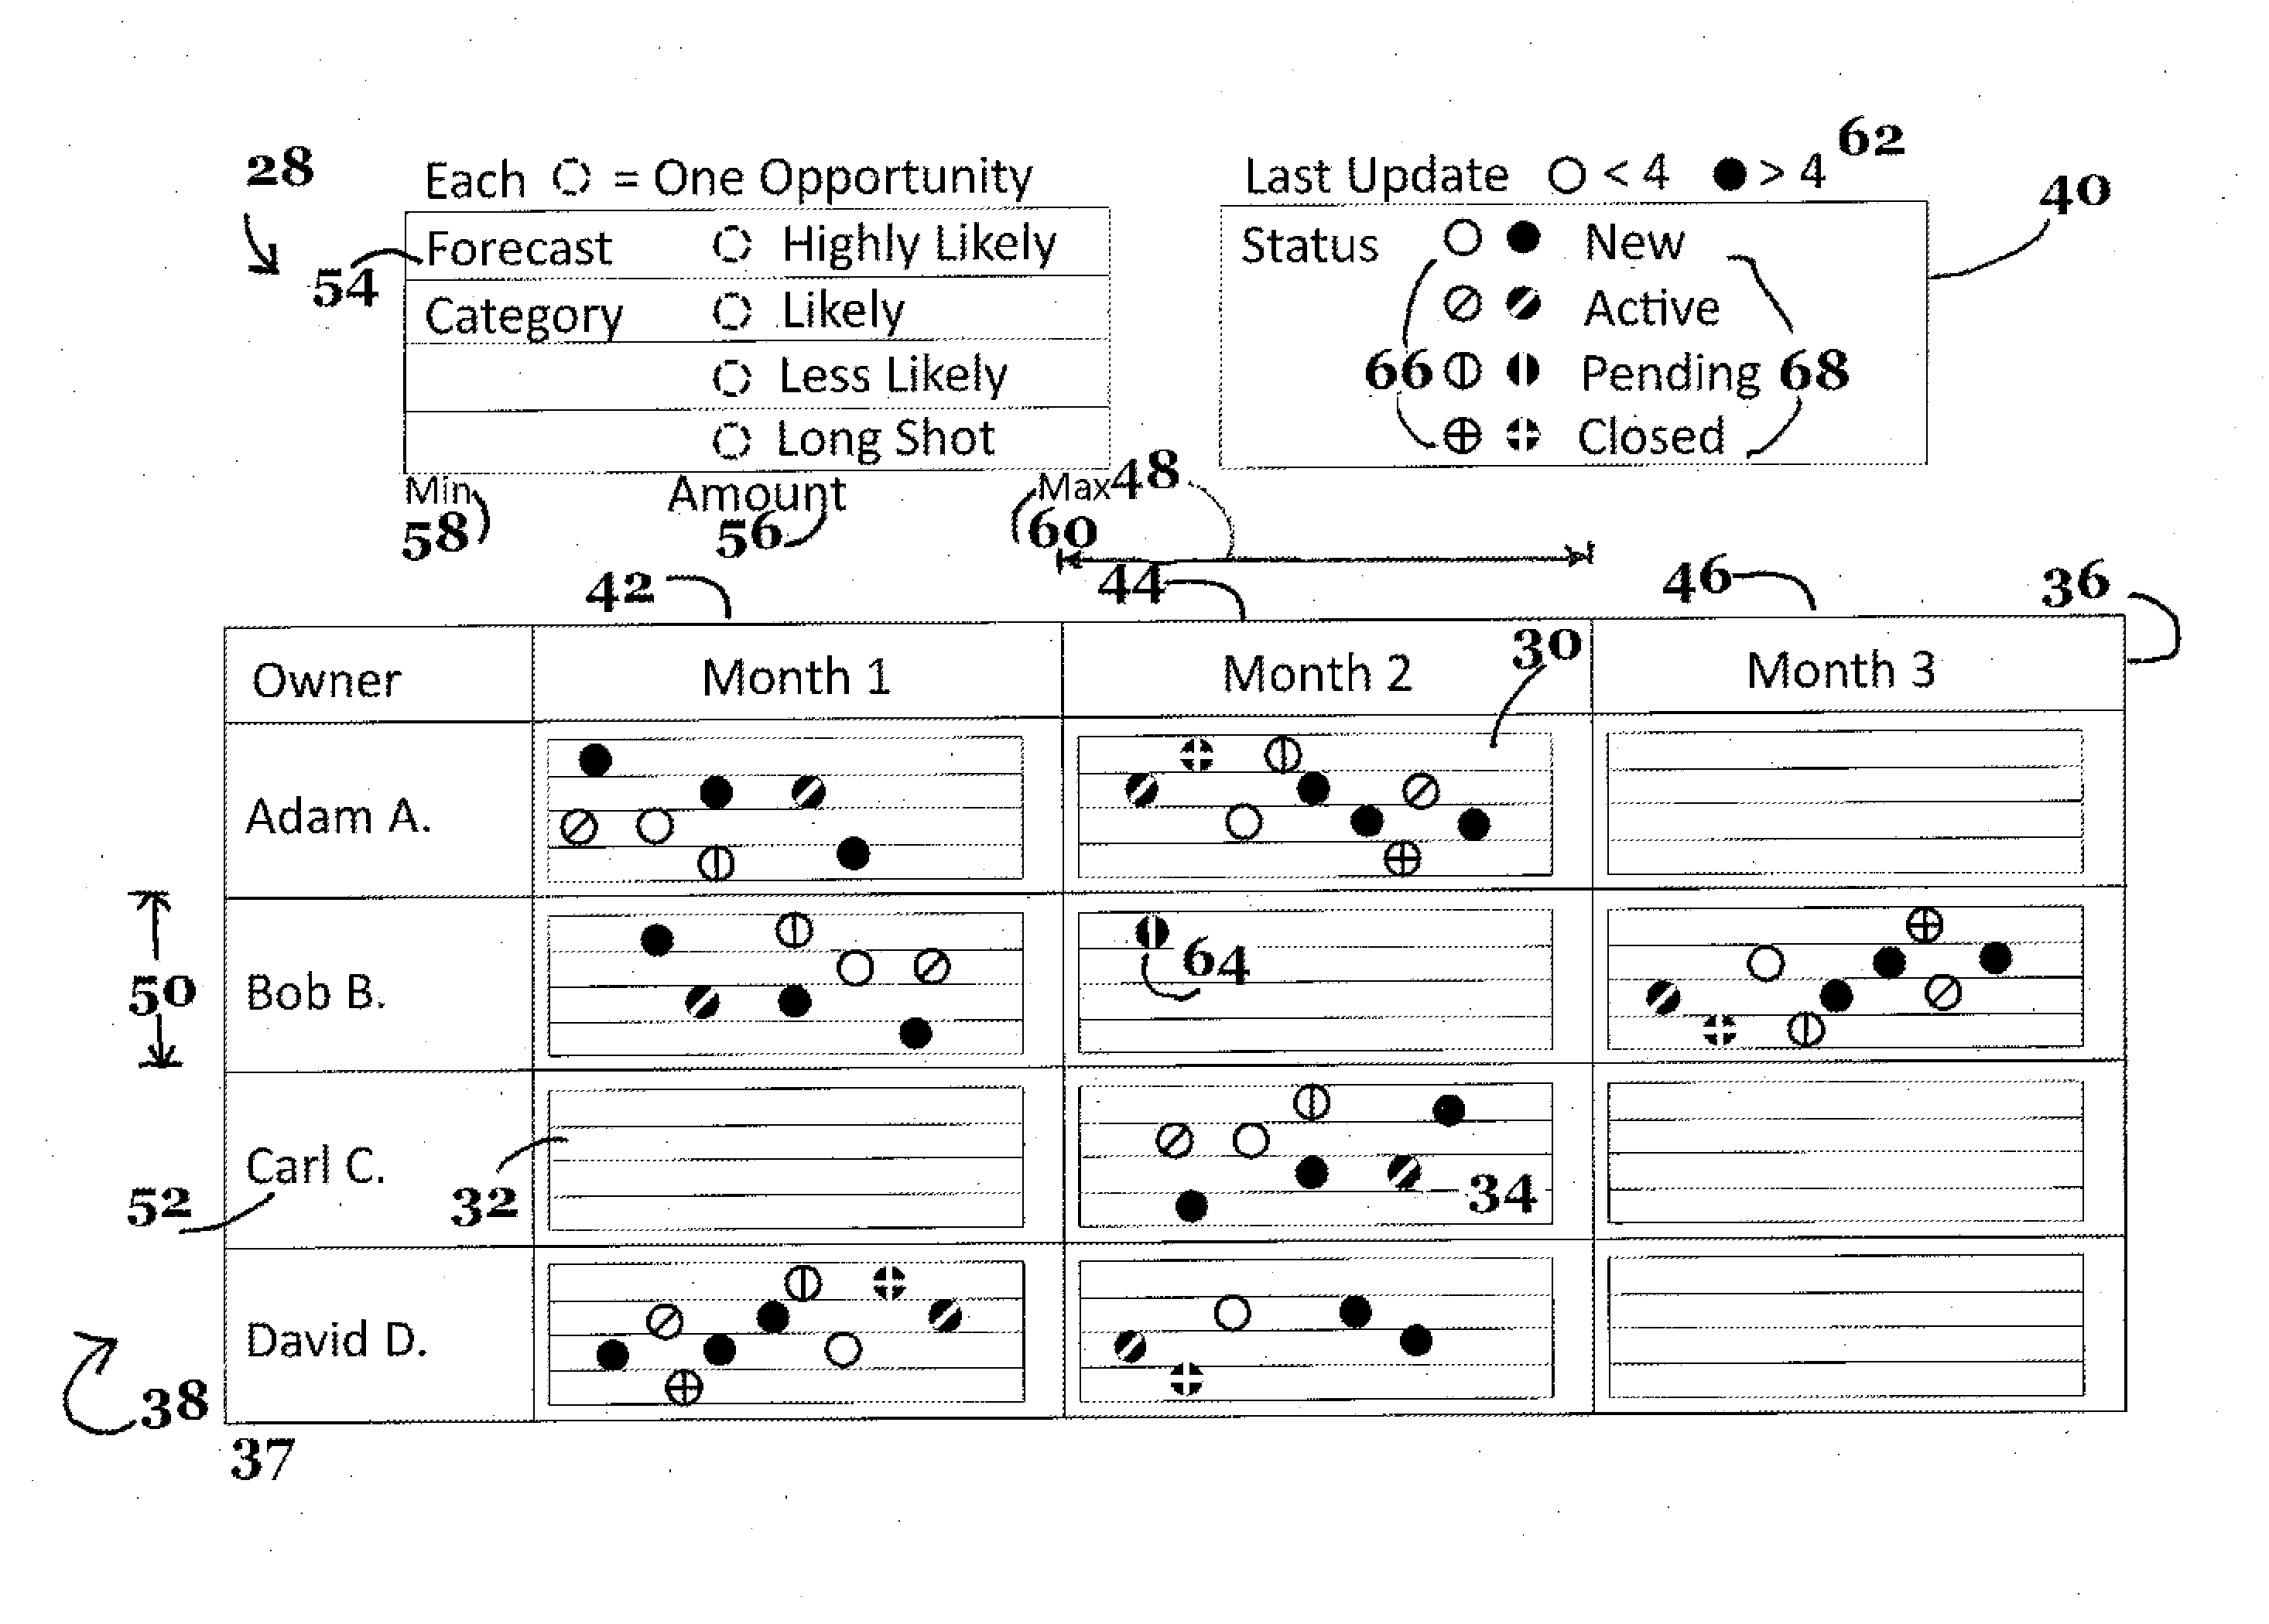
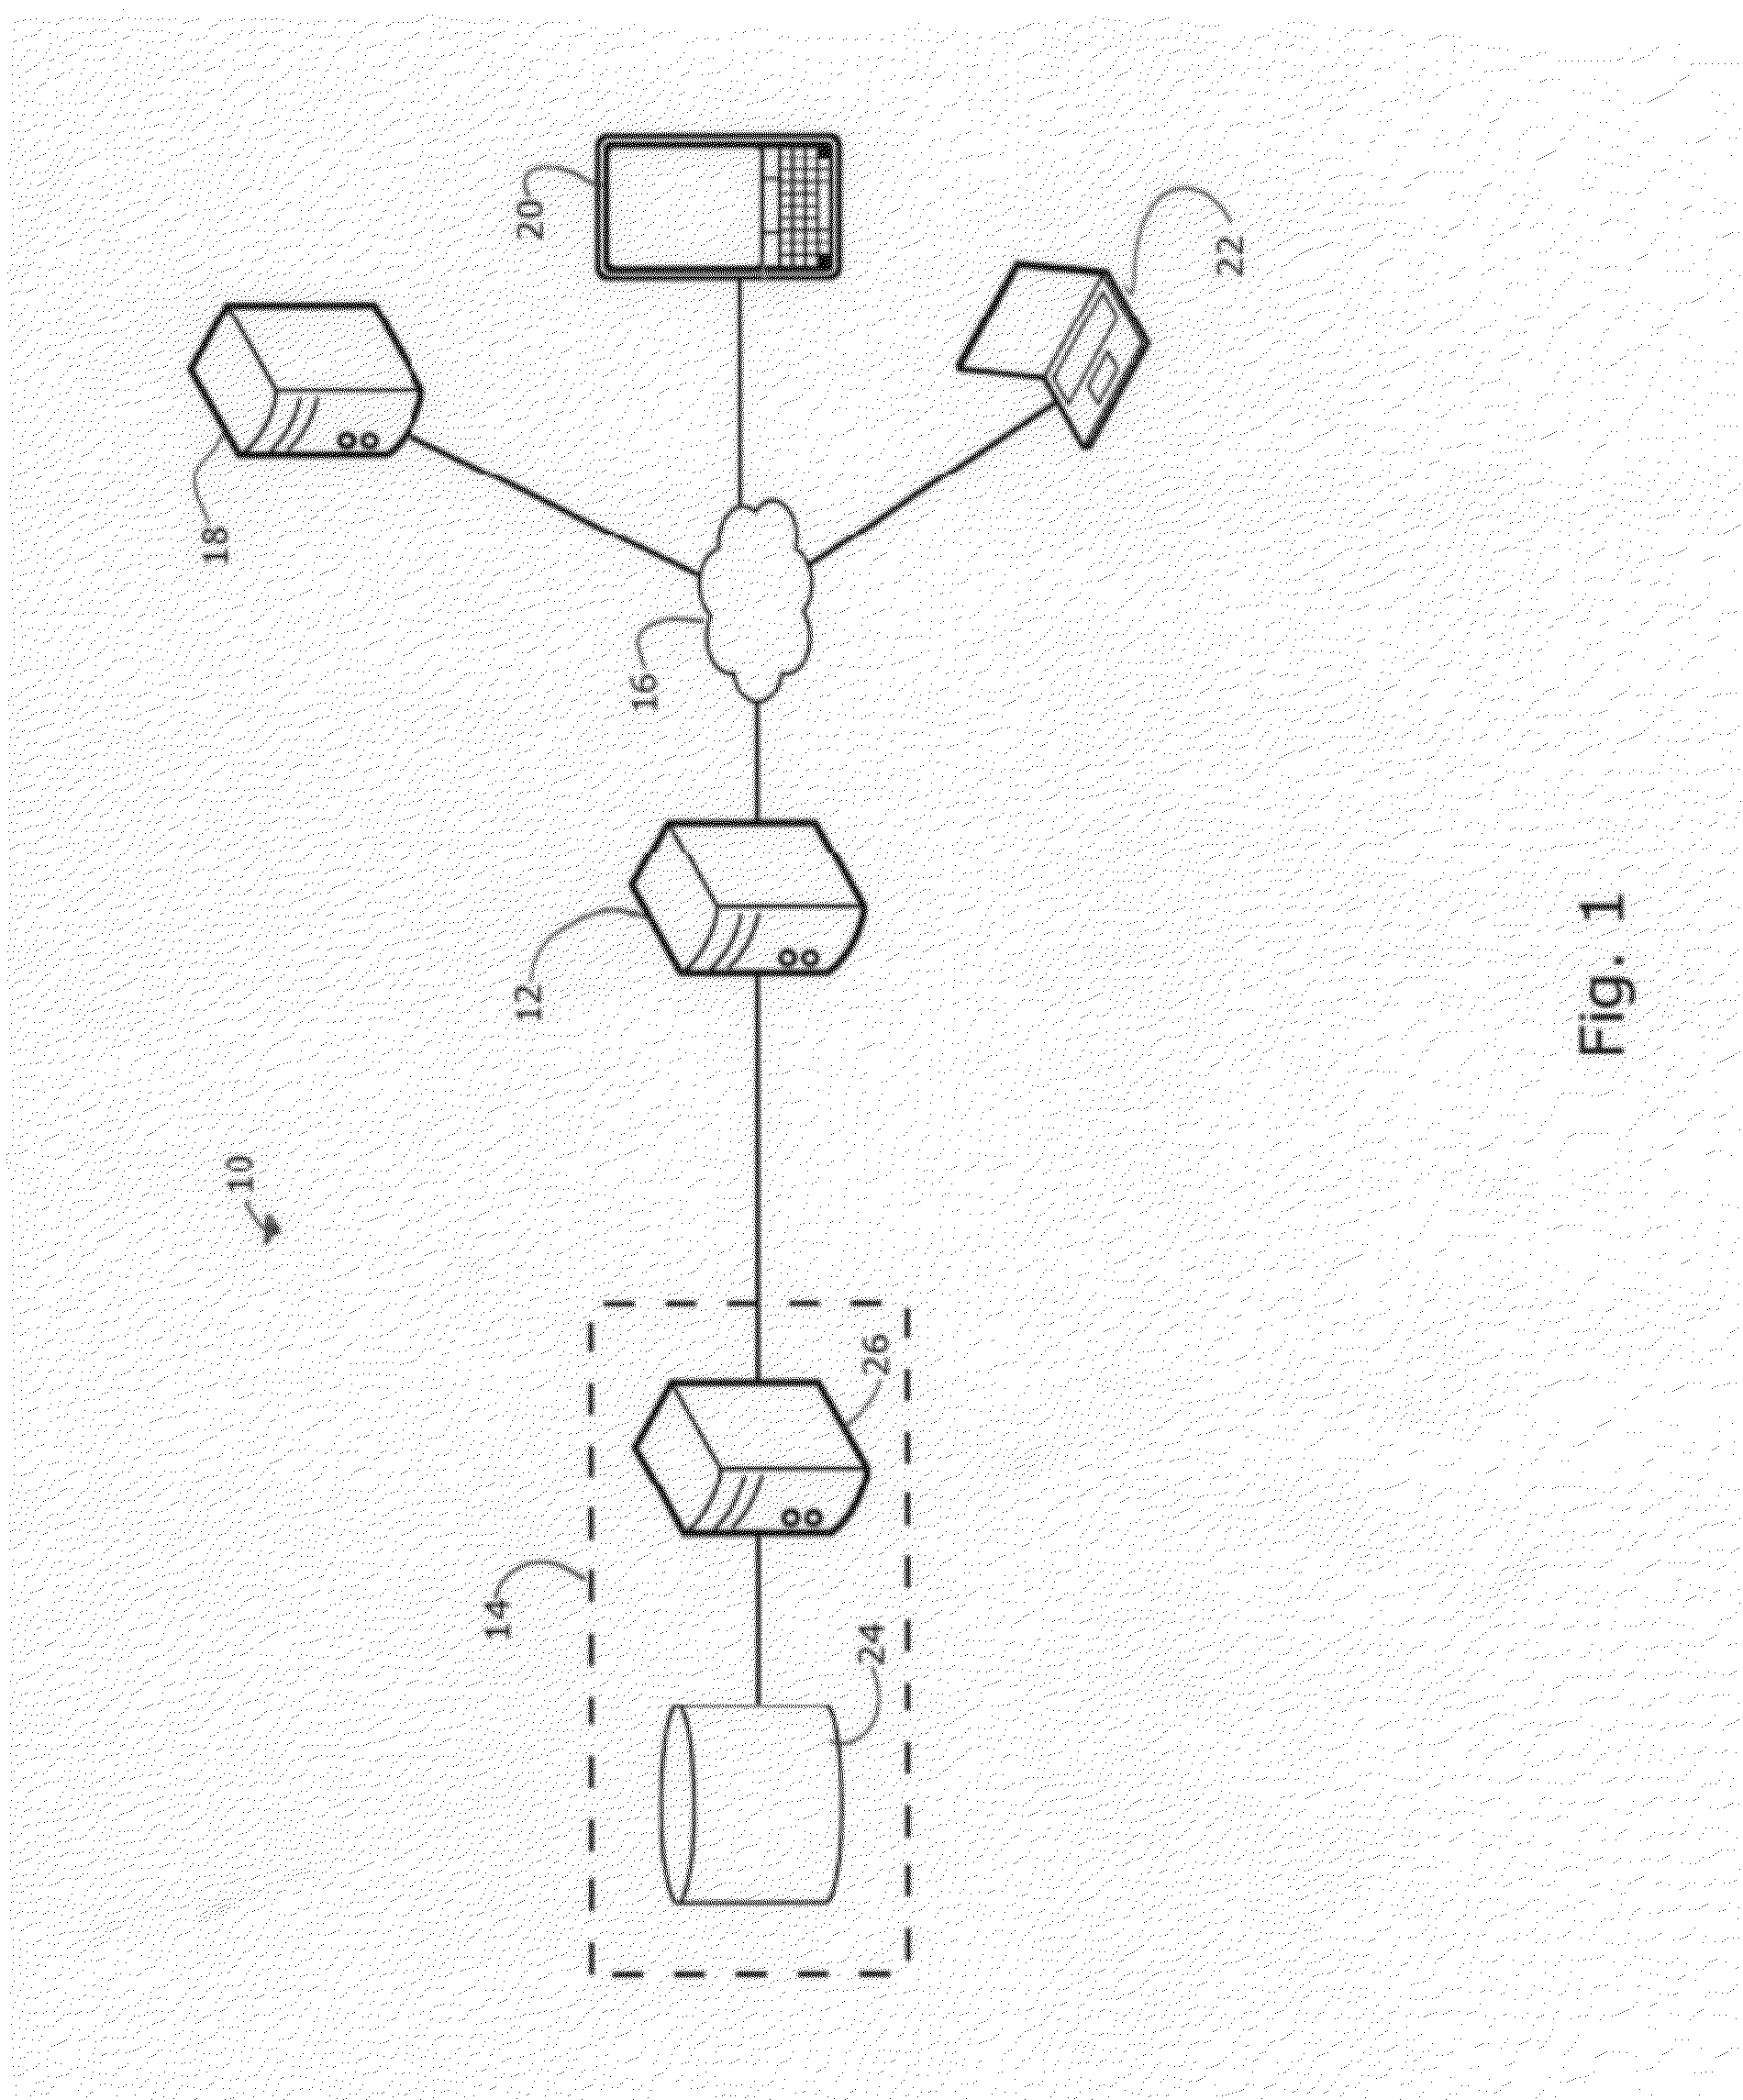
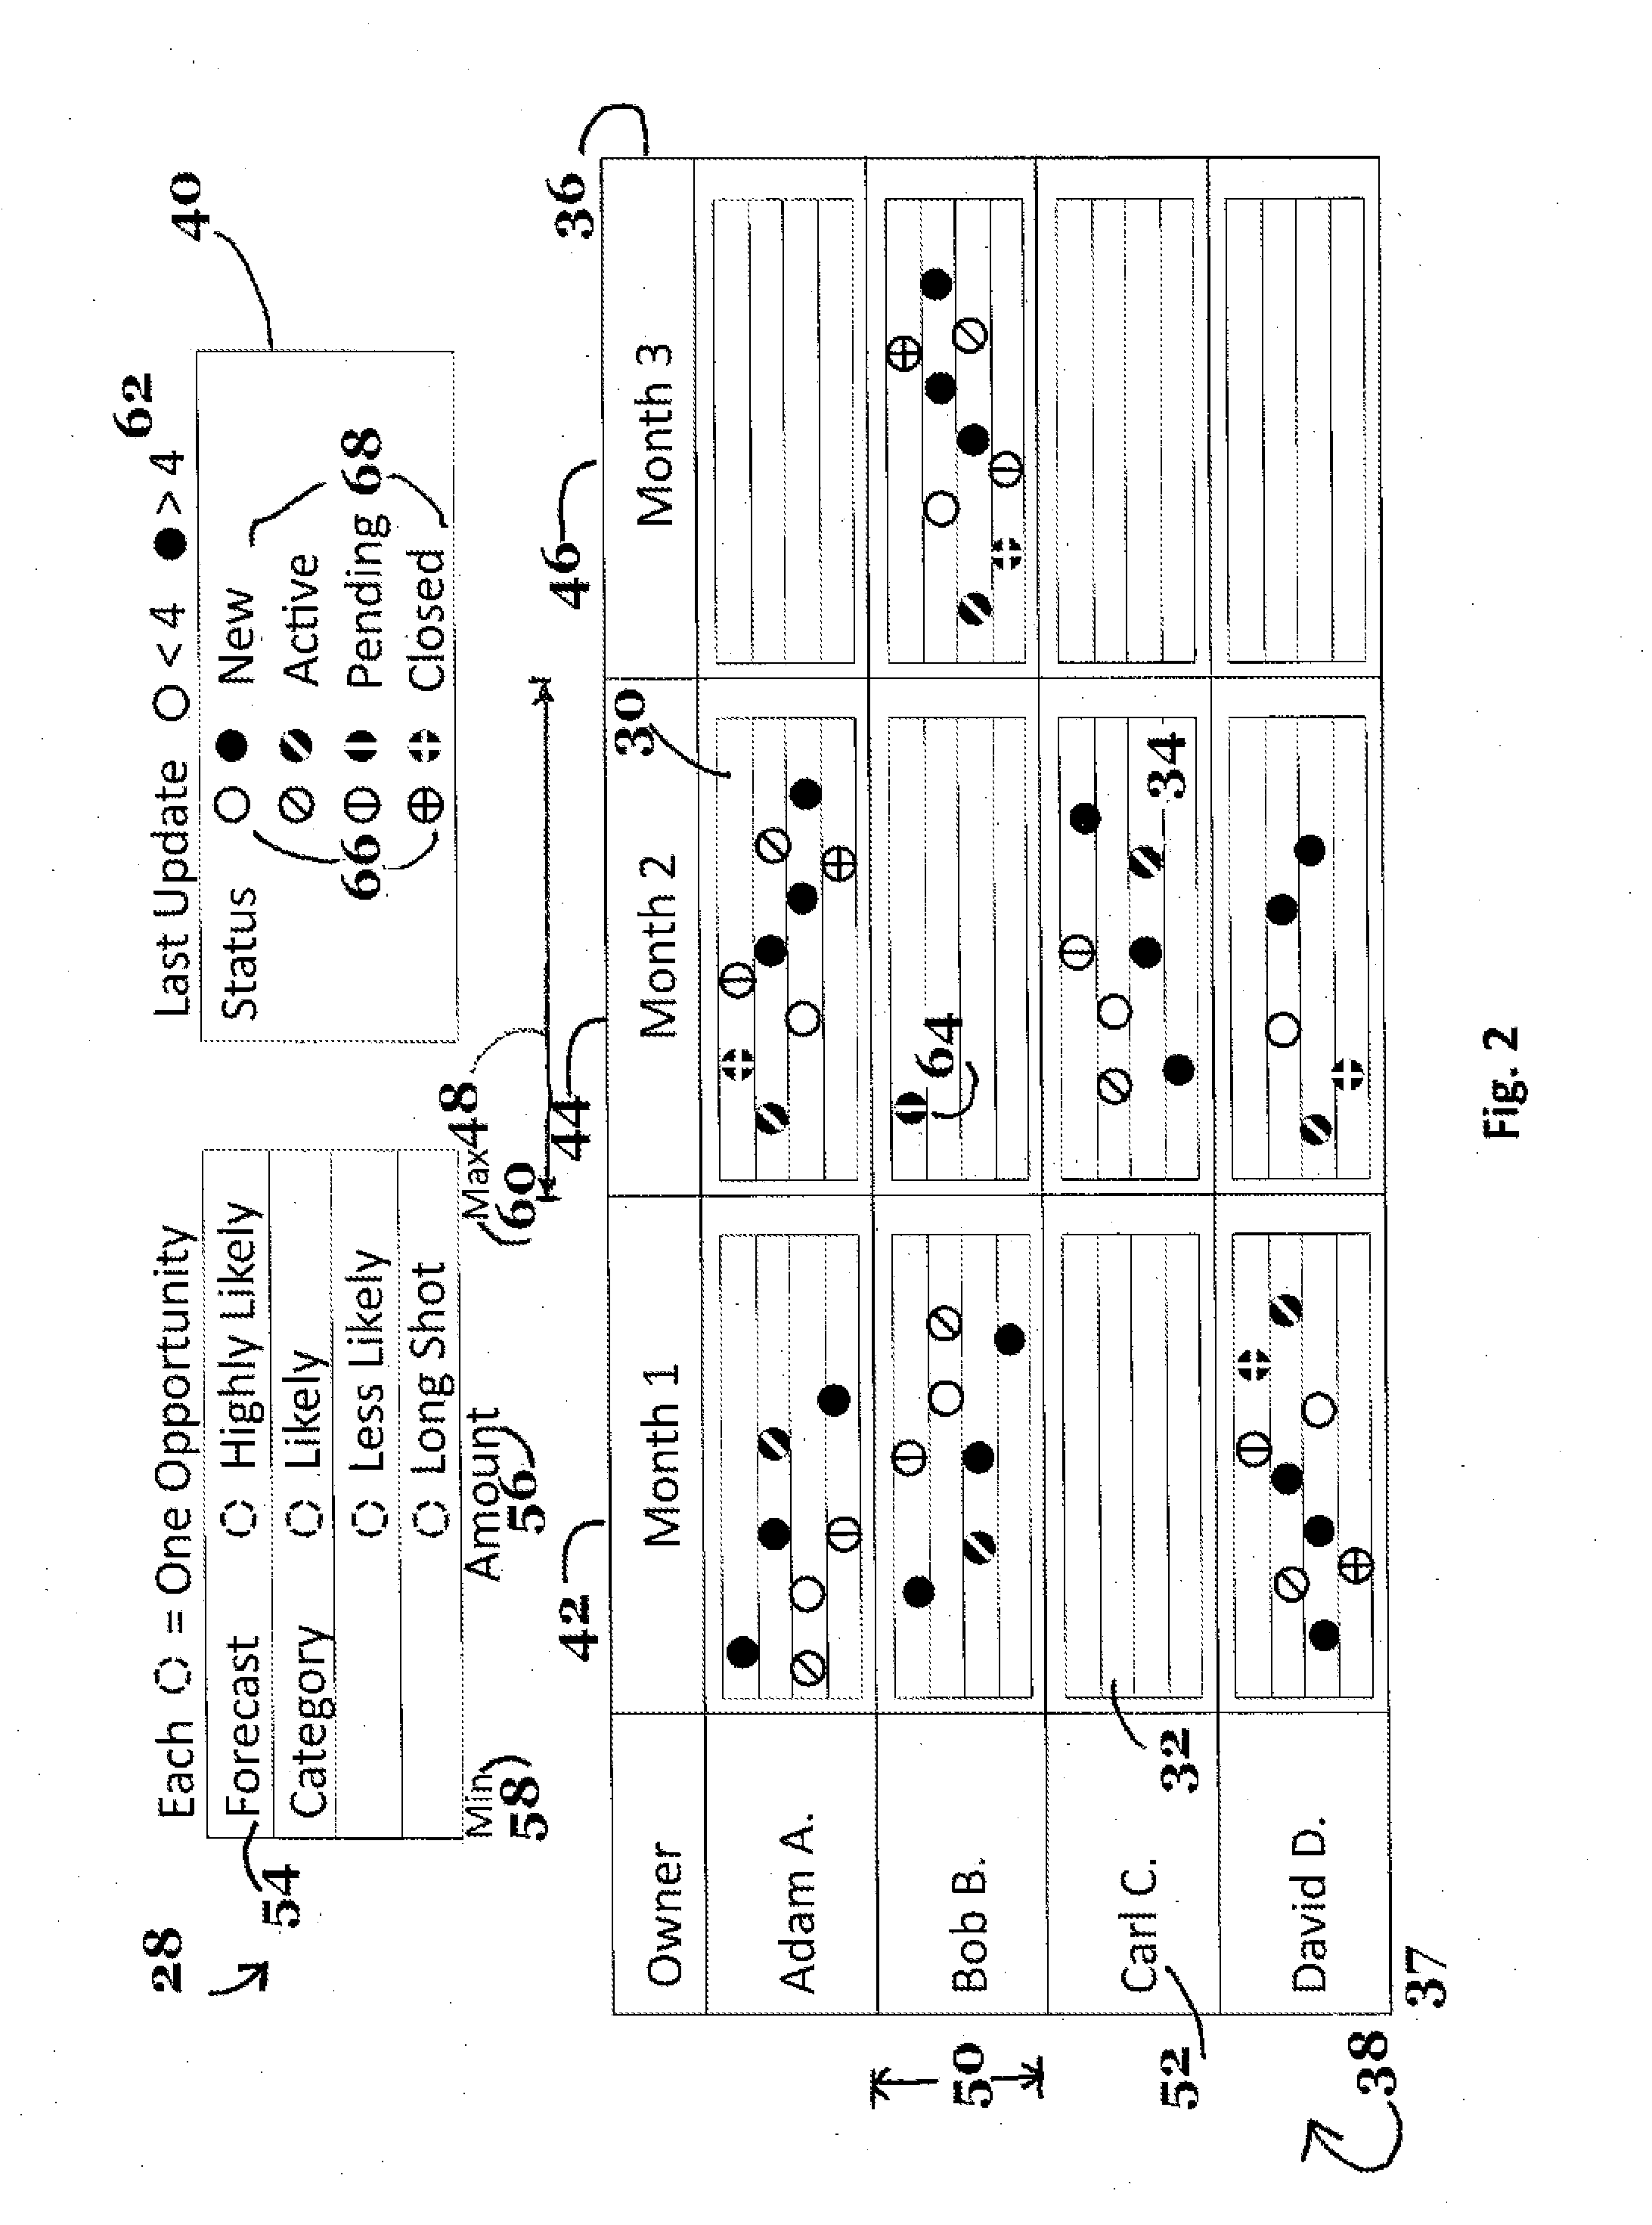
[0024]FIG. 1 illustrates an example of a system for visualizing data 10. The system 10 may include a visualization server 12 connected to a data source ...


PUM


Abstract

Provided is a method of preparing a data-visualization interface. The method may include receiving a request to view data; retrieving a display configuration responsive to the request to view data, the display configuration identifying two or more context dimensions and three or more sub-display dimensions; retrieving data responsive to the request to view data; designating, in visualization data, a portion of the data as visible data and a portion of the data as cache data based on the display configuration; assigning, in the visualization data, positioning data to a plurality of sub-displays based on the two or more context dimensions, the sub-displays displaying data markers; assigning, in the visualization data, a portion of the cache data to groups of the sub-displays that are co-linear based on the context dimensions; and transmitting the visualization data.

Description

CROSS-REFERENCE TO RELATED APPLICATIONS[0001]The present application claims the benefit of U.S. Provisional Application 61 / 461,682, filed Jan. 22, 2011.BACKGROUND OF THE INVENTION[0002]1. Field of the Invention[0003]The present invention relates generally to a system and tools for data visualization and, more specifically, to a system and tools for generating a data visualization interface.[0004]2. Description of the Related Art[0005]This section is intended to introduce the reader to various aspects of art that may be related to various aspects of the present invention, which are described and / or claimed below. This discussion is believed to be helpful in providing the reader with background information to facilitate a better understanding of the various aspects of the present invention. Accordingly, it should be understood that these statements are to be read in this light, and not as admissions of prior art.[0006]As businesses have become increasing reliant upon information techn...

Claims


Application Information

Patent Timeline
IPC IPC(8): G06F17/30
CPCG06F3/0484G06F17/30572G06F9/451G06F16/26G06F16/951G06F16/9535G06F16/9538G06F3/0482G06F3/0488G06F2203/04808G06T11/206G06T2200/24
Inventor JONES, ROBERT F.
Owner OPDOTS
Why Eureka
Try Eureka