Visual Analytics Law Enforcement Tools

a technology of visual analytics and law enforcement, applied in the field of visual analytics law enforcement tools, can solve the problems of unable to effectively analyze the data being collected by local law enforcement agencies, the ability of local law enforcement agencies to effectively analyze the data being collected becomes increasingly strained, and the raw data relating to law enforcement and public health and safety can be difficult to assess or pull together into a unified picture, let alone predict future needs

Inactive Publication Date: 2013-03-07
PURDUE RES FOUND INC
View PDF1 Cites 233 Cited by
  • Summary
  • Abstract
  • Description
  • Claims
  • Application Information

AI Technical Summary

Benefits of technology

[0010]The above-described features and advantages, as well as others, will become more readily apparent to th

Problems solved by technology

The exploration of criminal incident reports for detecting trends, discovering anomalies and evaluating resource usage is an ever expanding issue for law enforcement agencies.
It is no longer efficient for a single analyst to pull files, take notes, form hypotheses and request data from different sources.
Further, as budgets shrink and departments scale back, the ability of local law enforcement agencies to effectively analyze the data being collected becomes increasingly strained.
However, the raw d

Method used


Image

  • Visual Analytics Law Enforcement Tools
  • Visual Analytics Law Enforcement Tools
  • Visual Analytics Law Enforcement Tools

Examples


Embodiment Construction

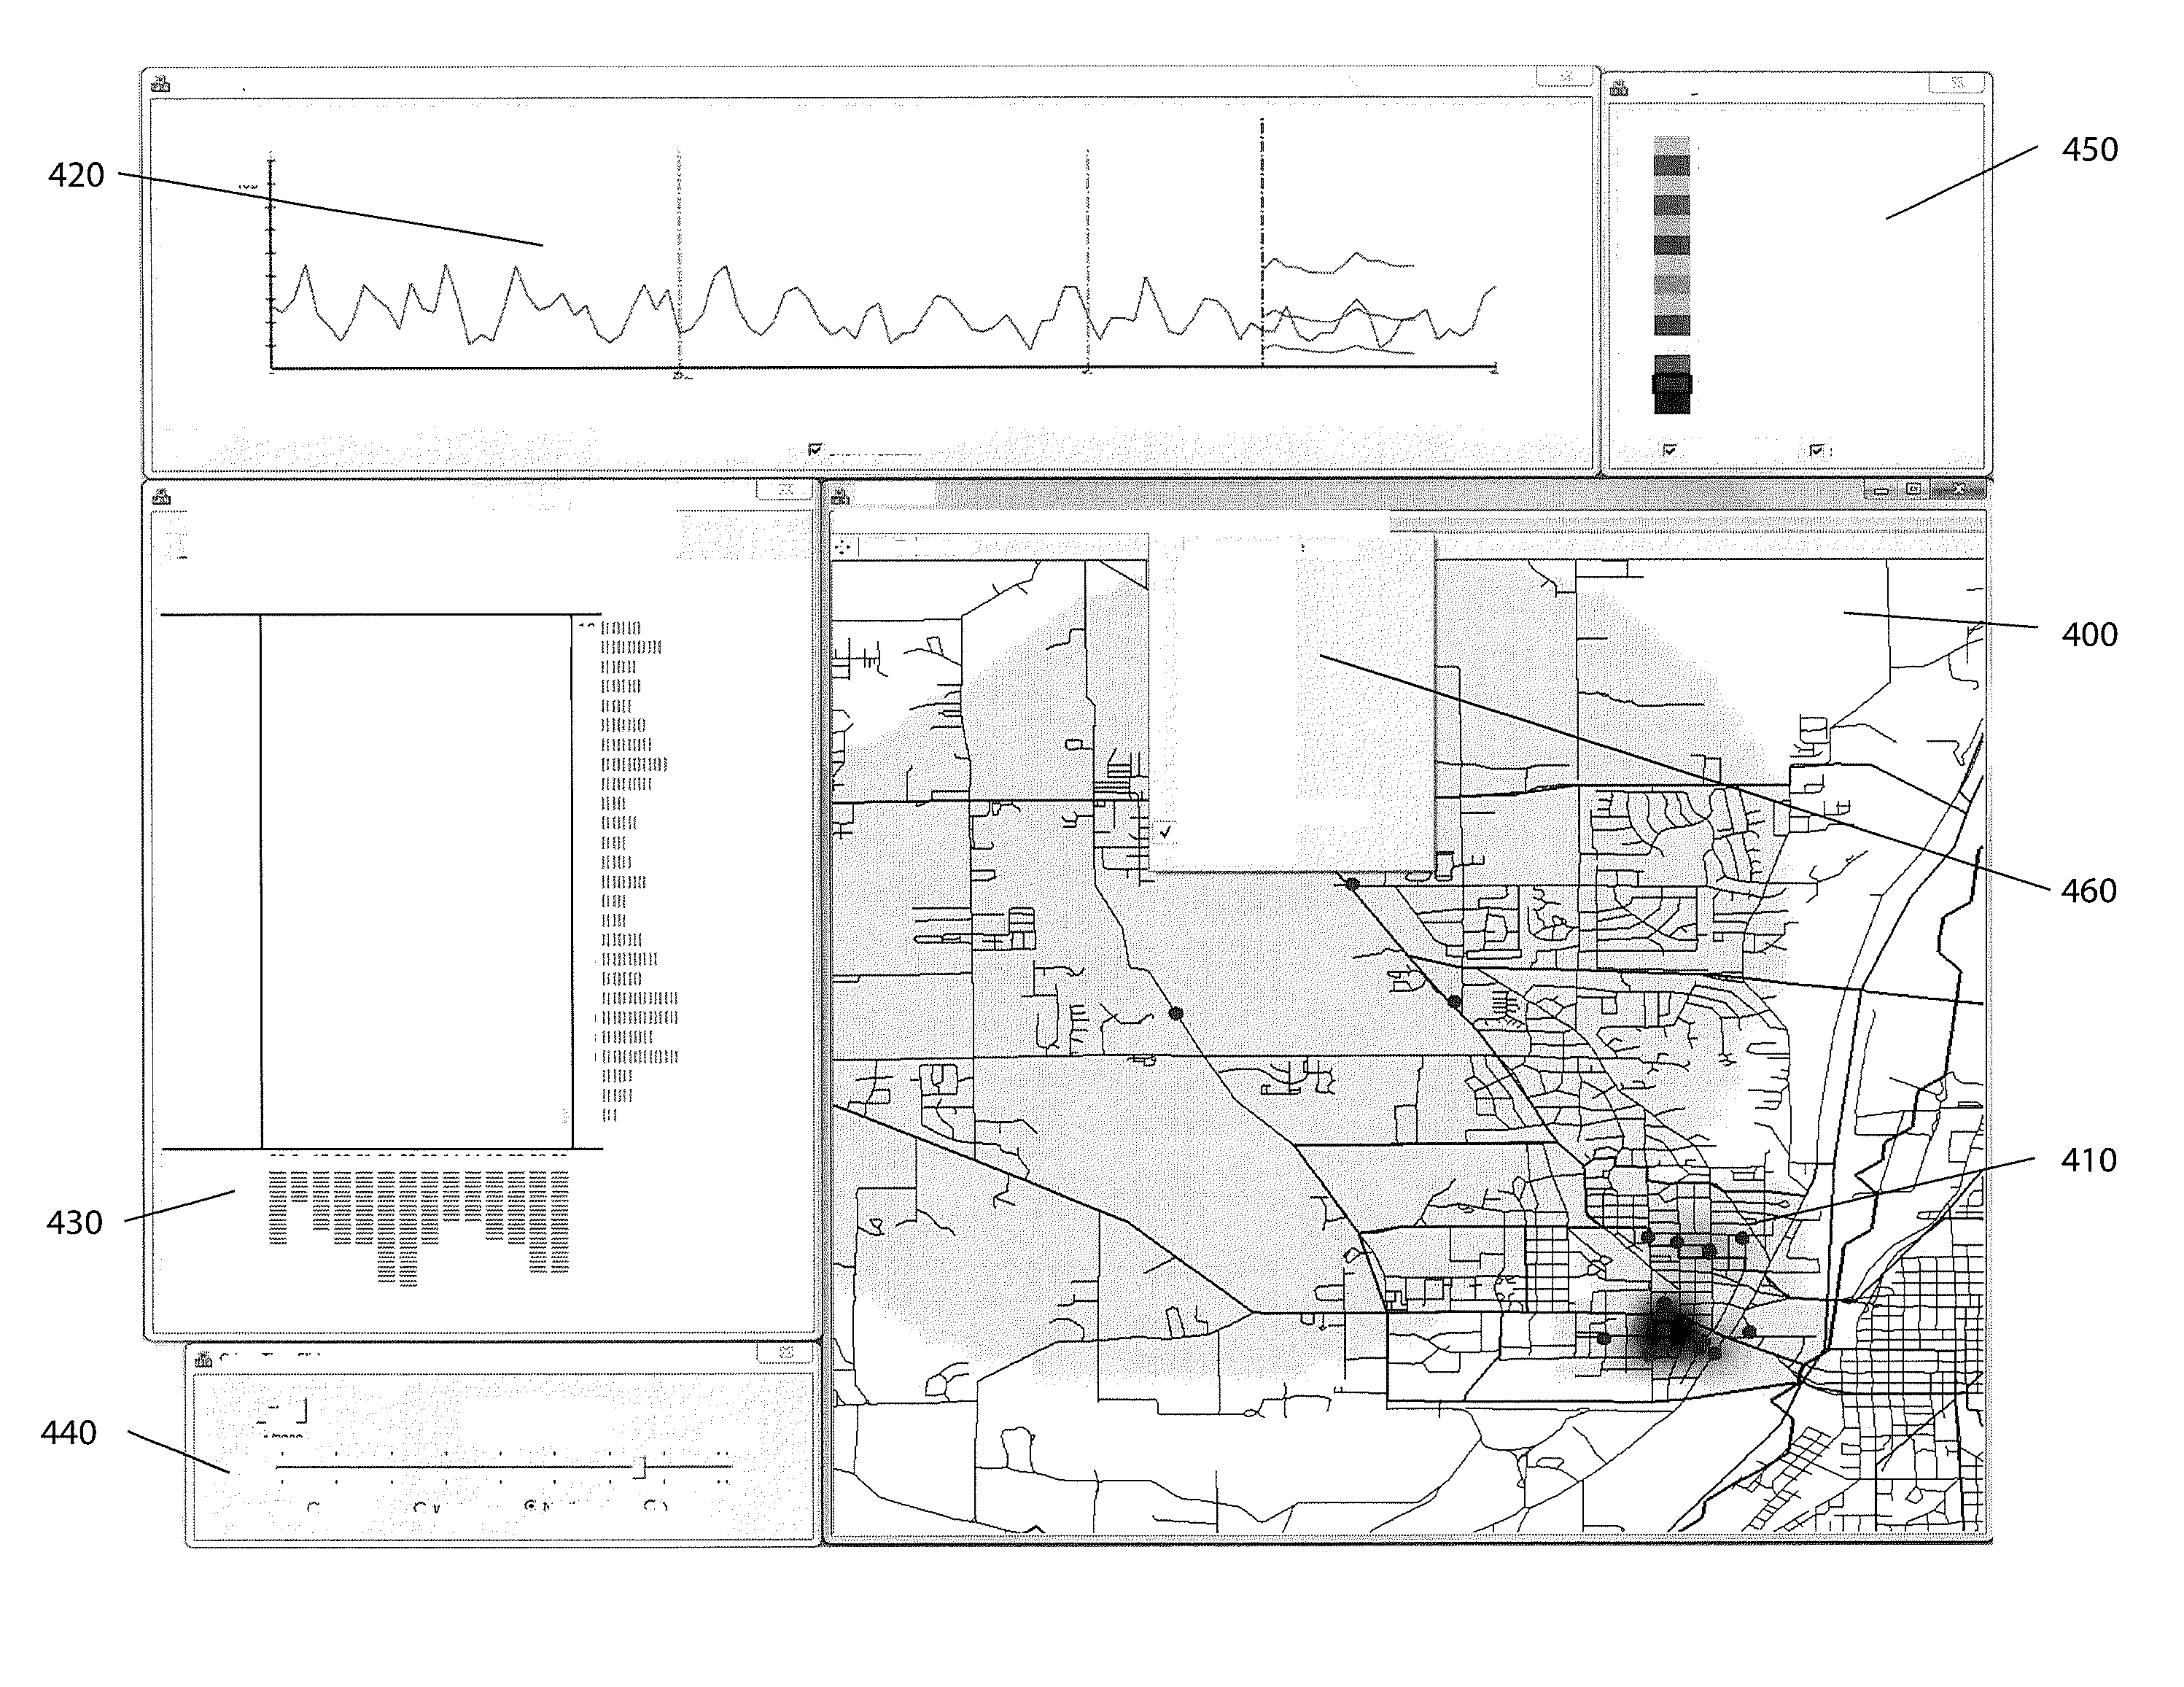
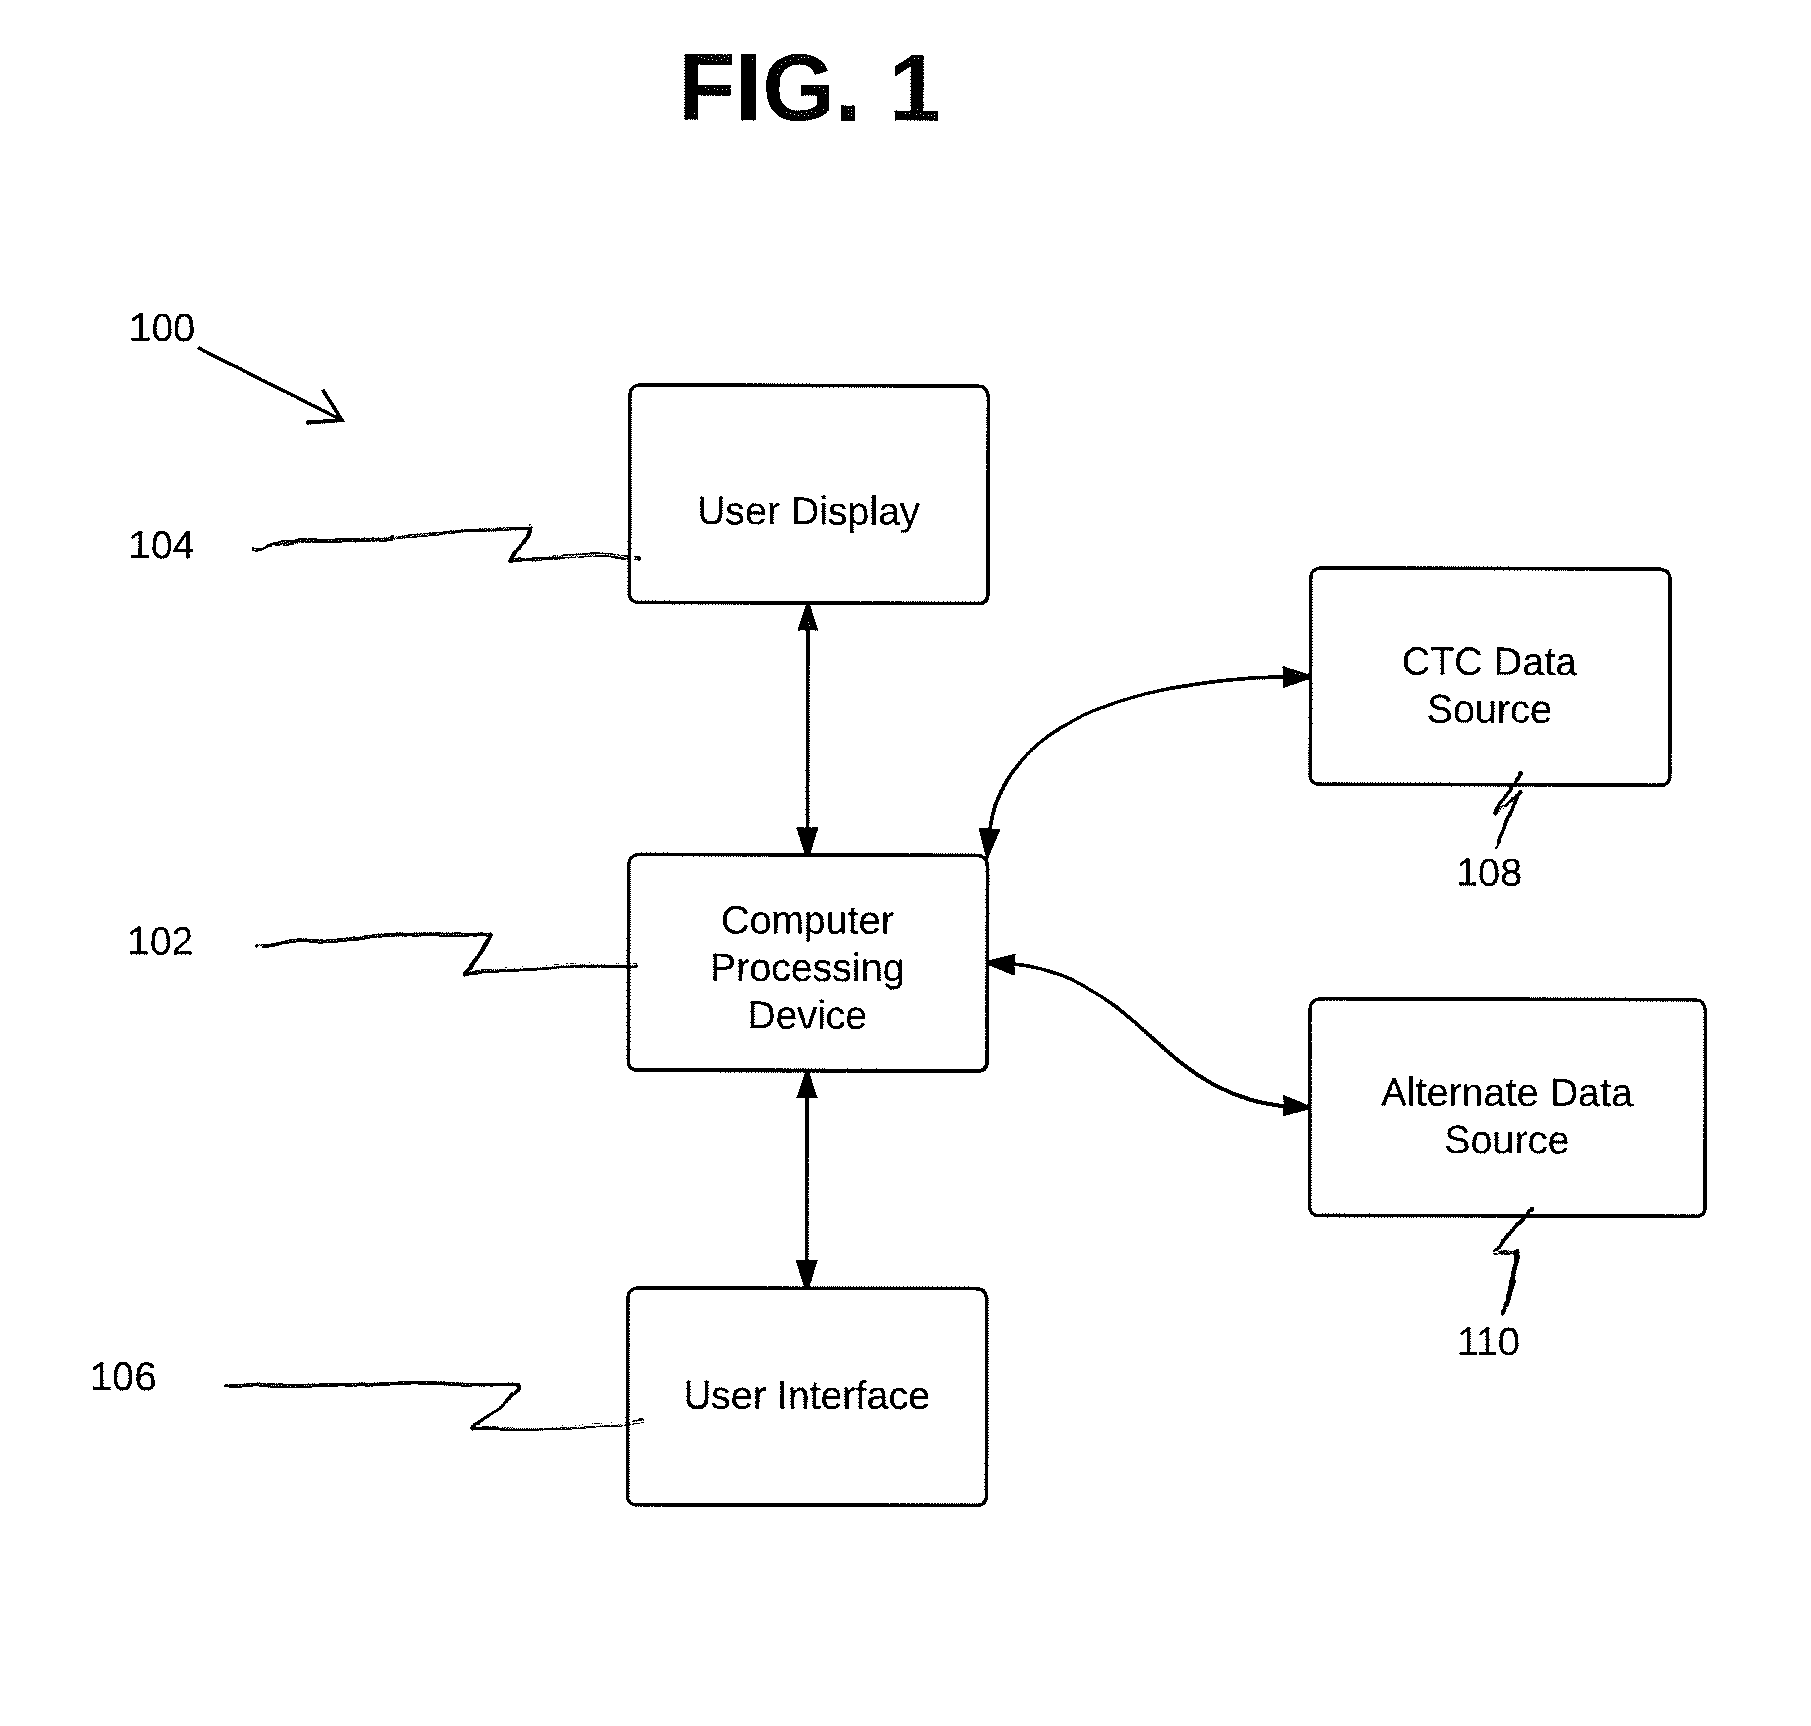
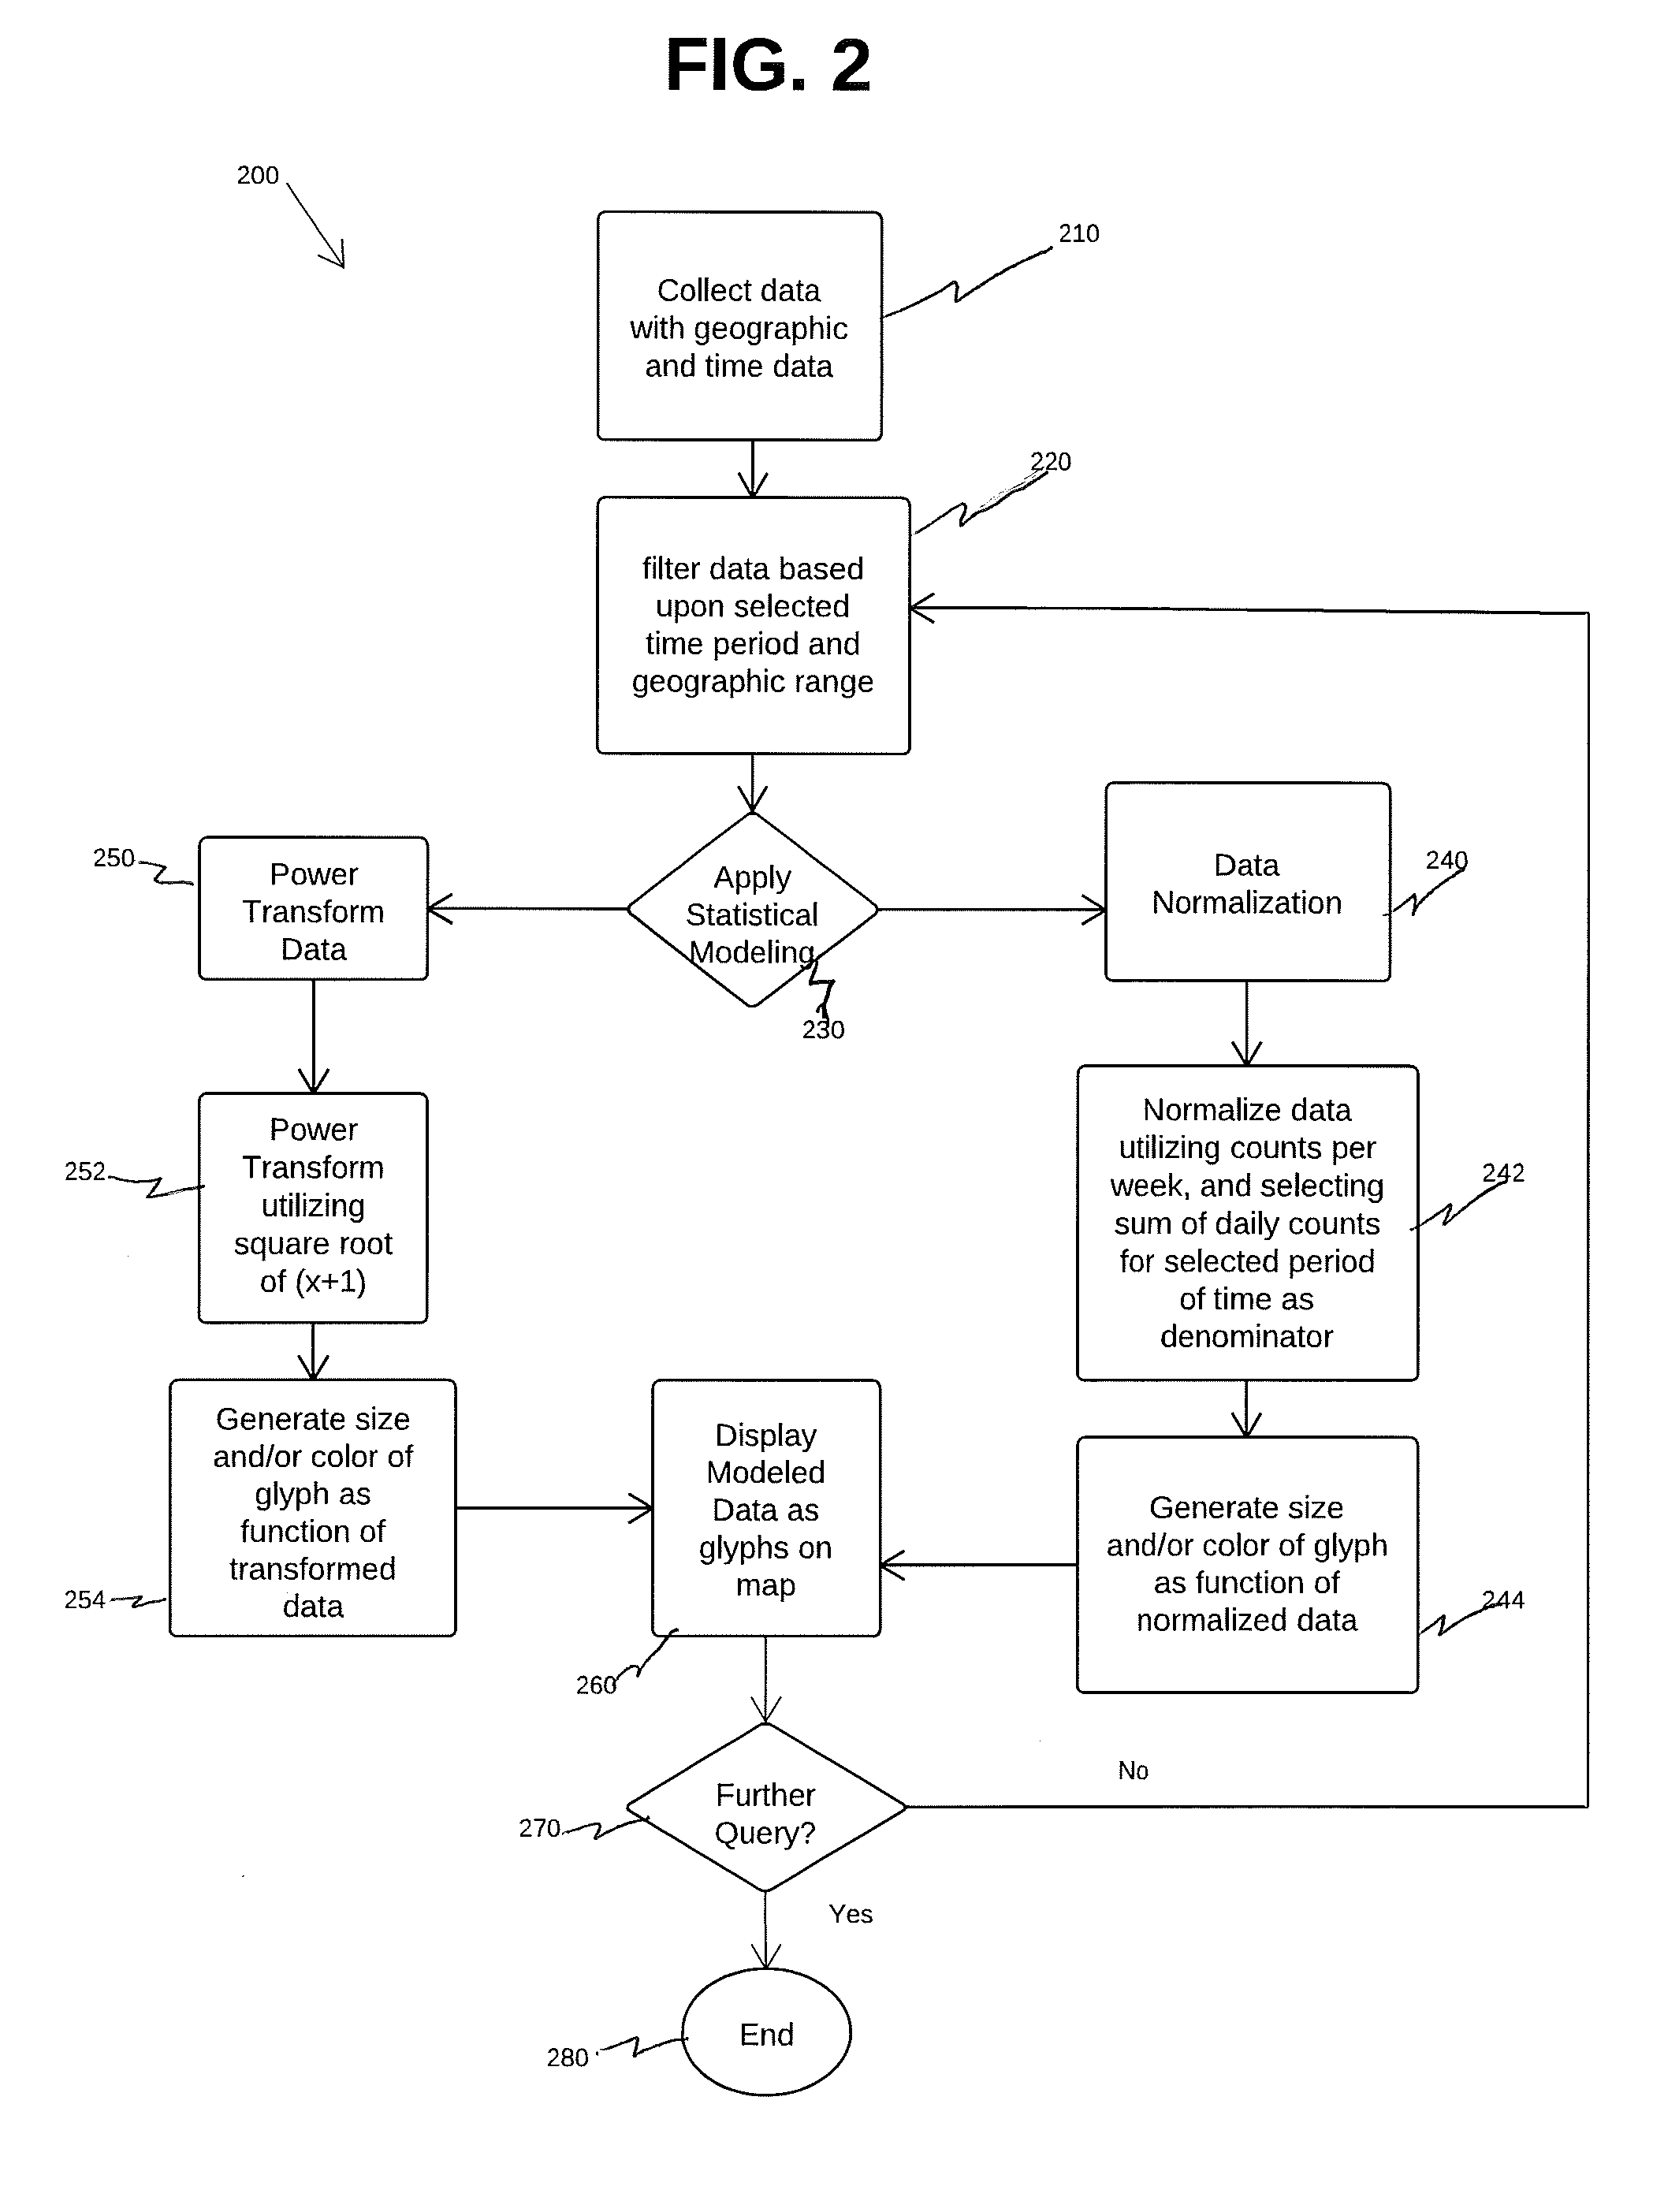
[0016]The present application relates to a system of analytical tools coupled with an interactive visual interface for data exploration and analysis, and a method for applying analytics to law enforcement and / or public safety data to aid in the prediction of potential trouble spots and / or times where public safety issues, criminal activity, or other potential events of concern to officials are likely to occur. According to at least one embodiment, the present system and method includes a visual analytics tool that includes linked views and interactive displays that spatiotemporally model criminal, traffic and / or civil (hereinafter, “CTC”) incidents that can be modeled and displayed in a way to allow officials to observe patterns and quickly identify regions with varying probabilities of CTC activity. According to certain aspects, the present system and method provides users with the ability to visualize different types of data sets, including census data, daily weather reports, zoni...


PUM


Abstract

A system and method for visually displaying and analyzing criminal and/or public health and safety data for geospatial and/or time variations, including the collection of incident data coupled with geographic and time data, filtering the symptom data based upon a selected time period and geographic range, and creating a visual result based upon statistical modeling including power transform and/or data normalization. According to at least one embodiment, the system for visually displaying and analyzing includes selecting and performing at least one aberration detection method and displaying the result to a user via a visual analytics arrangement.

Description

PRIORITY[0001]This application claims priority to of Provisional U.S. Patent Application Ser. No. 61 / 411,447, entitled “Visual Analytics Law Enforcement Toolkit”, filed Nov. 8, 2010, as well as U.S. patent application Ser. No. 13 / 190,748 to Ebert et al., entitled “Linked Animal-Human Health Visual Analytics”, filed Jul. 26, 2011, which is a continuation-in-part of U.S. patent application Ser. No. 12 / 286,756 to Ebert et al. and entitled “Linked Animal-Human Health Visual Analytics, filed Oct. 1, 2008, now abandoned, which claimed the benefit of U.S. Provisional Patent Application Ser. No. 60 / 997,150, filed Oct. 1, 2007, each of which are incorporated herein by reference.[0002]This invention was made with Government support under 2009-ST-061-CI0001 / 103659 awarded by DHS. The Government has certain rights in the invention.FIELD OF THE INVENTION[0003]The present invention relates generally to visual analytic tools, and more particularly, to visual analytic tools used in the field of pub...

Claims


Application Information

Patent Timeline
IPC IPC(8): G06T11/20
CPCG06K9/6218G06F19/3493G16H50/80G06F18/23
Inventor EBERT, DAVID S.COLLINS, TIMOTHYMACIEJEWSKI, ROSSMALIK, ABISH
Owner PURDUE RES FOUND INC
Why Eureka
Try Eureka