Method and apparatus for identifying and classifying query intent
- Summary
- Abstract
- Description
- Claims
- Application Information
AI Technical Summary
Benefits of technology
Problems solved by technology
Method used
Image
Examples
Embodiment Construction
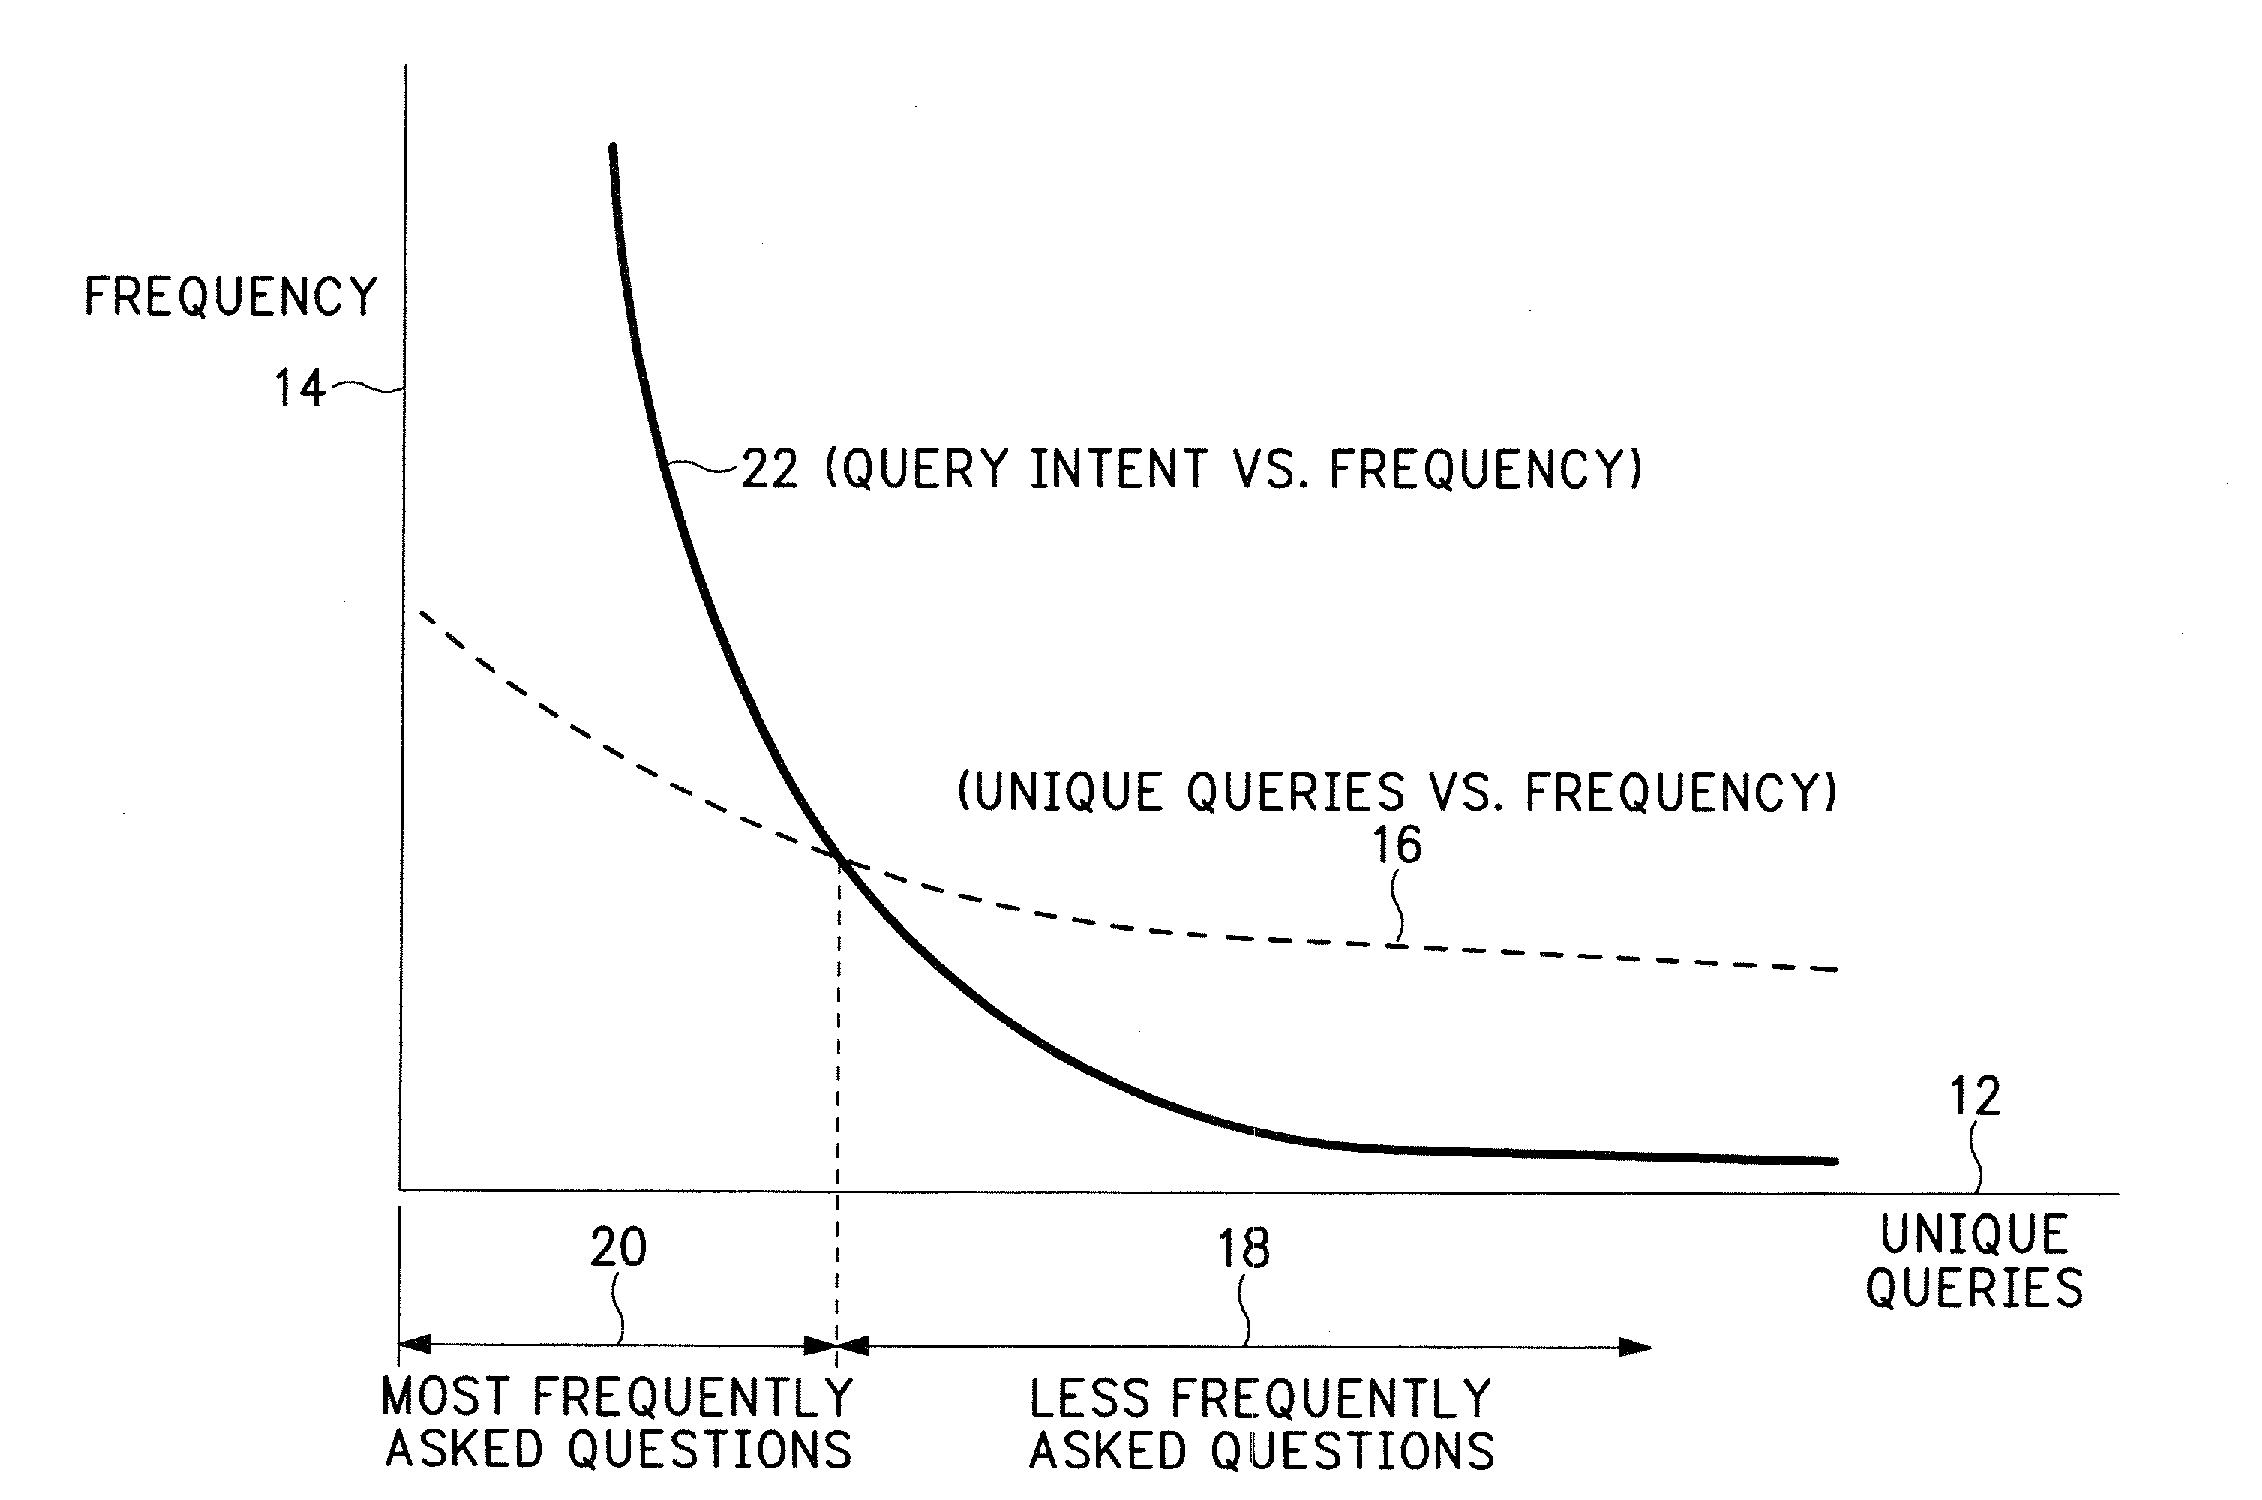
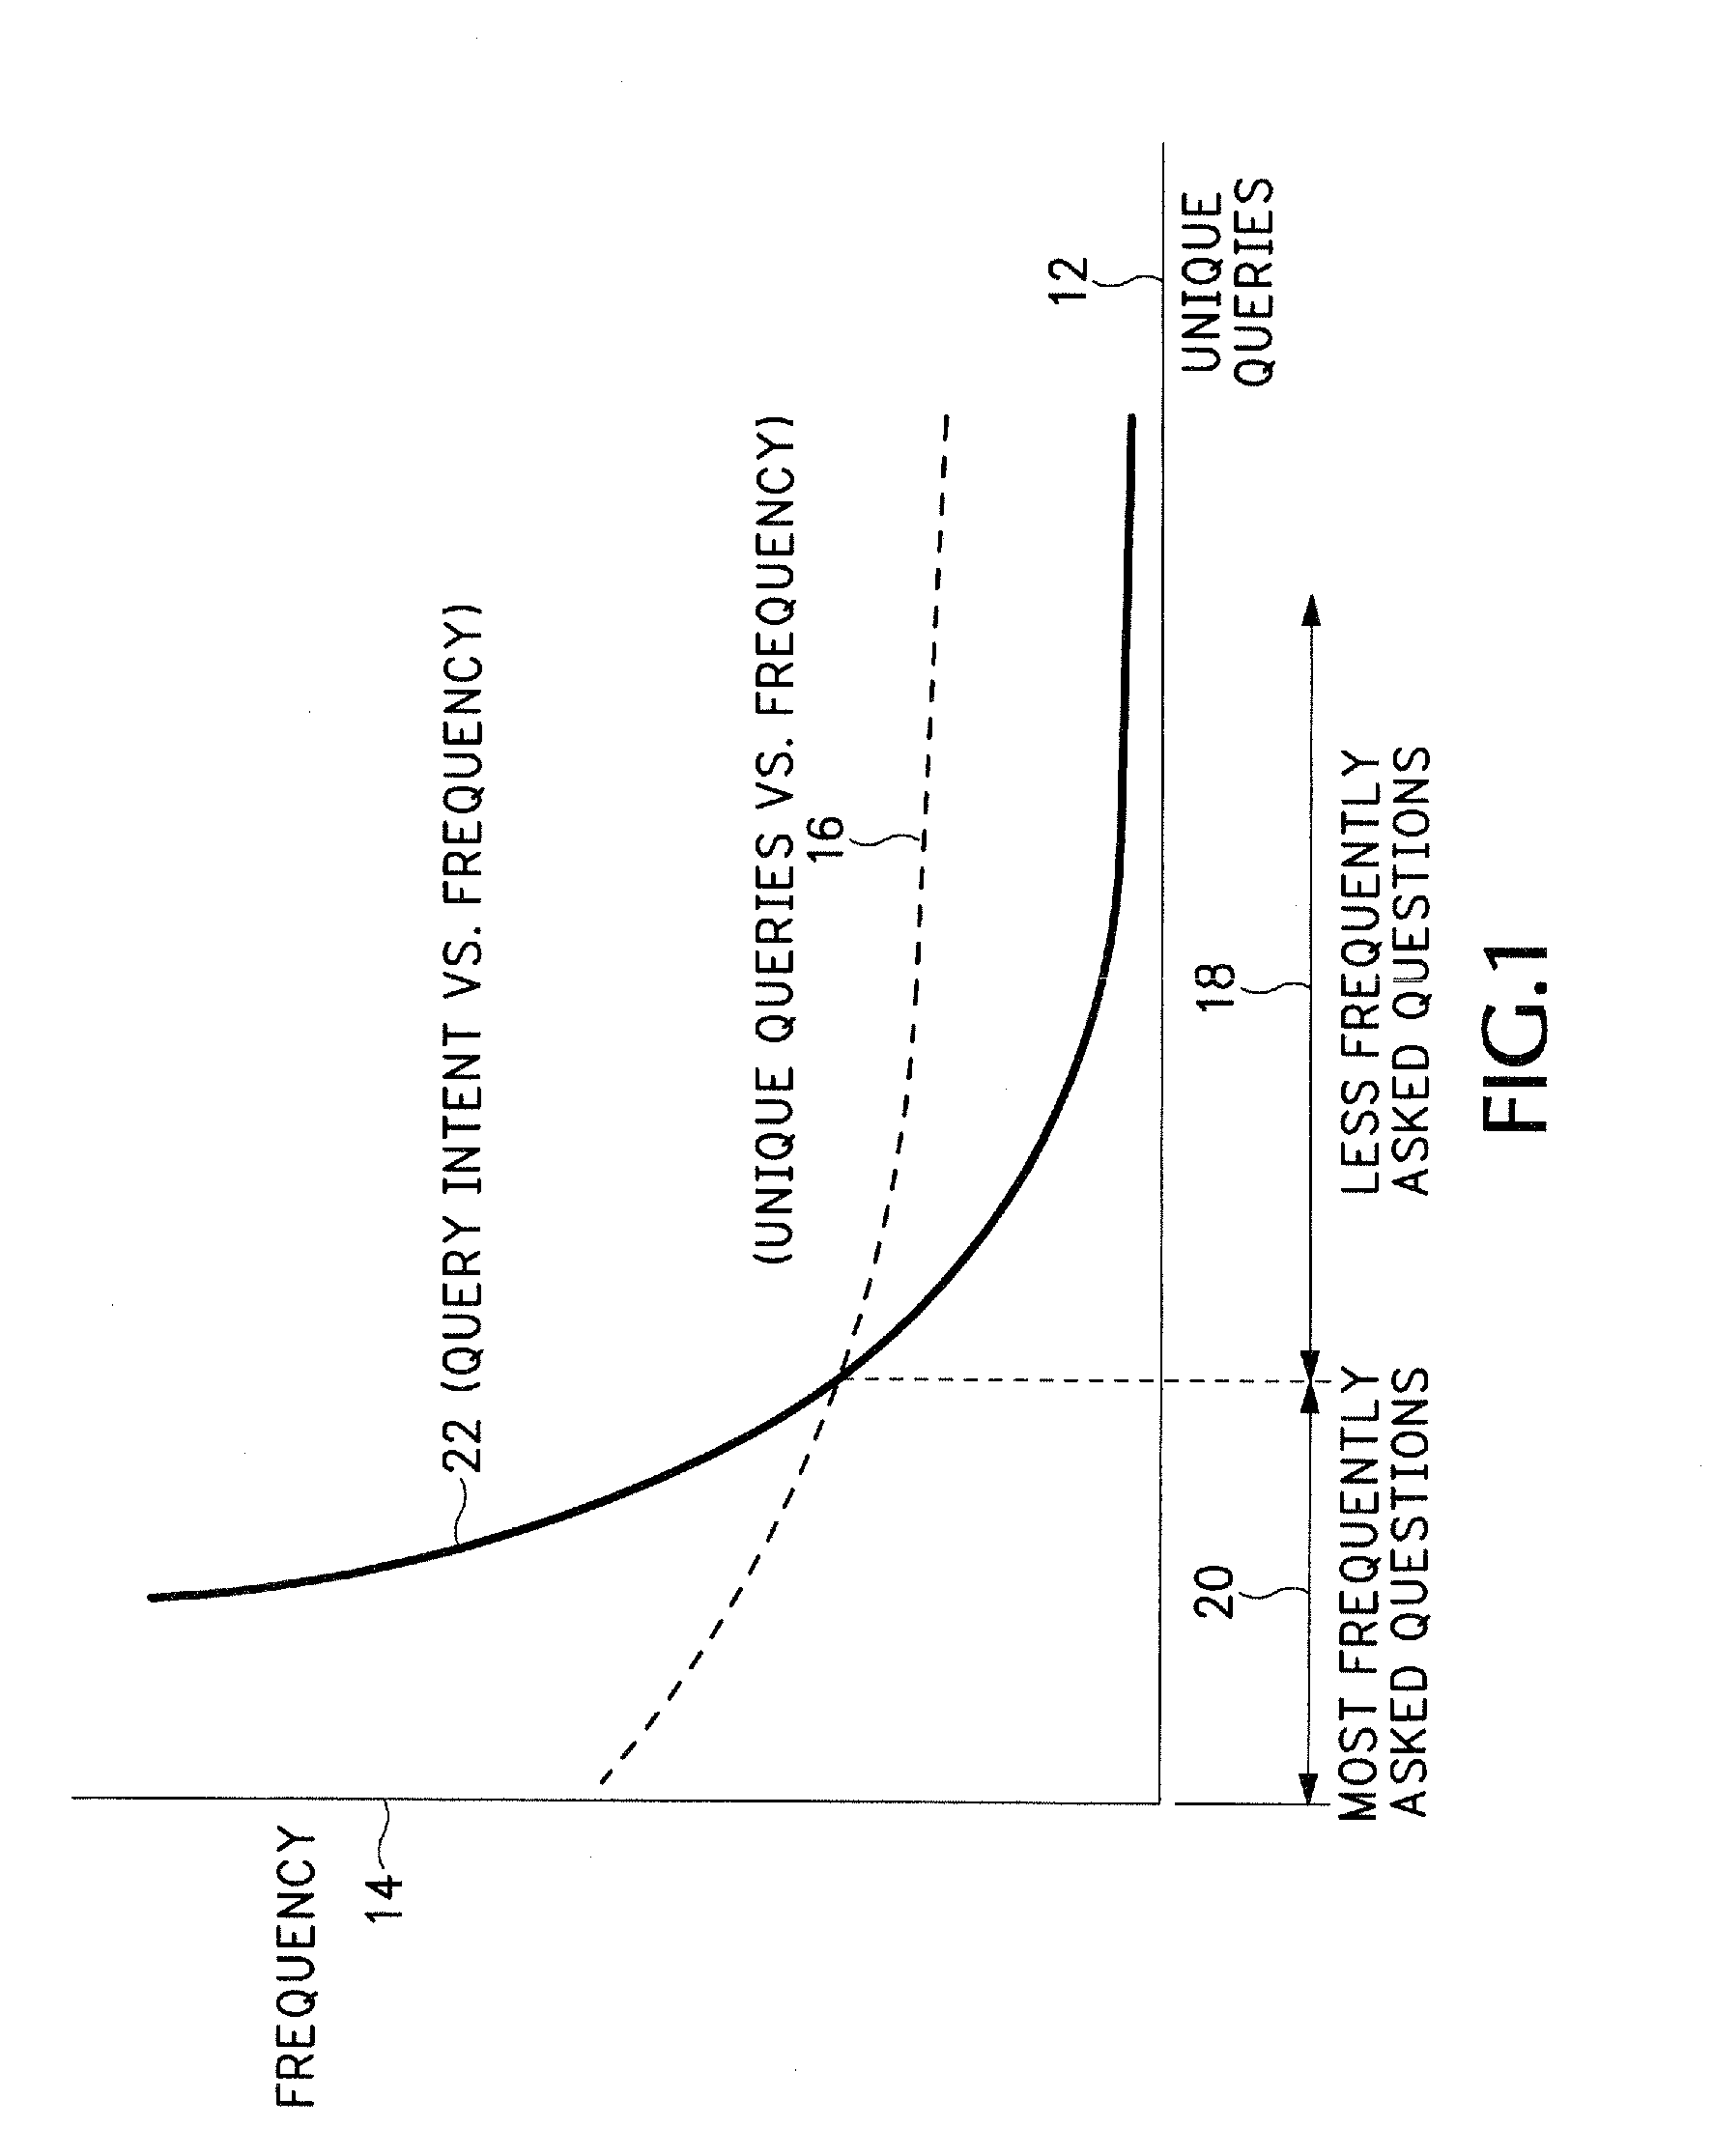
[0025]FIG. 1 is a graph showing the relationship between unique search queries and the frequency they are received by a particular enterprise. The enterprise could be any type of business or institution, such as a car dealer, financial service, telecommunications company, etc. that has a search engine that attempts to provide responses to questions submitted by users via computer terminals. The horizontal axis 12 refers to the different unique queries that may be received by one or more search engines operated by the enterprise. The vertical axis 14 refers to the frequency of the different unique queries.
[0026]A challenge exists trying to algorithmically decipher the meaning of received queries and then provide responses associated with the identified query meaning. For example, the shape of curve 16 indicates that a first portion 20 of the unique queries occur with the most frequency and a second portion 18 of the queries occur with slightly less frequency. As can be seen, a large ...
PUM
 Abstract
Description
Claims
Application Information
 - R&D
- Intellectual Property
- Life Sciences
- Materials
- Tech Scout
- Unparalleled Data Quality
- Higher Quality Content
- 60% Fewer Hallucinations
Browse by: Latest US Patents, China's latest patents, Technical Efficacy Thesaurus, Application Domain, Technology Topic, Popular Technical Reports.
© 2025 PatSnap. All rights reserved.Legal|Privacy policy|Modern Slavery Act Transparency Statement|Sitemap|About US| Contact US: help@patsnap.com


