Automated stratification of graph display

a graph display and automatic technology, applied in the field of graph representation, can solve the problems of not directly considering the information stored about the objects themselves, and not necessarily reflecting the nature of the objects represented by nodes,

Active Publication Date: 2013-09-12
JACKSON JR ROBERT LEWIS
View PDF15 Cites 28 Cited by
  • Summary
  • Abstract
  • Description
  • Claims
  • Application Information

AI Technical Summary

Problems solved by technology

However, these properties do not necessarily reflect the nature of the objects represented by nodes directly.
A user might specify positioning requirements, or labels or text based upon any number of such properties, and might further specify them programmatically; however, the algorithm for placing the nodes within a drawing does not directly consider information stored about the objects themselves.

Method used


Image

  • Automated stratification of graph display
  • Automated stratification of graph display
  • Automated stratification of graph display

Examples


Embodiment Construction

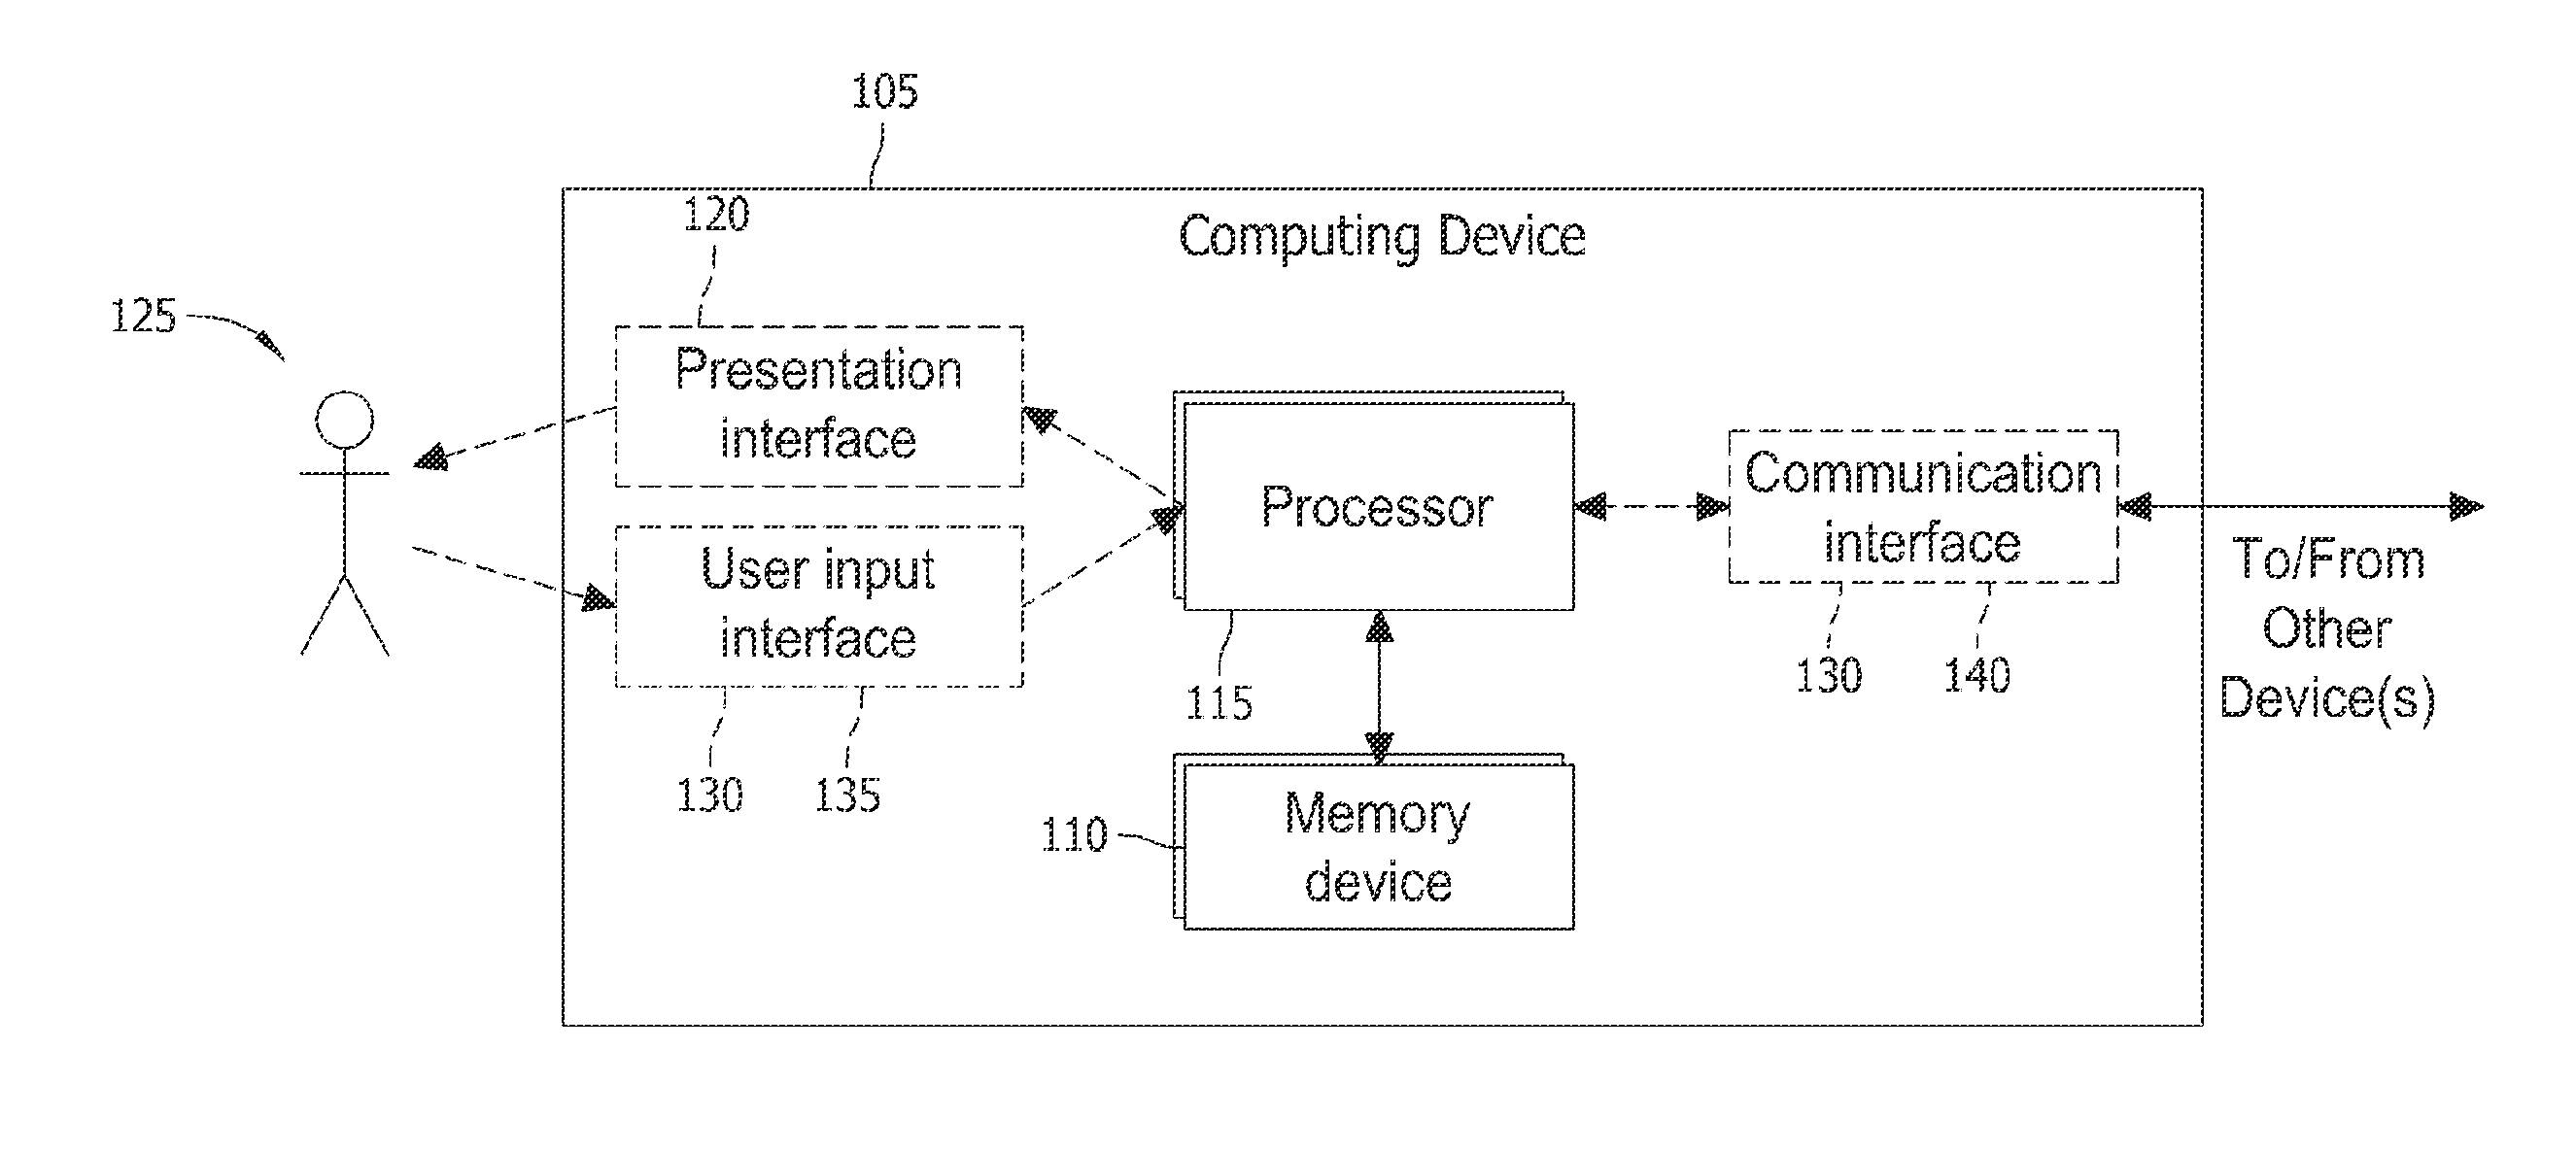
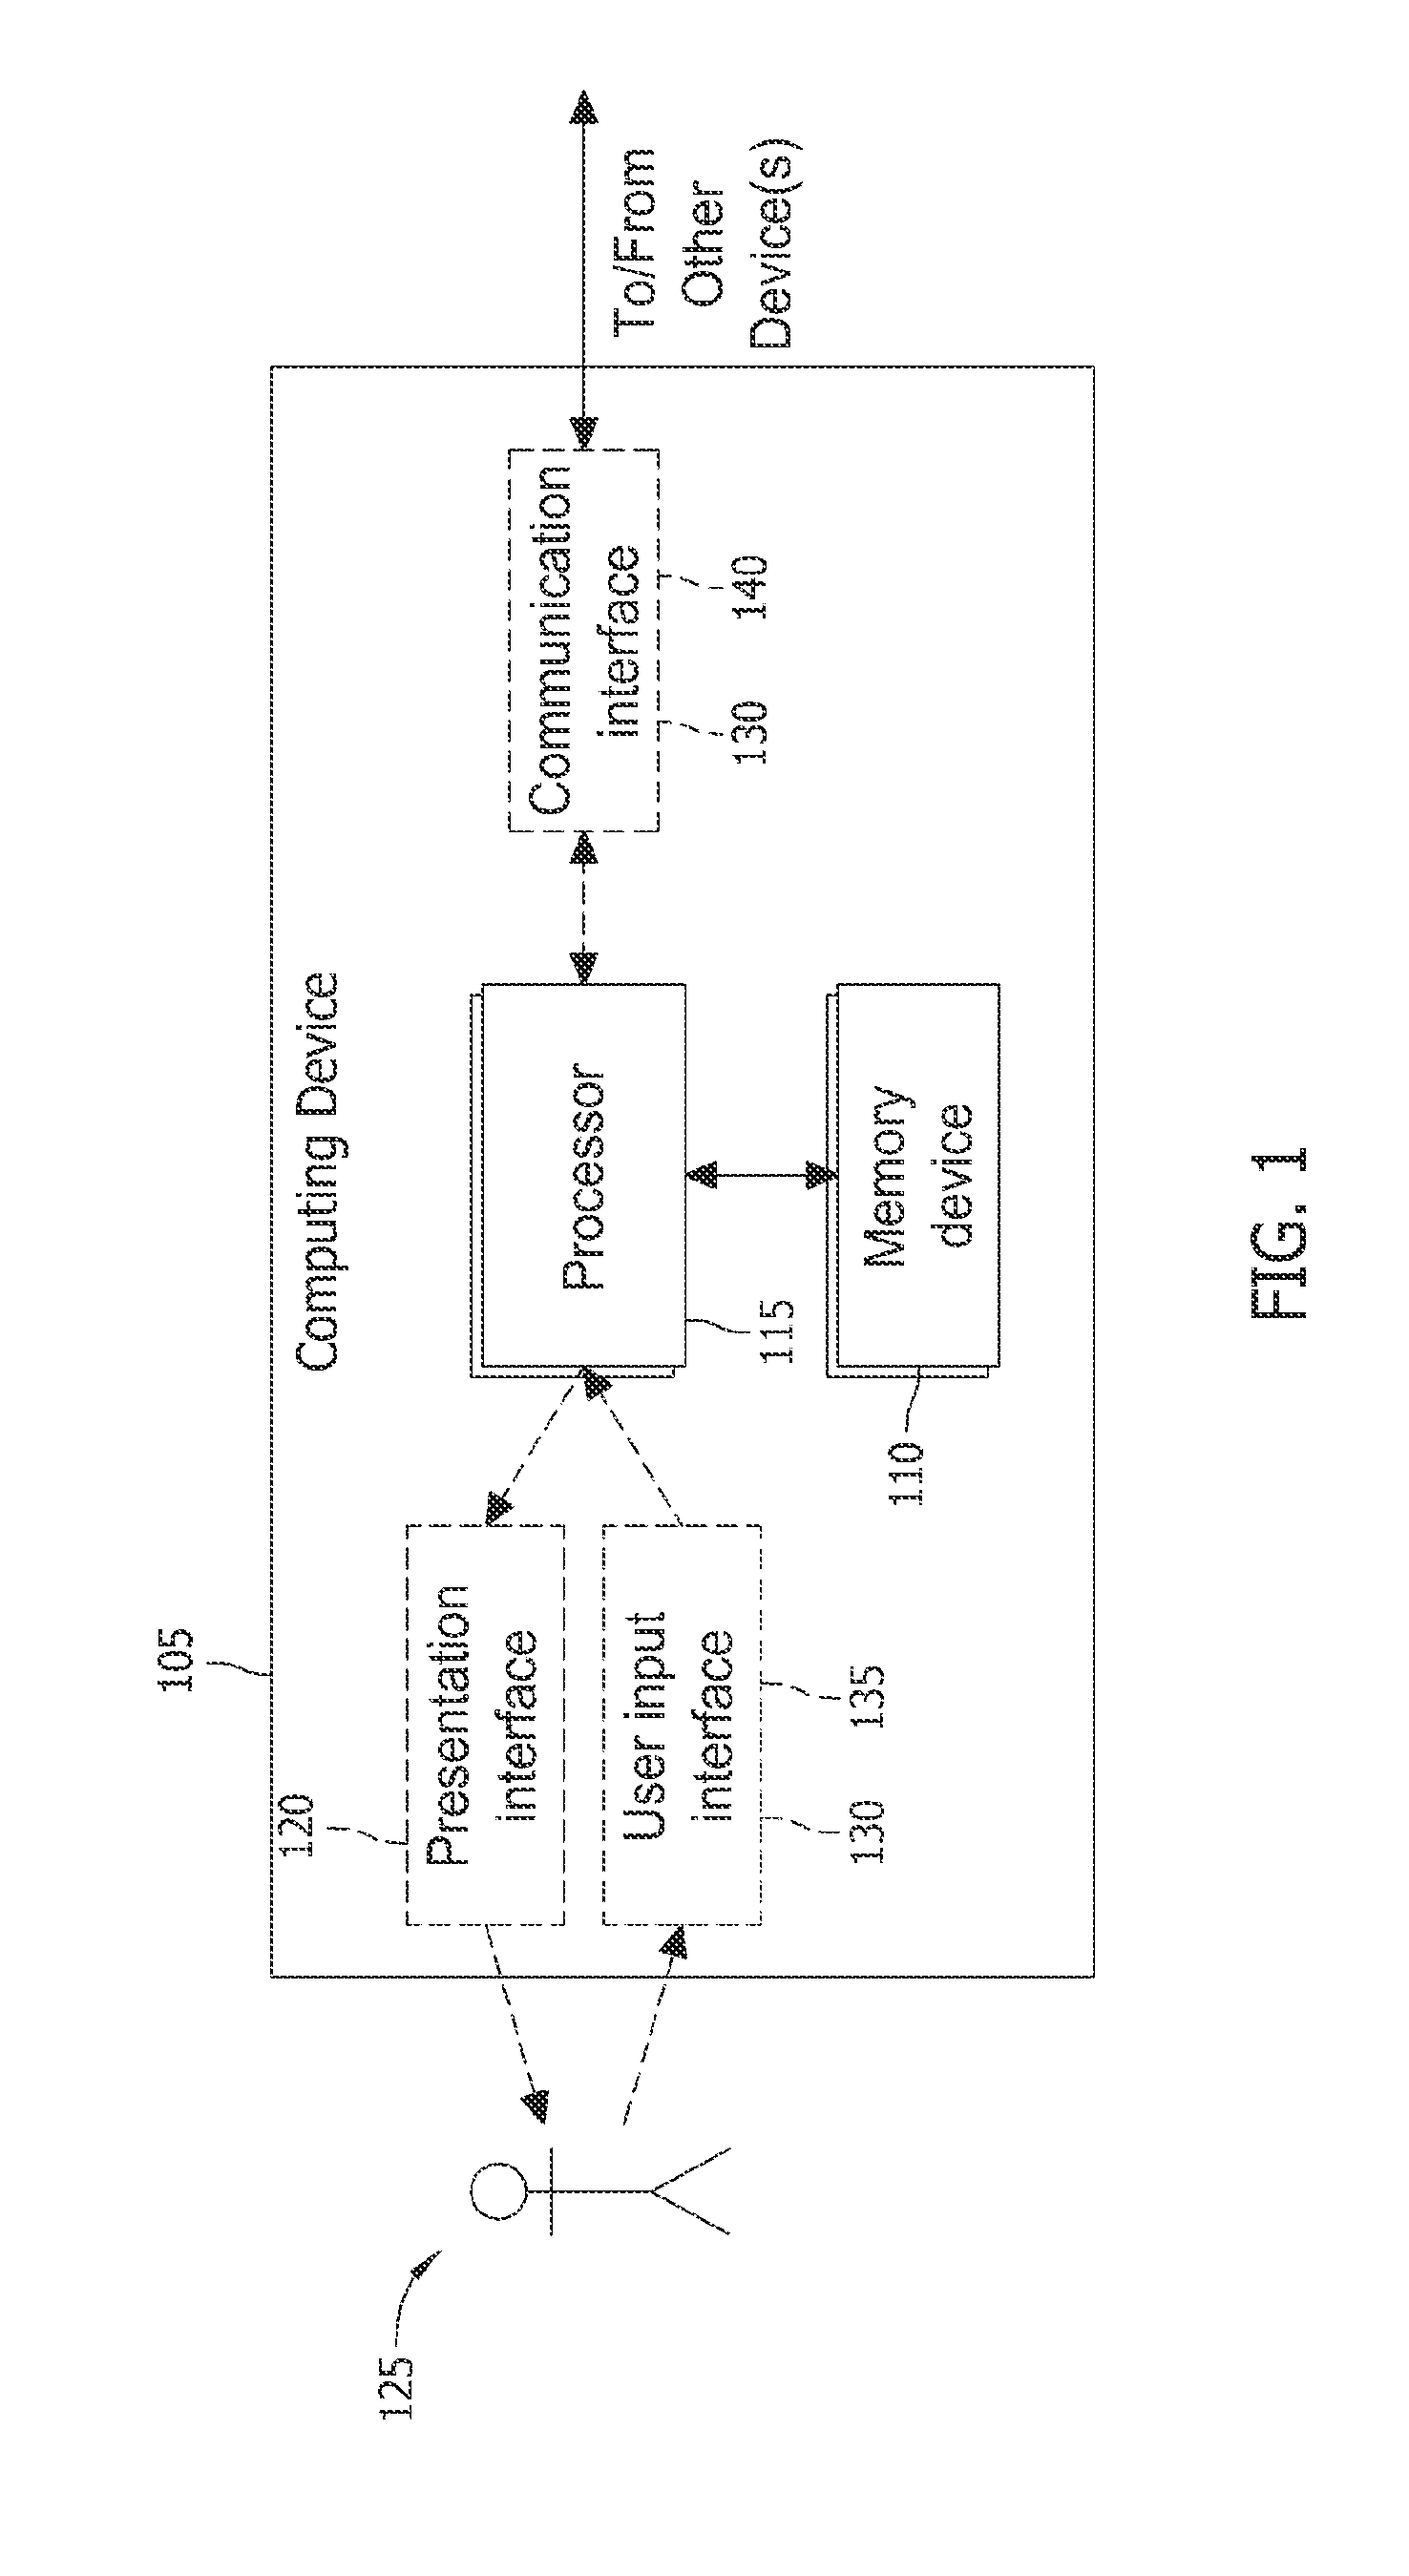
[0024]The past few decades have seen a movement towards graphical user interfaces and visualized presentation of data. One challenge of a graphical user interface is the balancing act of on the one hand taking advantage of the ability to present a lot of graphical information while on the other hand not overwhelming the user. In particular, these two mutual goals are relevant for presenting a graph, meaning a set of nodes with a set of edges between them. Graph nodes are able to present any type of objects, and graph edges can represent relationships between the objects. Graphs are therefore relevant to a vast number of applications, and user interfaces benefit tremendously from effective presentation of graphs. For example, a file directory system can be presented as a graph wherein nodes represent files and / or directories, and wherein directed edges represent a logical file location within a directory.

[0025]An exemplary technical effect of the methods, systems, and apparatus descr...


PUM


Abstract

A method and apparatus for generating a graphical depiction of related data are provided. Non-transitory computer-readable media having computer-executable instructions embodied thereon, wherein when executed by at least one processor, the computer-executable instructions cause the processor to identify a graph wherein a node represents a stored object having one or more application-specific attributes associated with a primary application, wherein the primary application includes other than a presentation of nodes in a graph drawing, and wherein edges represent stored relationships between said objects, which include a relevancy to the primary application. The computer-executable instructions further cause the processor to receive a selection formula wherein the selection formula is based on the one or more application-specific attributes of the objects, and wherein the formula classifies the objects based on at least one of predetermined and selectable values of the attributes; and depict a visual representation of the graph.

Description

CROSS REFERENCE TO RELATED APPLICATIONS[0001]This application claims the benefit of U.S. Provisional Application No. 61 / 380,060, filed Sep. 3, 2010, and U.S. Non-Provisional patent application Ser. No. 13 / 226,270 filed Sep. 6, 2011, the contents of which are hereby incorporated by reference in their entirety.BACKGROUND OF THE INVENTION[0002]The subject matter disclosed herein relates generally to graph representation and, more specifically, to node positioning within stratified graph representations based upon attributes of represented objects.[0003]At least some known graph drawing tools are designed to implement graph drawing algorithms that can either import or receive from a user interactively sets of properties for nodes that are relevant to their display in a visual representation of the graph. For example, a label or text for a node may be imported or specified by a user interactively, and the size of a name might influence the size of one or more of the nodes. As another exa...

Claims


Application Information

Patent Timeline
Patent Type & Authority Applications(United States)
IPC IPC(8): G06T11/20
CPCG06T11/206G06F16/285G06F16/9024
Inventor JACKSON, JR., ROBERT LEWIS
Owner JACKSON JR ROBERT LEWIS
Why Eureka
Try Eureka