Supercharge Your Innovation With Domain-Expert AI Agents!

Method, software and graphical user interface for forming a prediction model for chemometric analysis

a graphical user interface and prediction model technology, applied in the field of methods and graphical user interfaces for forming a prediction model for chemometric analysis, can solve problems such as lack of relevan

Inactive Publication Date: 2015-03-26
FOSS ANALYTICAL AB (SE)
View PDF5 Cites 2 Cited by
  • Summary
  • Abstract
  • Description
  • Claims
  • Application Information

AI Technical Summary

Benefits of technology

The technical effect of this patent is to provide a method for creating a prediction model for chemometric analysis that offers more flexibility and ease of use. The software to implement this method is also designed to be simple and intuitive.

Problems solved by technology

However, this has no relevance for the module, only for the overall model construction.

Method used


Image

  • Method, software and graphical user interface for forming a prediction model for chemometric analysis
  • Method, software and graphical user interface for forming a prediction model for chemometric analysis
  • Method, software and graphical user interface for forming a prediction model for chemometric analysis

Examples


Embodiment Construction

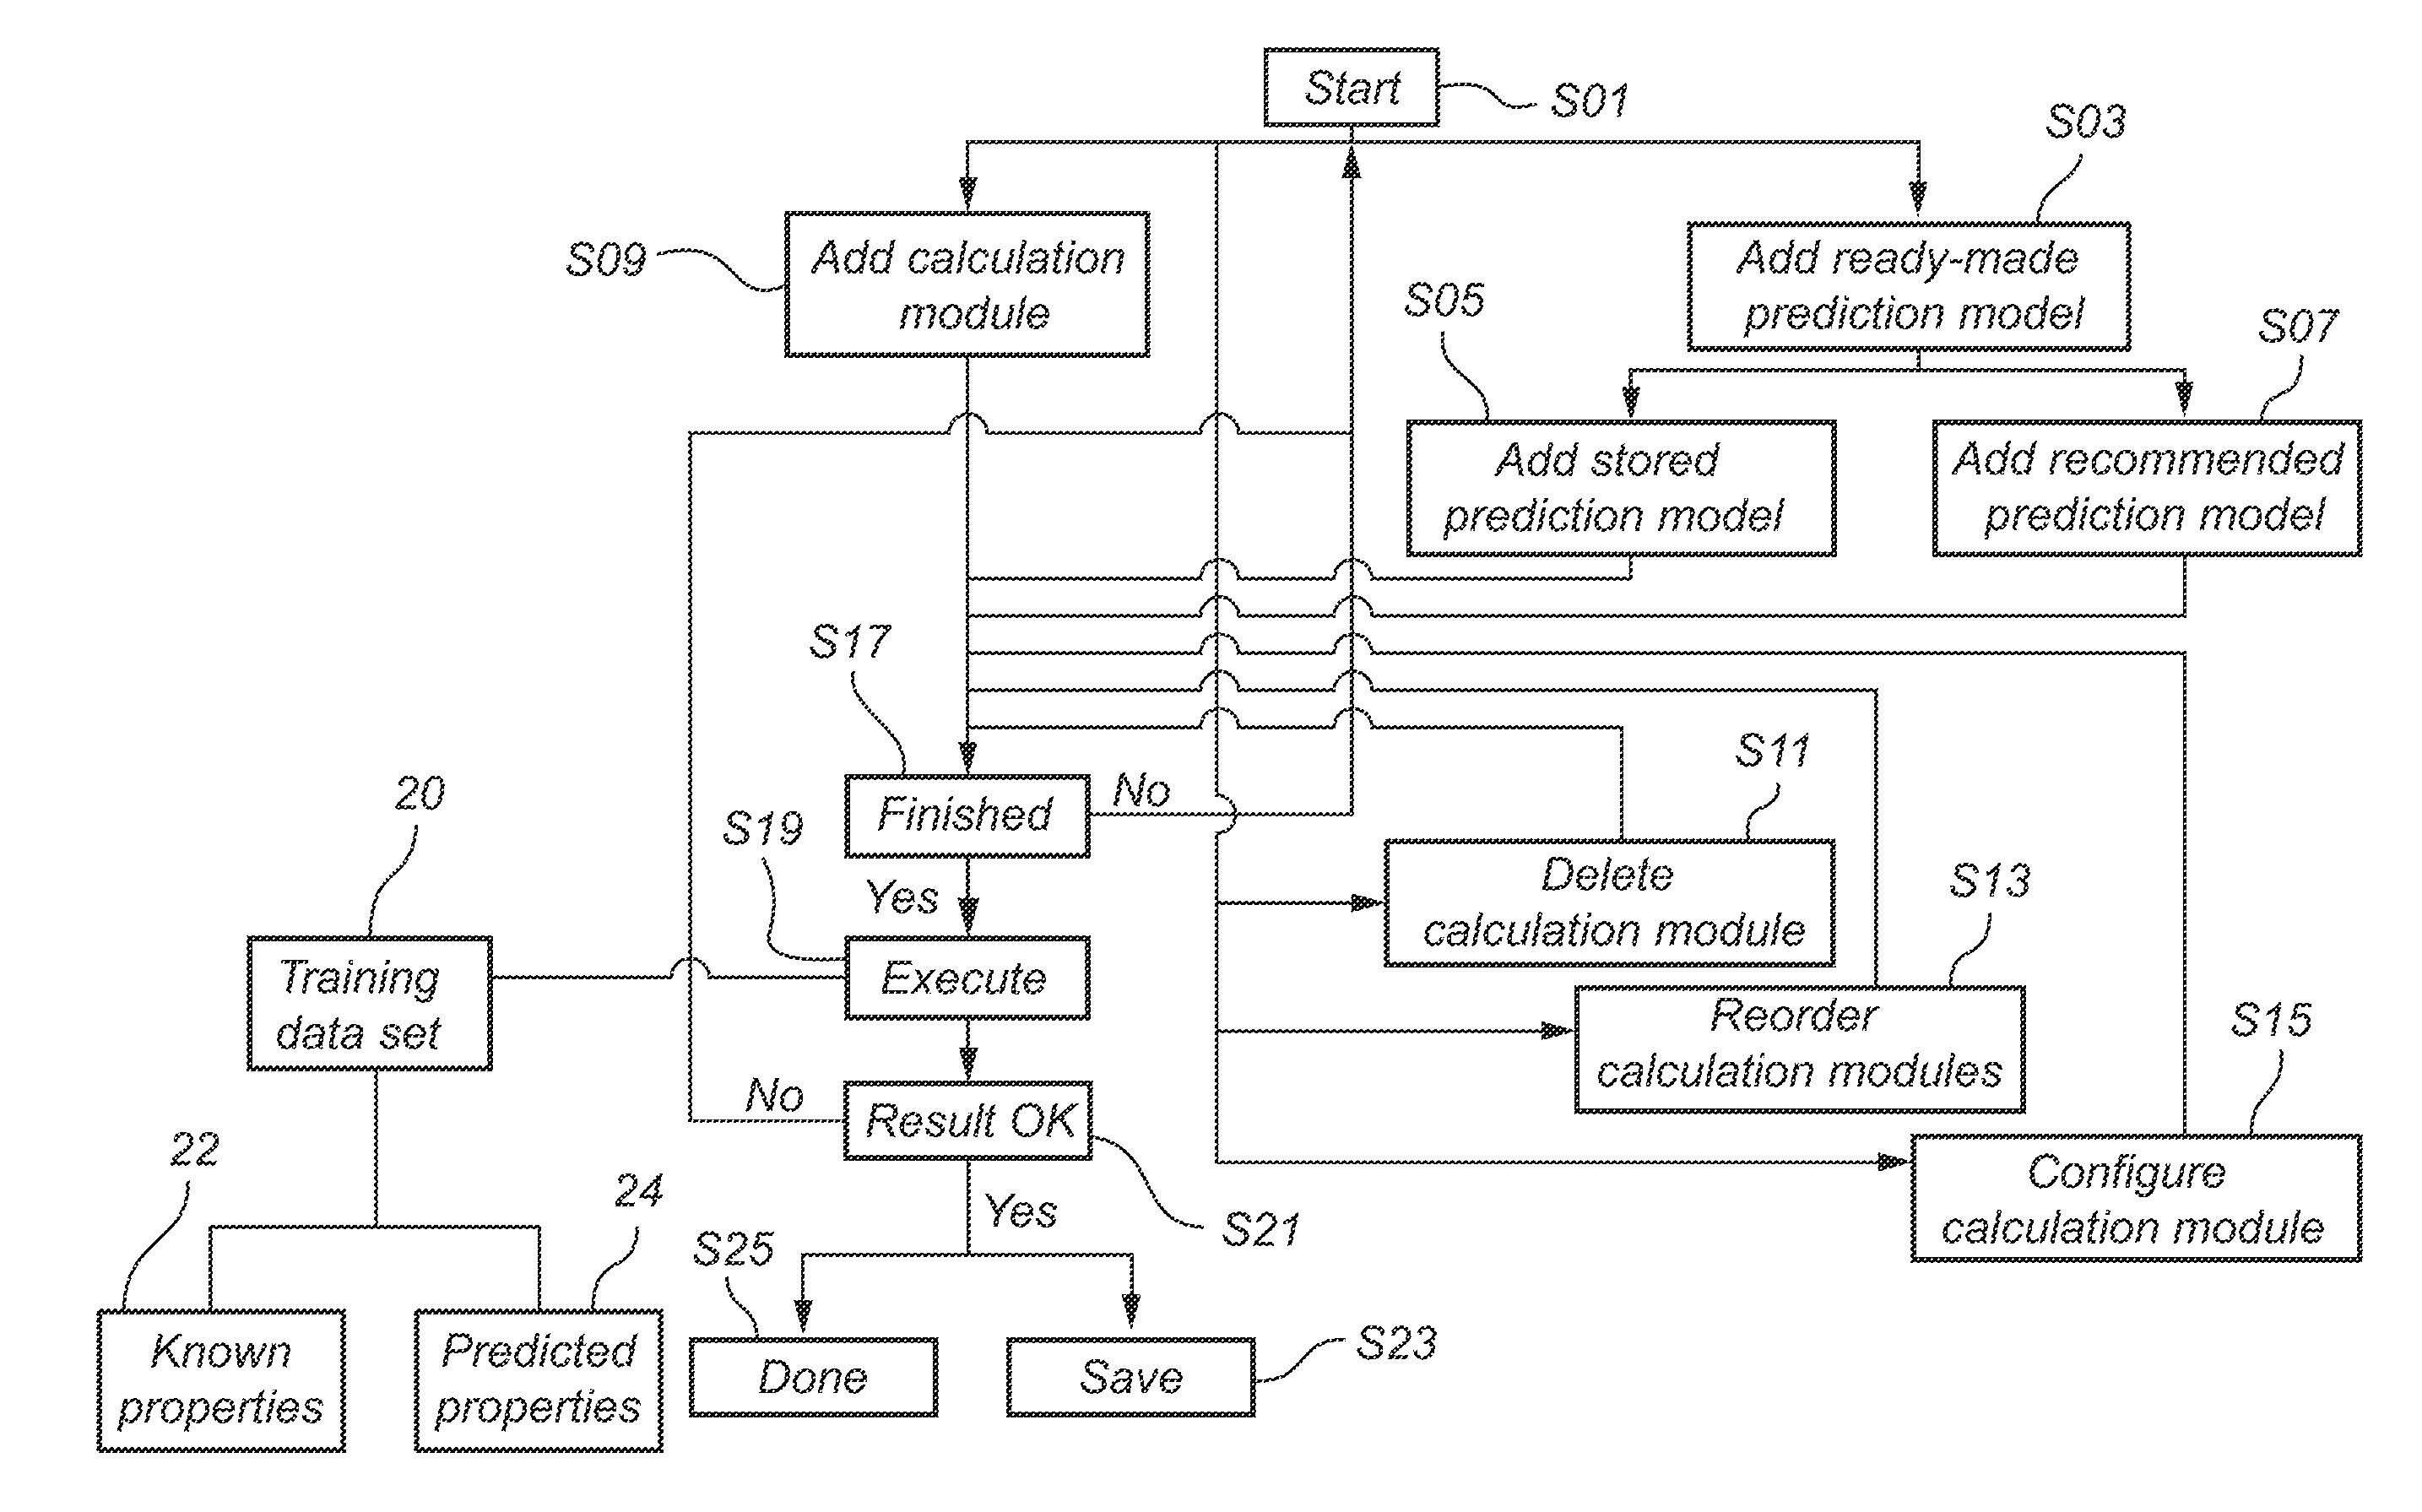
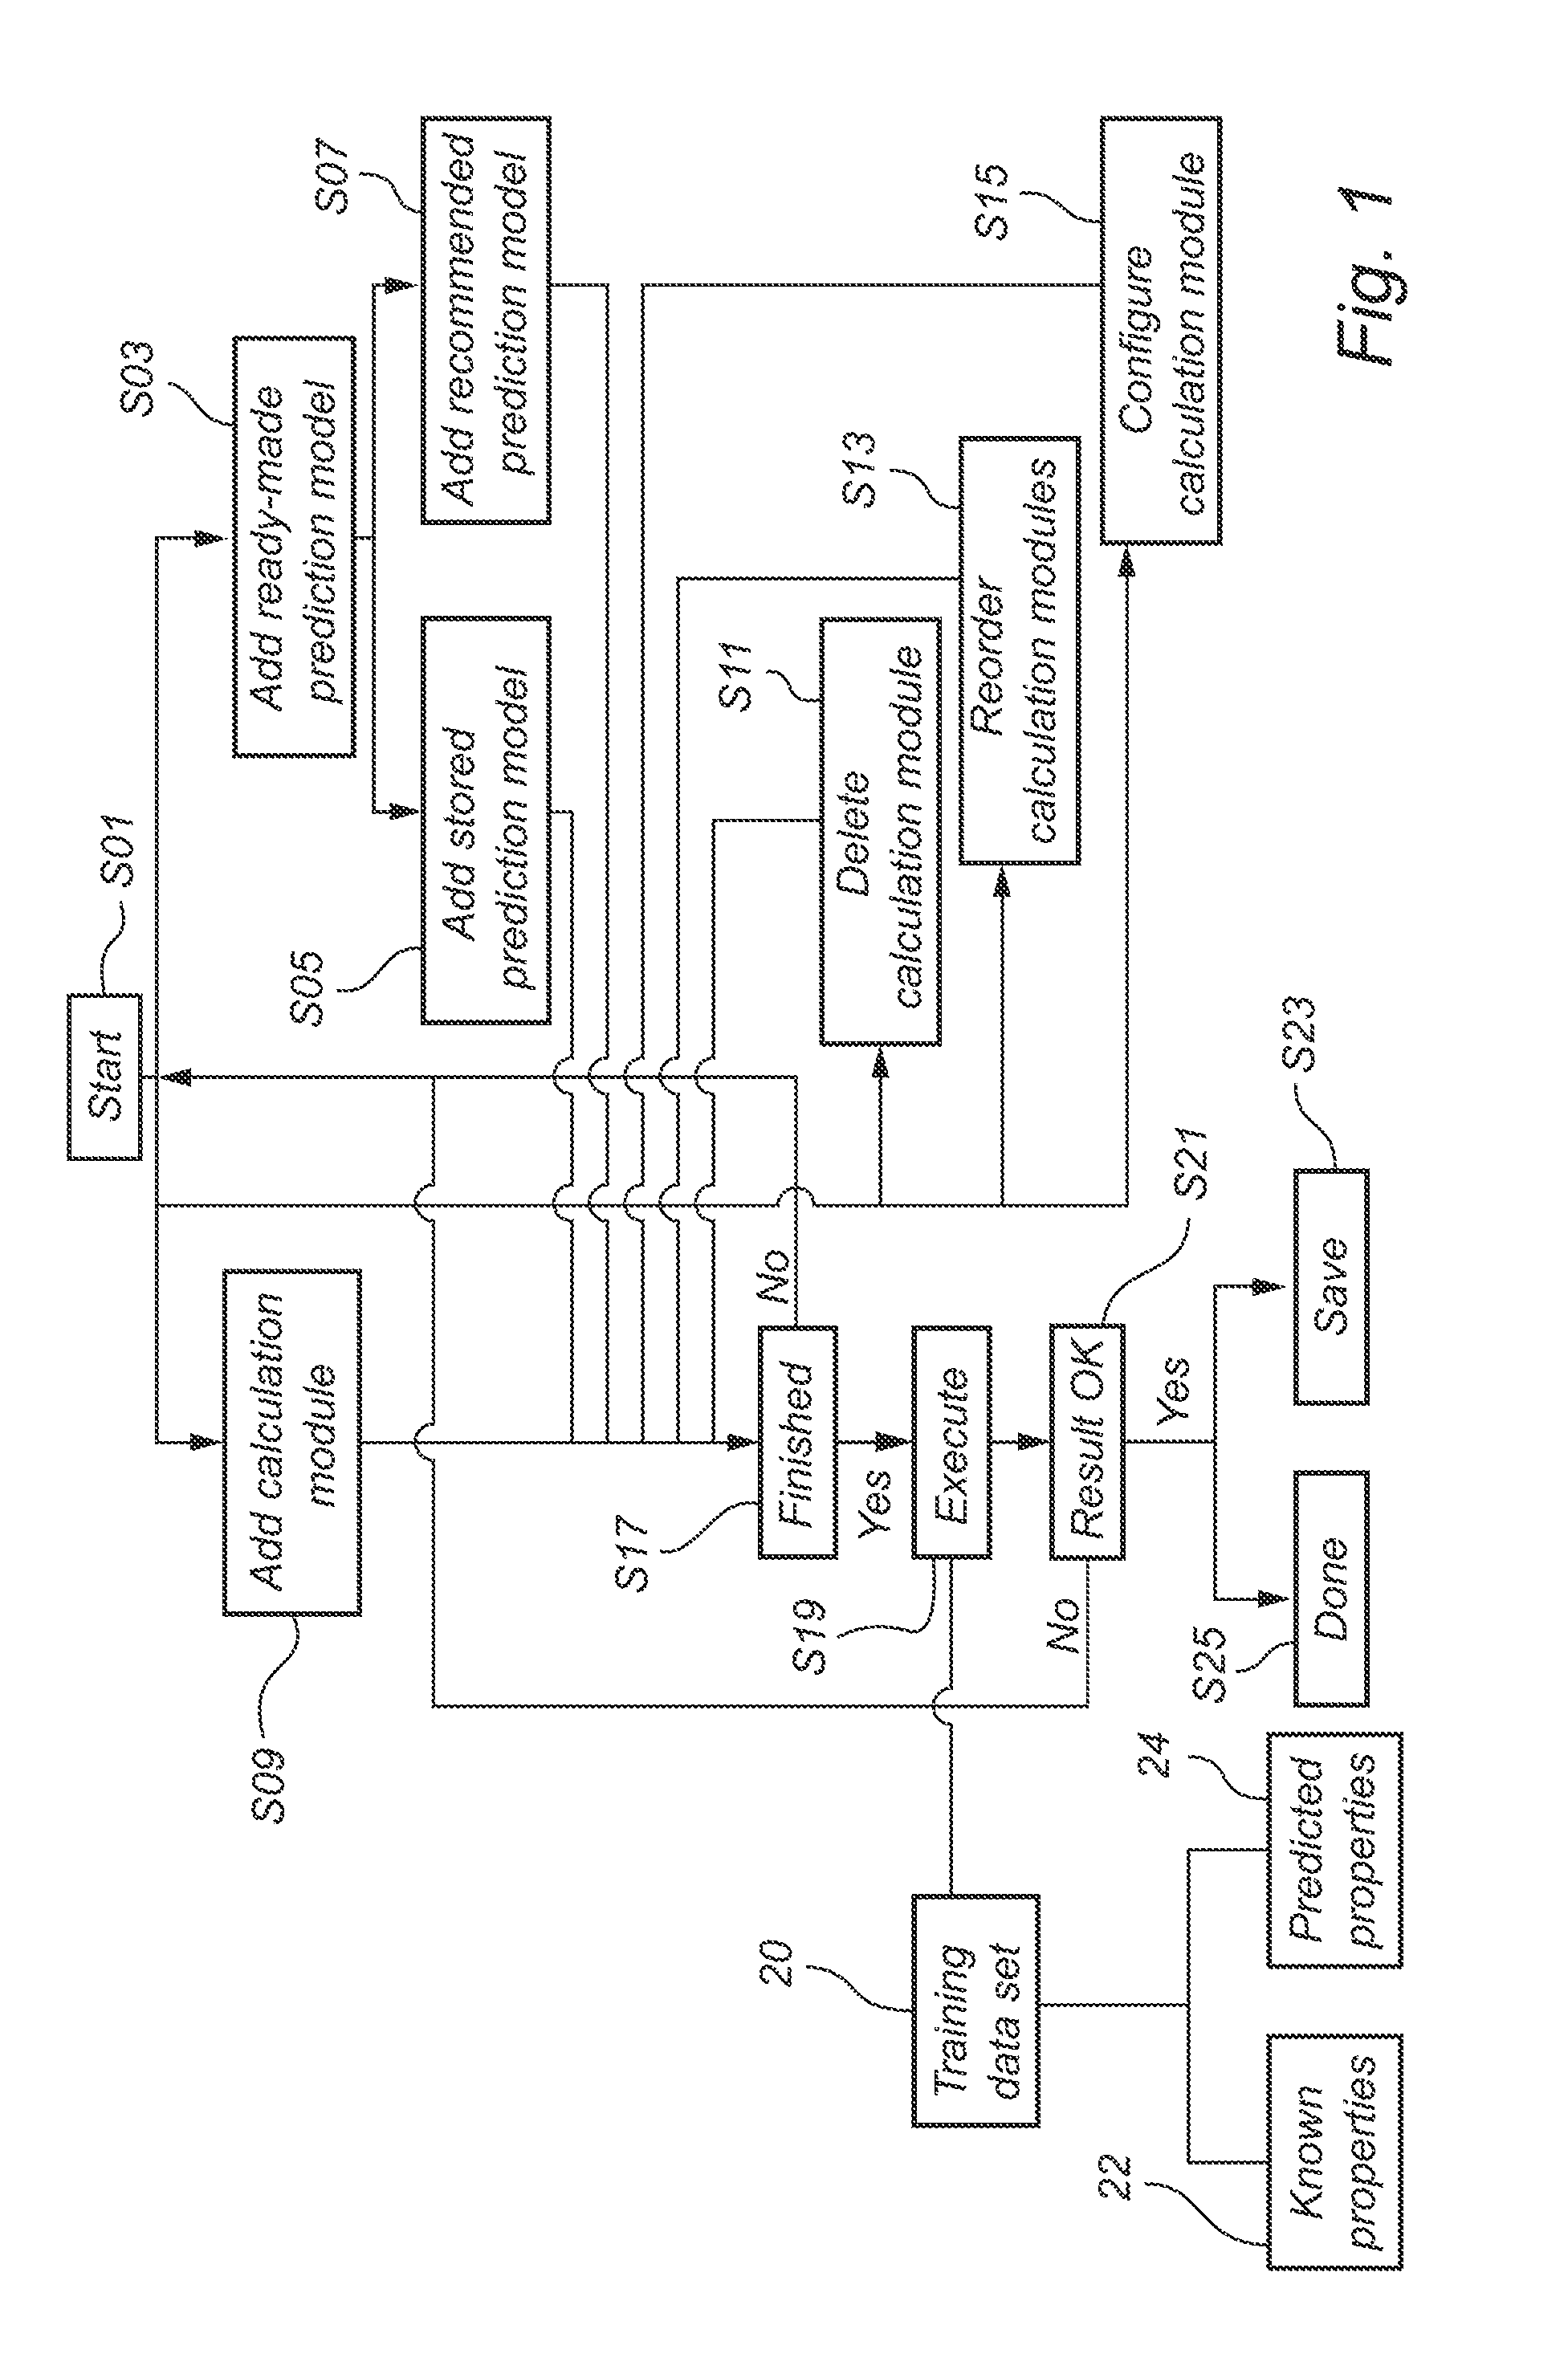
[0074]FIG. 1 is a flowchart of a method according to an embodiment of the present invention. The figure shows a workflow for forming a prediction model. The user starts (step S01) by either adding a ready-made prediction model (step S03) or by adding (step S09) one or several calculation modules to the prediction model to be formed. If the user wants to add a ready-made prediction model (step S03), the user can choose between adding a stored prediction model (step S05) from a computer readable storage medium or by adding a recommended prediction model (step S07). If the user then considers the work of forming a prediction model to be finished (step S17), the user can execute (step S19) the formed prediction model by operating the training data set 20 on the calculation modules added to the prediction model and then verifying (step S21) a quality of the prediction model by comparing the predicted properties 24 of the training data set 20 with the known properties 22 of the same data ...


PUM


Abstract

A method for forming a prediction model for chemometric analysis is presented. A first graphical area is configured to display a first set of graphical objects; each of the graphical objects is representing a calculation module suitable for use in the prediction model. A second graphical area is configured to display a second set of graphical objects representing the set of the calculation modules added to a prediction model. The calculation modules are added to the second area by the user. By building the calculation modules in such a way that any of the calculation modules may follow or be followed by any of the calculation modules, the user is allowed to add one / several calculation module(s) in any order and number, without restrictions.

Description

TECHNICAL FIELD[0001]The present invention relates to a method and a graphical user interface for forming a prediction model for chemometric analysis.BACKGROUND ART[0002]The general technical area of the invention concerns instruments and software for spectra analysis for chemometric purposes.[0003]For the complex spectra analysis typically encountered in process systems, it is often desirable to use chemometric modelling to de-convolve the data gathered from the spectra in order to derive the properties of interest to the user.[0004]Conventionally, the user builds the prediction model by selecting a number of the spectra for processing with the intent being to mathematically (e. g. statistically) correlate the monitored spectra with selected properties. Using the remaining spectra, the user then validates the model by running it on the remaining unused spectra, thereby generating predictions of the property or properties of the associated samples. A comparison of the predicted and ...

Claims


Application Information

Patent Timeline
Patent Type & Authority Applications(United States)
IPC IPC(8): G06N99/00G06F3/0486G06N5/04G06F3/0481G06N20/00
CPCG06N99/005G06N5/04G06F3/0486G06F3/0481G16C20/20G16C20/70G16C20/80G06N20/00
Inventor JANSON, CARL
Owner FOSS ANALYTICAL AB (SE)
Features
  • R&D
  • Intellectual Property
  • Life Sciences
  • Materials
  • Tech Scout
  • Unparalleled Data Quality
  • Higher Quality Content
  • 60% Fewer Hallucinations
Learn More