Ranking of Store Locations Using Separable Features of Traffic Counts

Inactive Publication Date: 2015-04-30
CELLO PARTNERSHIP DBA VERIZON WIRELESS
View PDF9 Cites 11 Cited by
  • Summary
  • Abstract
  • Description
  • Claims
  • Application Information

AI Technical Summary

Problems solved by technology

Moreover, some locations may cater to different audiences or may experience differences in traffic due to advertising or other uncharacterized external factors.
While a business may monitor daily cash flow, it may be difficult for the business to obtain good information to use to model patterns of customer behavior.
However, on the weekends, further differences appear, perhaps based on differences between those points of interest that substantially serve weekday office traffic only, as compa

Method used


Image

  • Ranking of Store Locations Using Separable Features of Traffic Counts
  • Ranking of Store Locations Using Separable Features of Traffic Counts
  • Ranking of Store Locations Using Separable Features of Traffic Counts

Examples


Embodiment Construction

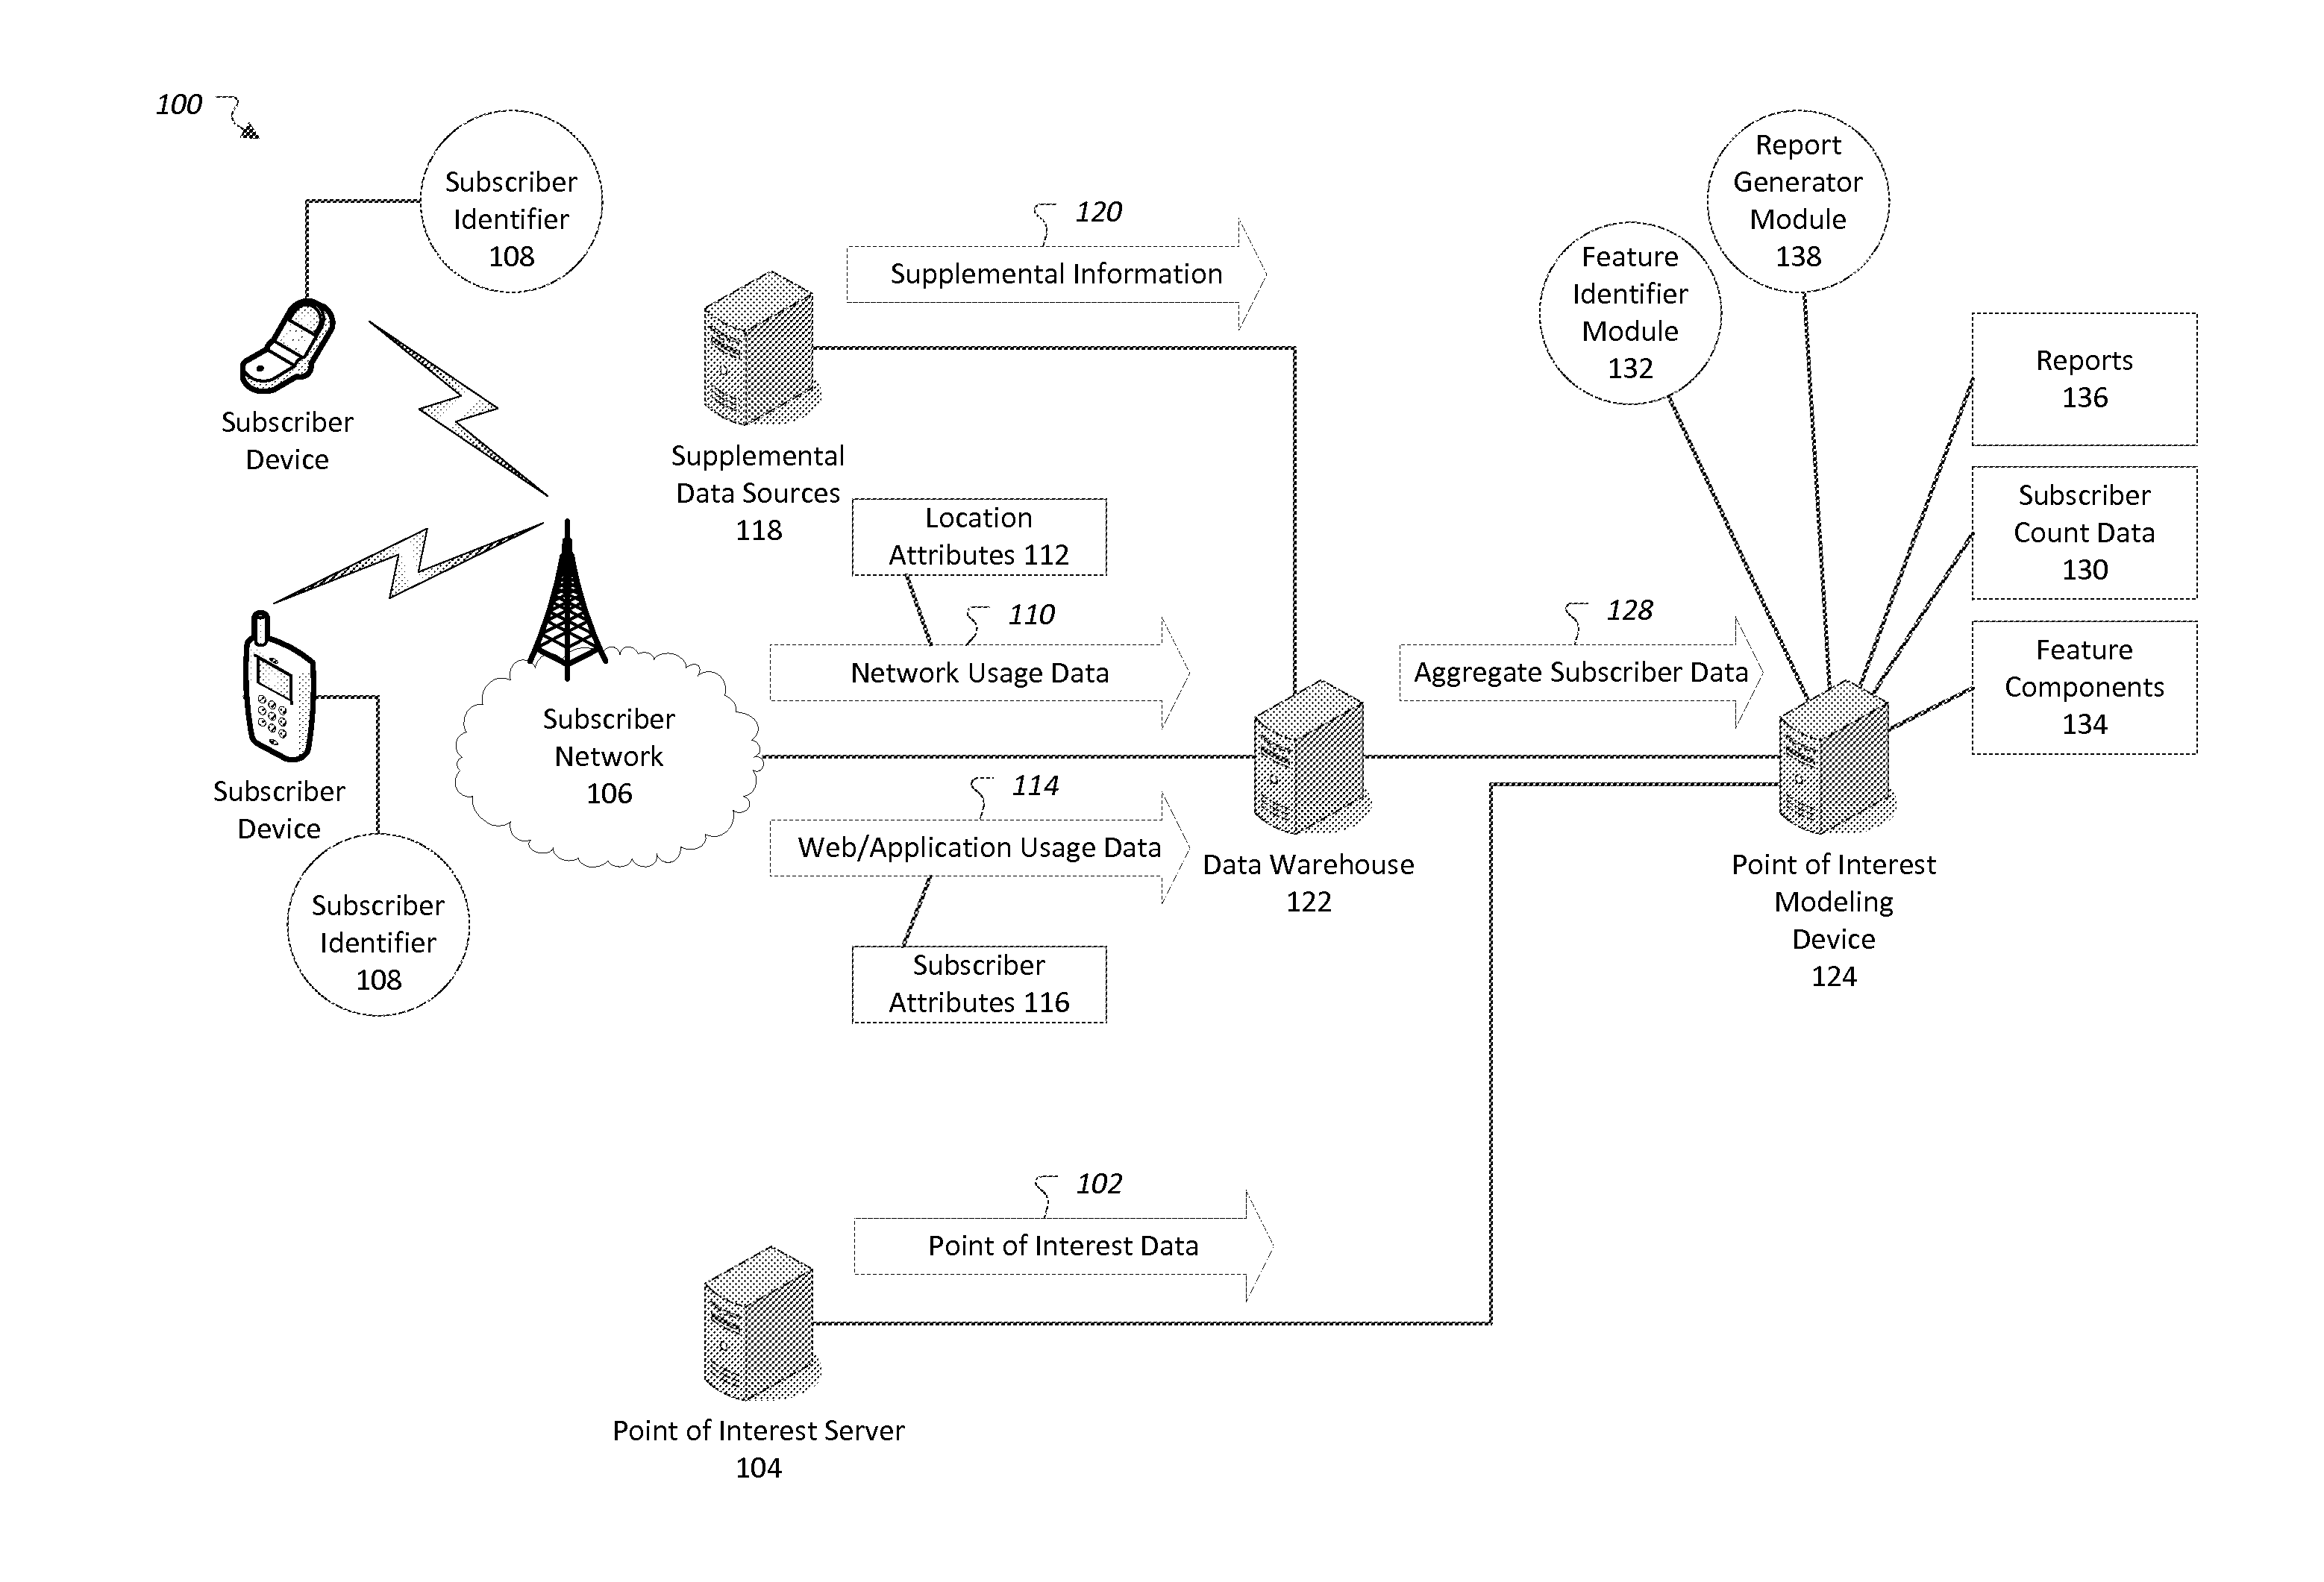
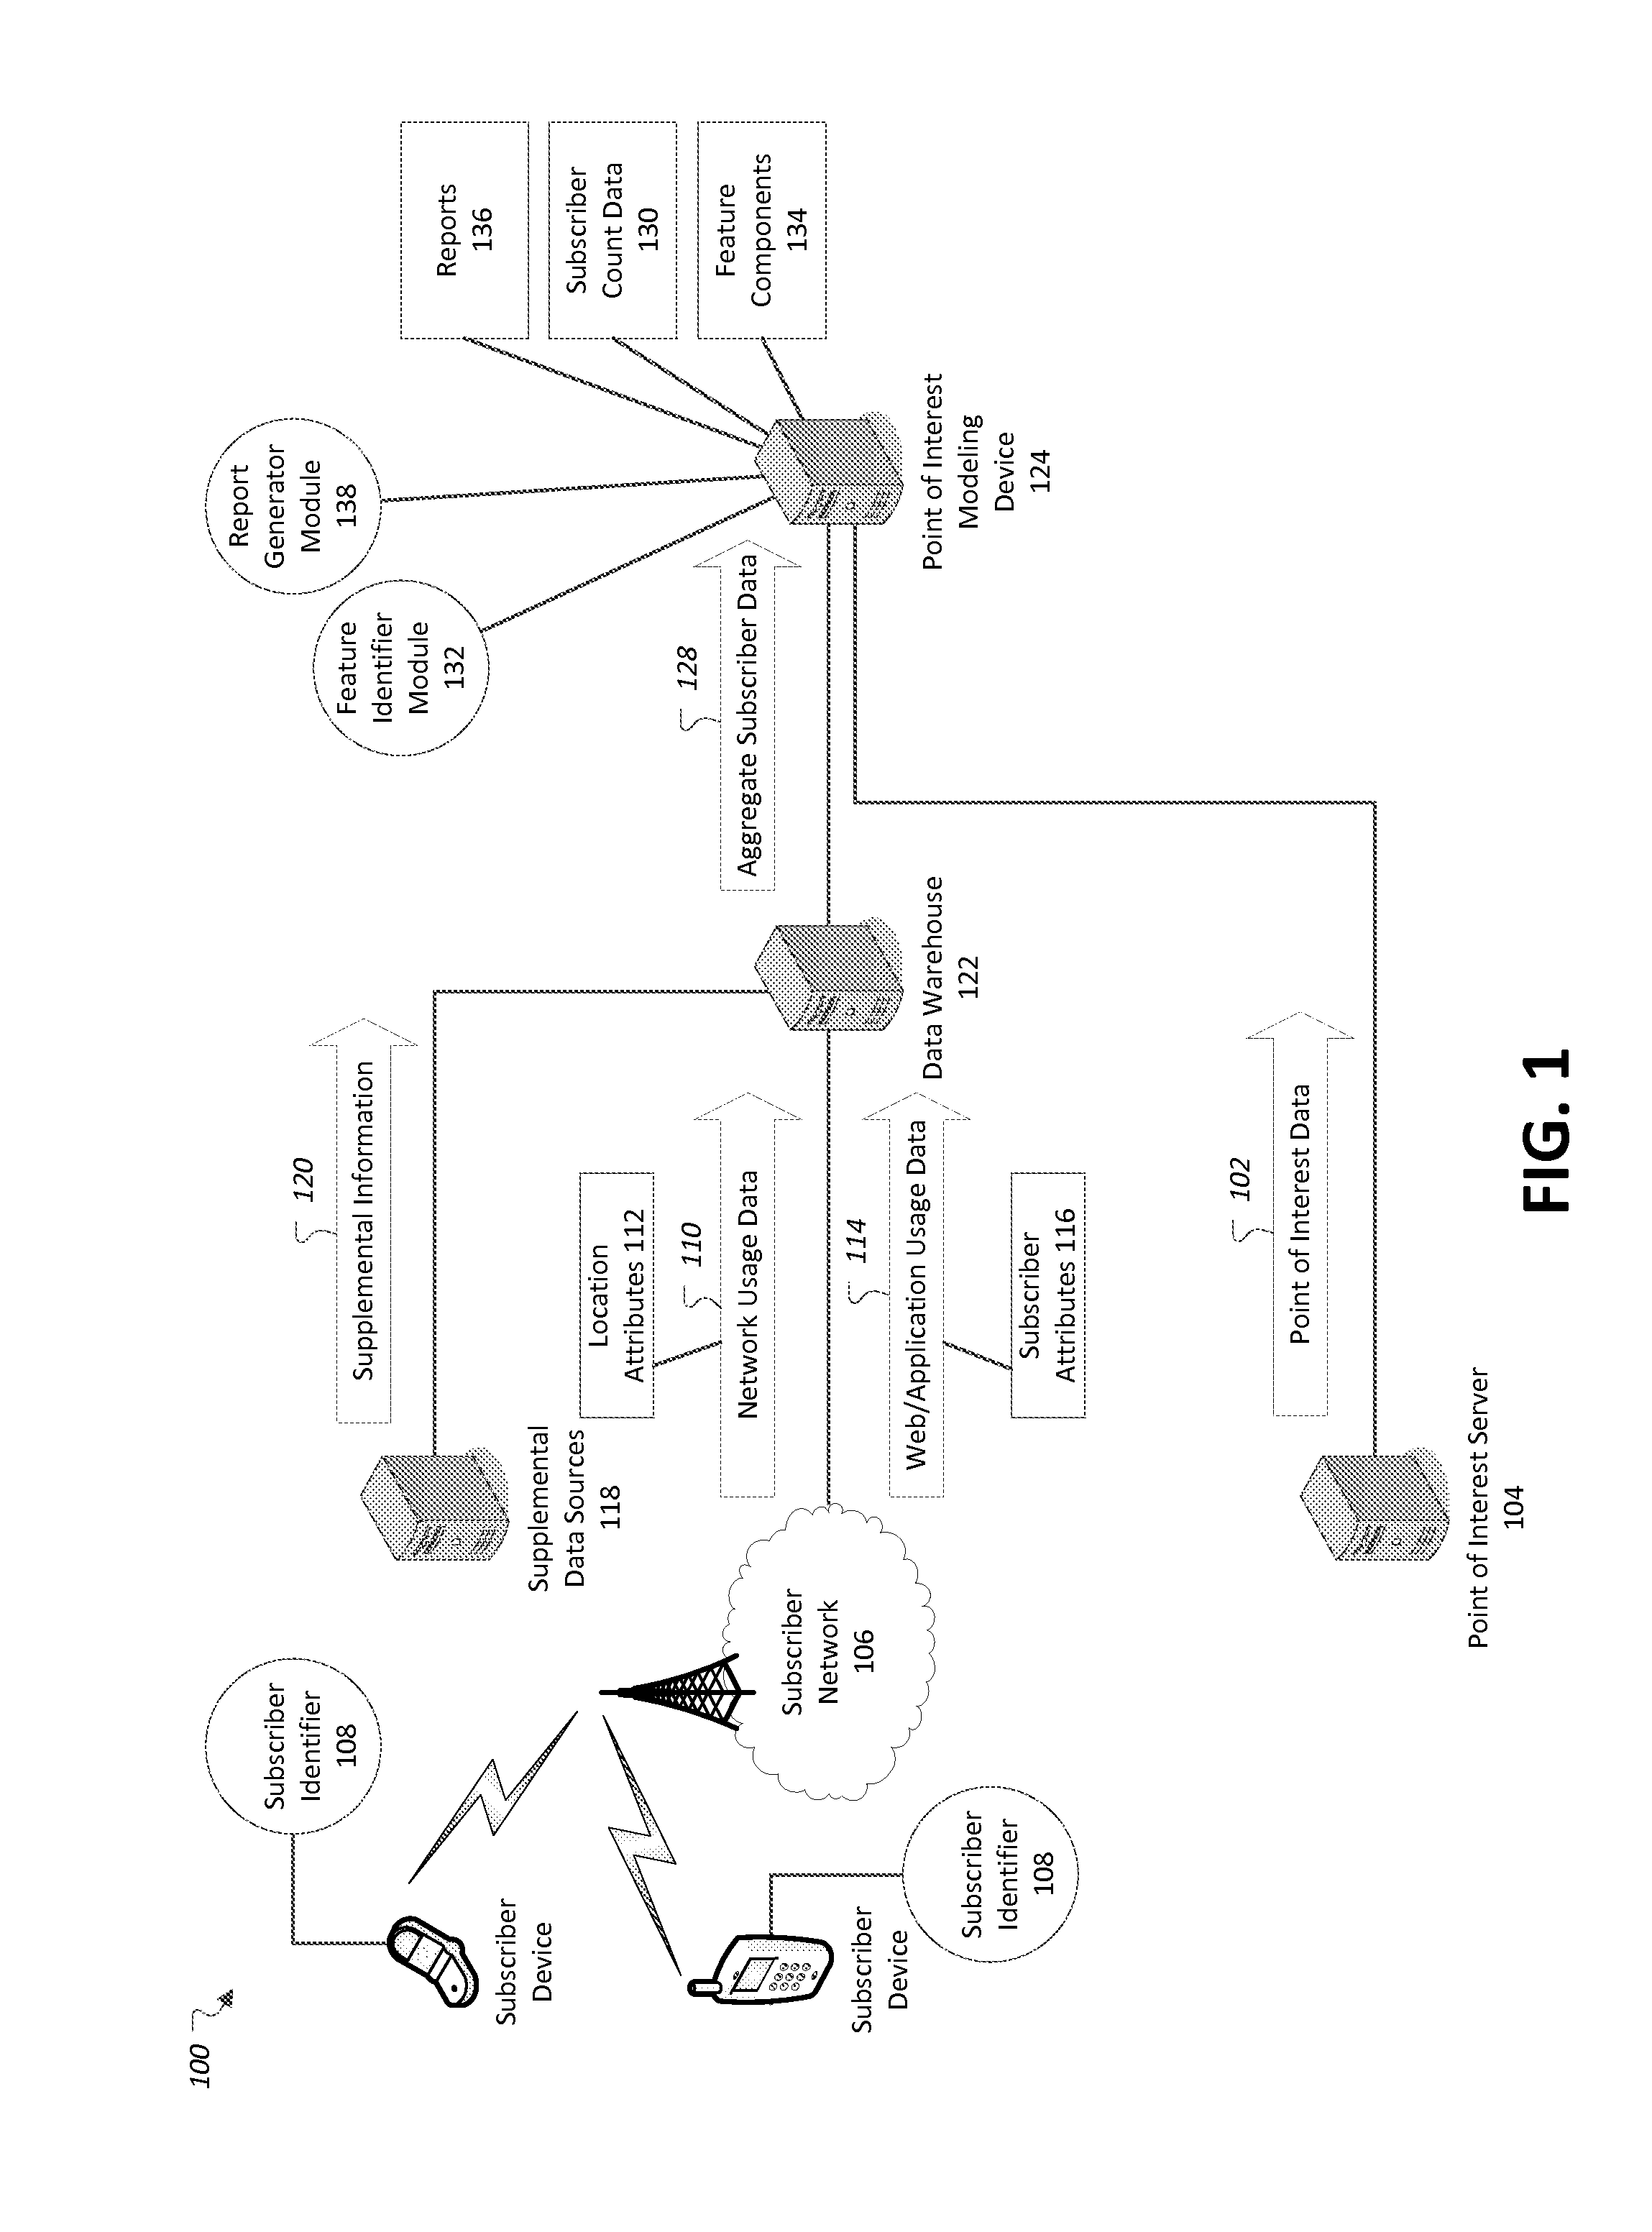
[0011]An advertising system may determine subscriber counts indicative of subscriber presence near various points of interest, and may perform analysis on the determined subscriber counts to identify common or differentiating features in traffic patterns at the points of interest. These features may be used to build a model of customer behavior, which may in turn be used to identify past traffic flows and predict future traffic flows at the points of interest.

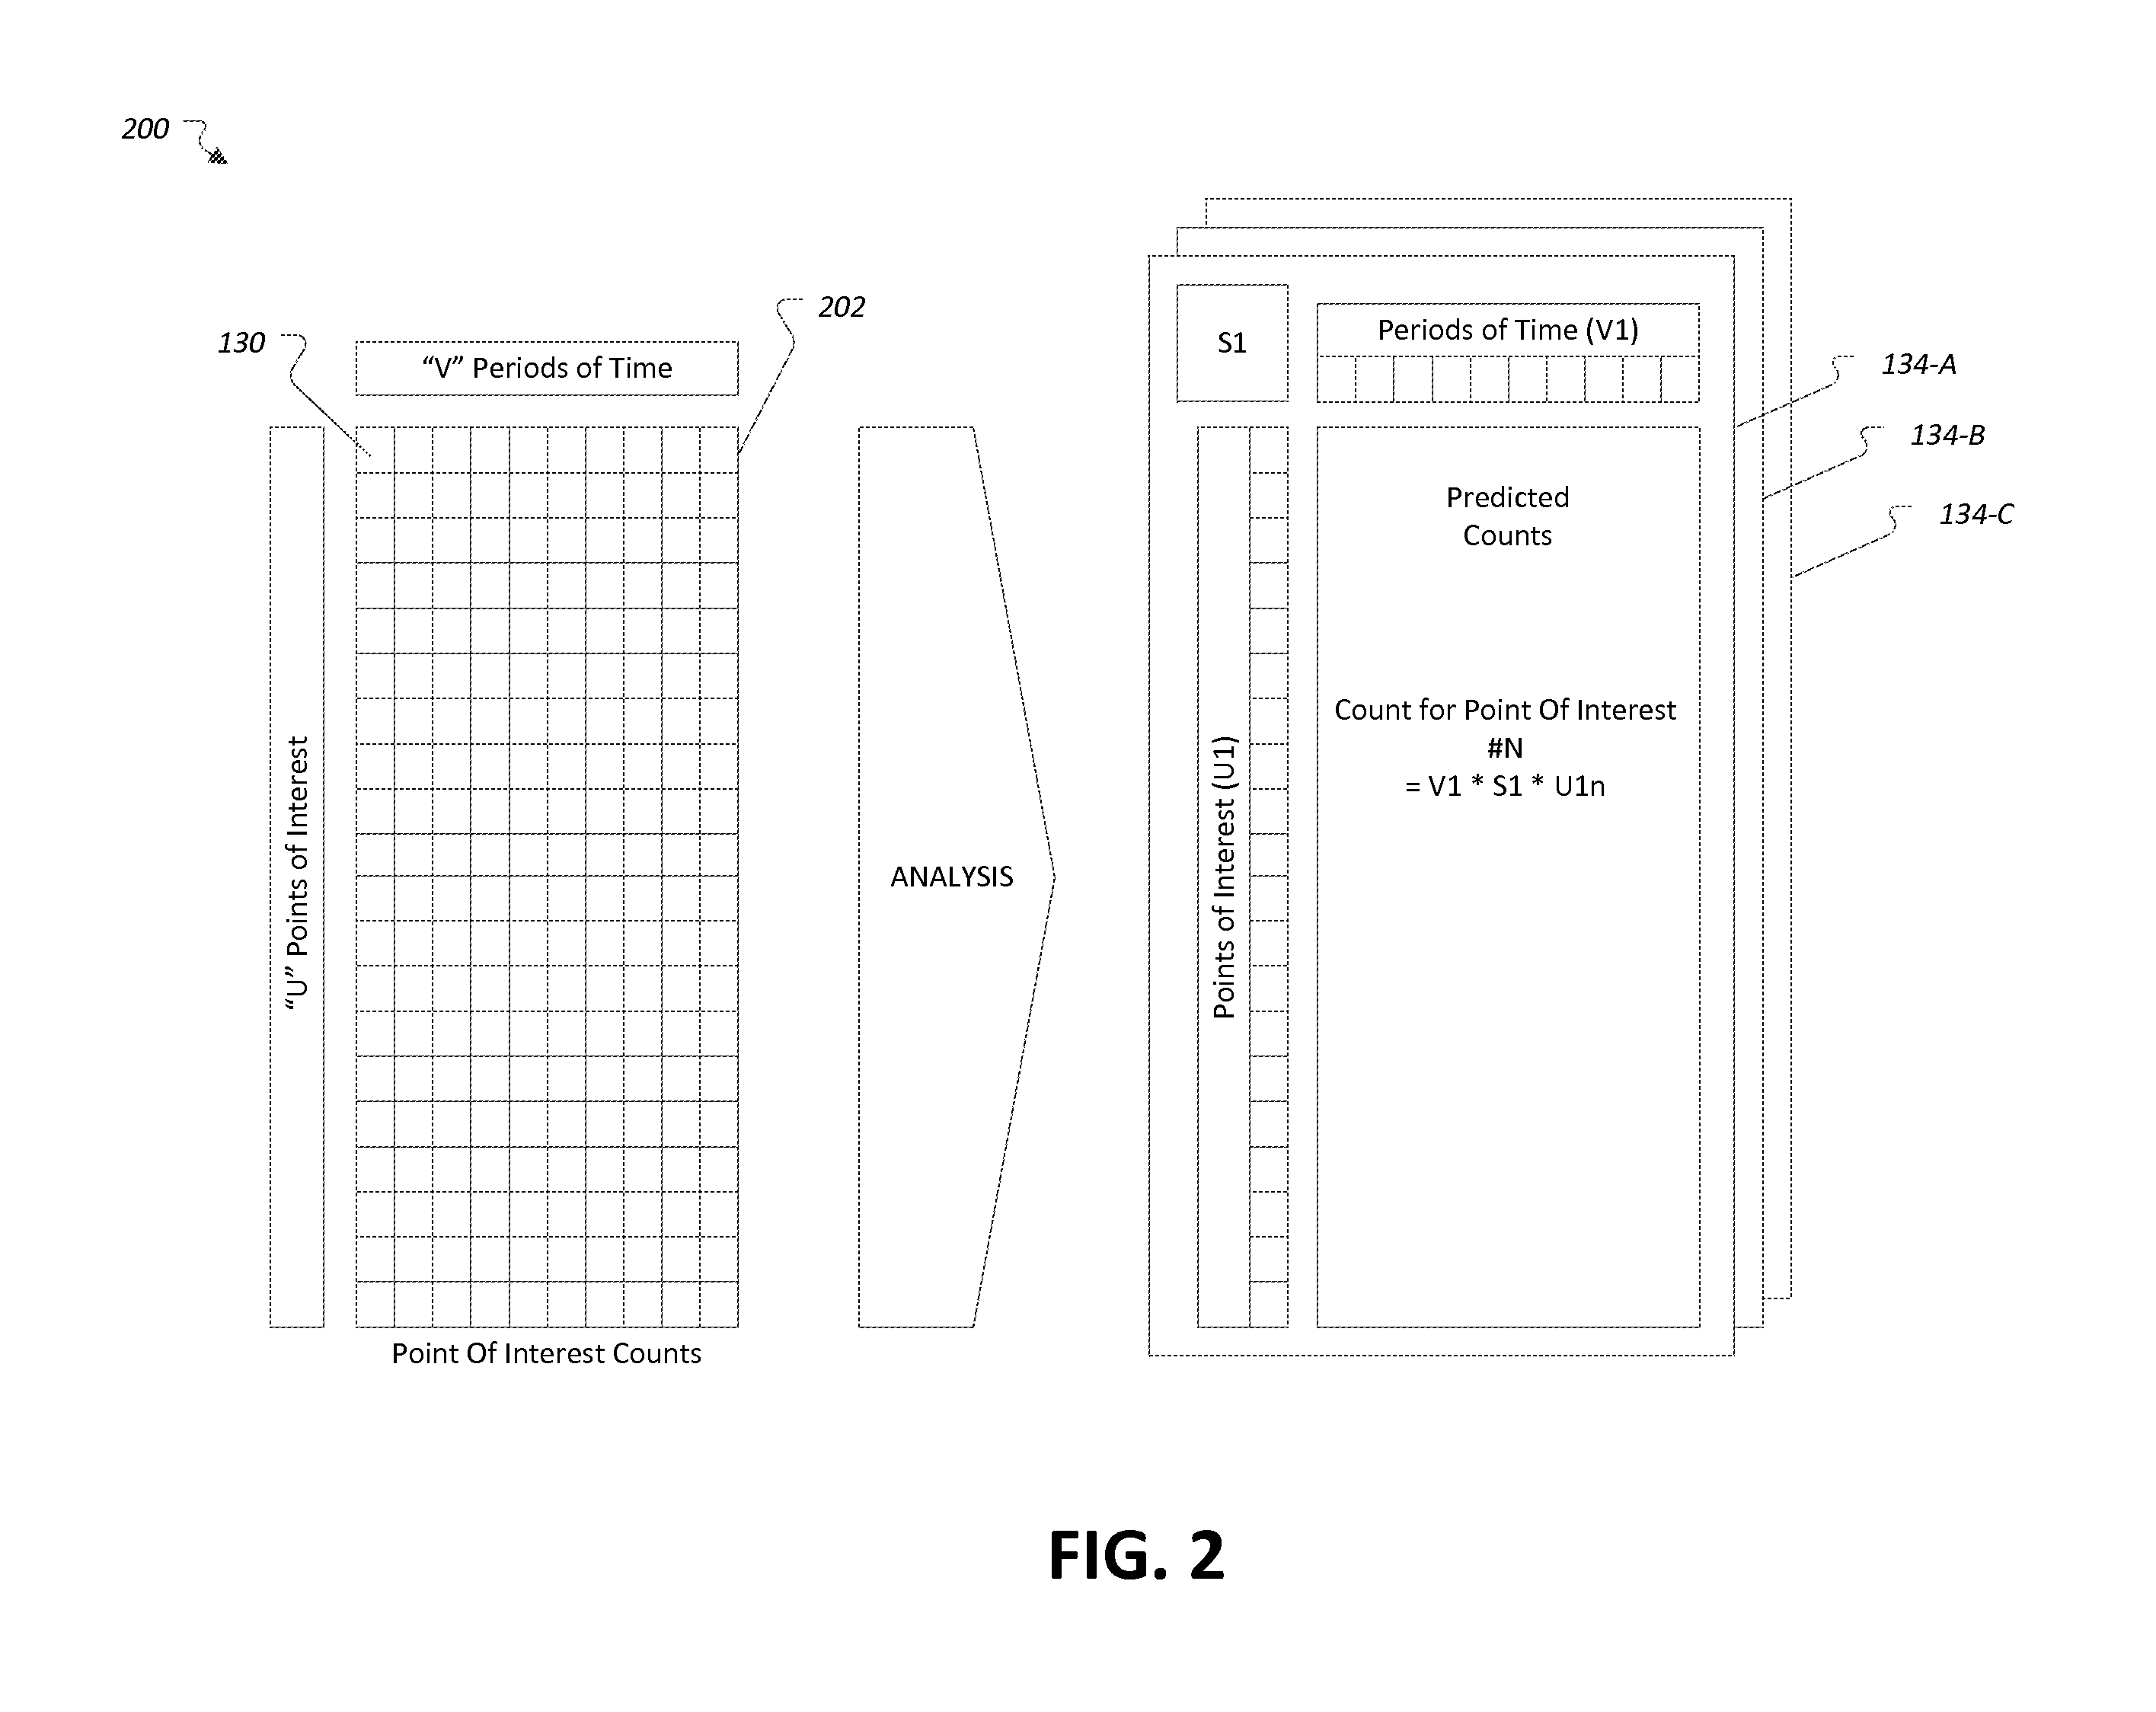
[0012]To identify the features, the advertising system may generate and analyze a matrix including subscriber count data for a plurality of points of interest within a geographical area. For instance, the matrix may include counts per time period arranged according to time period and point of interest, where each row of the matrix represents daily counts of subscriber traffic at a point of interest, each column represents a single time period of daily counts across the points of interest, and each cell represents the subscriber...


PUM


Abstract

A system may generate a matrix according to subscriber count data for a plurality of points of interest within a geographical area over a period of time identified from aggregate subscriber data, the matrix including counts per subset of the period of time arranged according to subset of the period of time and point of interest. The system may further perform a factorization of the matrix of subscriber counts to extract feature components of the subscriber count data, identify at least a primary feature component and a secondary feature component according to the factorization, and provide a ranking of at least a subset of the points of interest according to at least one of the primary feature component and the secondary feature component. The system may also receive a request for a report, generate the report according to the identified feature components, and provide the report responsive to a request.

Description

BACKGROUND[0001]Some store locations may perform better than others. For example, some locations may be busier overall, while other locations may have peak traffic on different days of the week. Moreover, some locations may cater to different audiences or may experience differences in traffic due to advertising or other uncharacterized external factors. While a business may monitor daily cash flow, it may be difficult for the business to obtain good information to use to model patterns of customer behavior.BRIEF DESCRIPTION OF THE DRAWINGS[0002]FIG. 1 illustrates an exemplary system for determining feature components for points of interest based on collected data from subscriber network devices.[0003]FIG. 2 illustrates an exemplary analysis of a matrix of subscriber count data from which underlying feature components may be extracted.[0004]FIGS. 3A and 3B illustrate exemplary reports depicting primary and other feature components of a plurality of points of interest in urban and sub...

Claims


Application Information

Patent Timeline
IPC IPC(8): G06Q10/06G06Q30/02
CPCG06Q10/0639G06Q30/0201G06Q30/0205
Inventor GHARACHORLOO, NADERMOSTOUFI, FARSHID
Owner CELLO PARTNERSHIP DBA VERIZON WIRELESS
Why Eureka
Try Eureka