Graphical analysis system and graphical analysis method

a graphical analysis and analysis system technology, applied in the field of graphical analysis systems and graphical analysis methods thereof, can solve problems such as wasting time, unable to provide an accurate comparison method, and deviations in calculated results

Inactive Publication Date: 2015-06-25
AU OPTRONICS CORP
View PDF3 Cites 12 Cited by
  • Summary
  • Abstract
  • Description
  • Claims
  • Application Information

AI Technical Summary

Benefits of technology

[0008]The disclosure provides a graphical analysis system and a graphical analysis method thereof. An aspect of the present disclosure is a graphical analysis system. According to an embodiment of the present disclosure, in which the graphical analysis system includes a display device, a receiving module, and a control module. The display device is configured to display a first graph, a second graph and a graph comparison area, in which the display device displays the first graph according to first data and displays the second graph according to second data. The receiving module is configured to receive a first input command and a second input command. The control module is configured to respond to the first input command and the second input command. When the first input command and the second input command are to drag and drop the first graph and the second graph into the graph comparison area respectively, the control module controls the display device to display a third graph and display corresponding data of the first data and of the second data in juxtaposition or overlapped on the third graph.

Problems solved by technology

However, although lots of functions are included in the graphical analysis tools and the graphical analysis tools are capable of accurately calculating a great quantity of data and converting data into graphical forms, it is difficult to provide an accurate method of comparison between plotted graphs; the graphical analysis tools can not directly present the differences of data between different data groups in graphical forms, and thus manual calculations are still required, thereby wasting time and are likely to result in deviations in calculated results due to human error.

Method used


Image

  • Graphical analysis system and graphical analysis method
  • Graphical analysis system and graphical analysis method
  • Graphical analysis system and graphical analysis method

Examples


Embodiment Construction

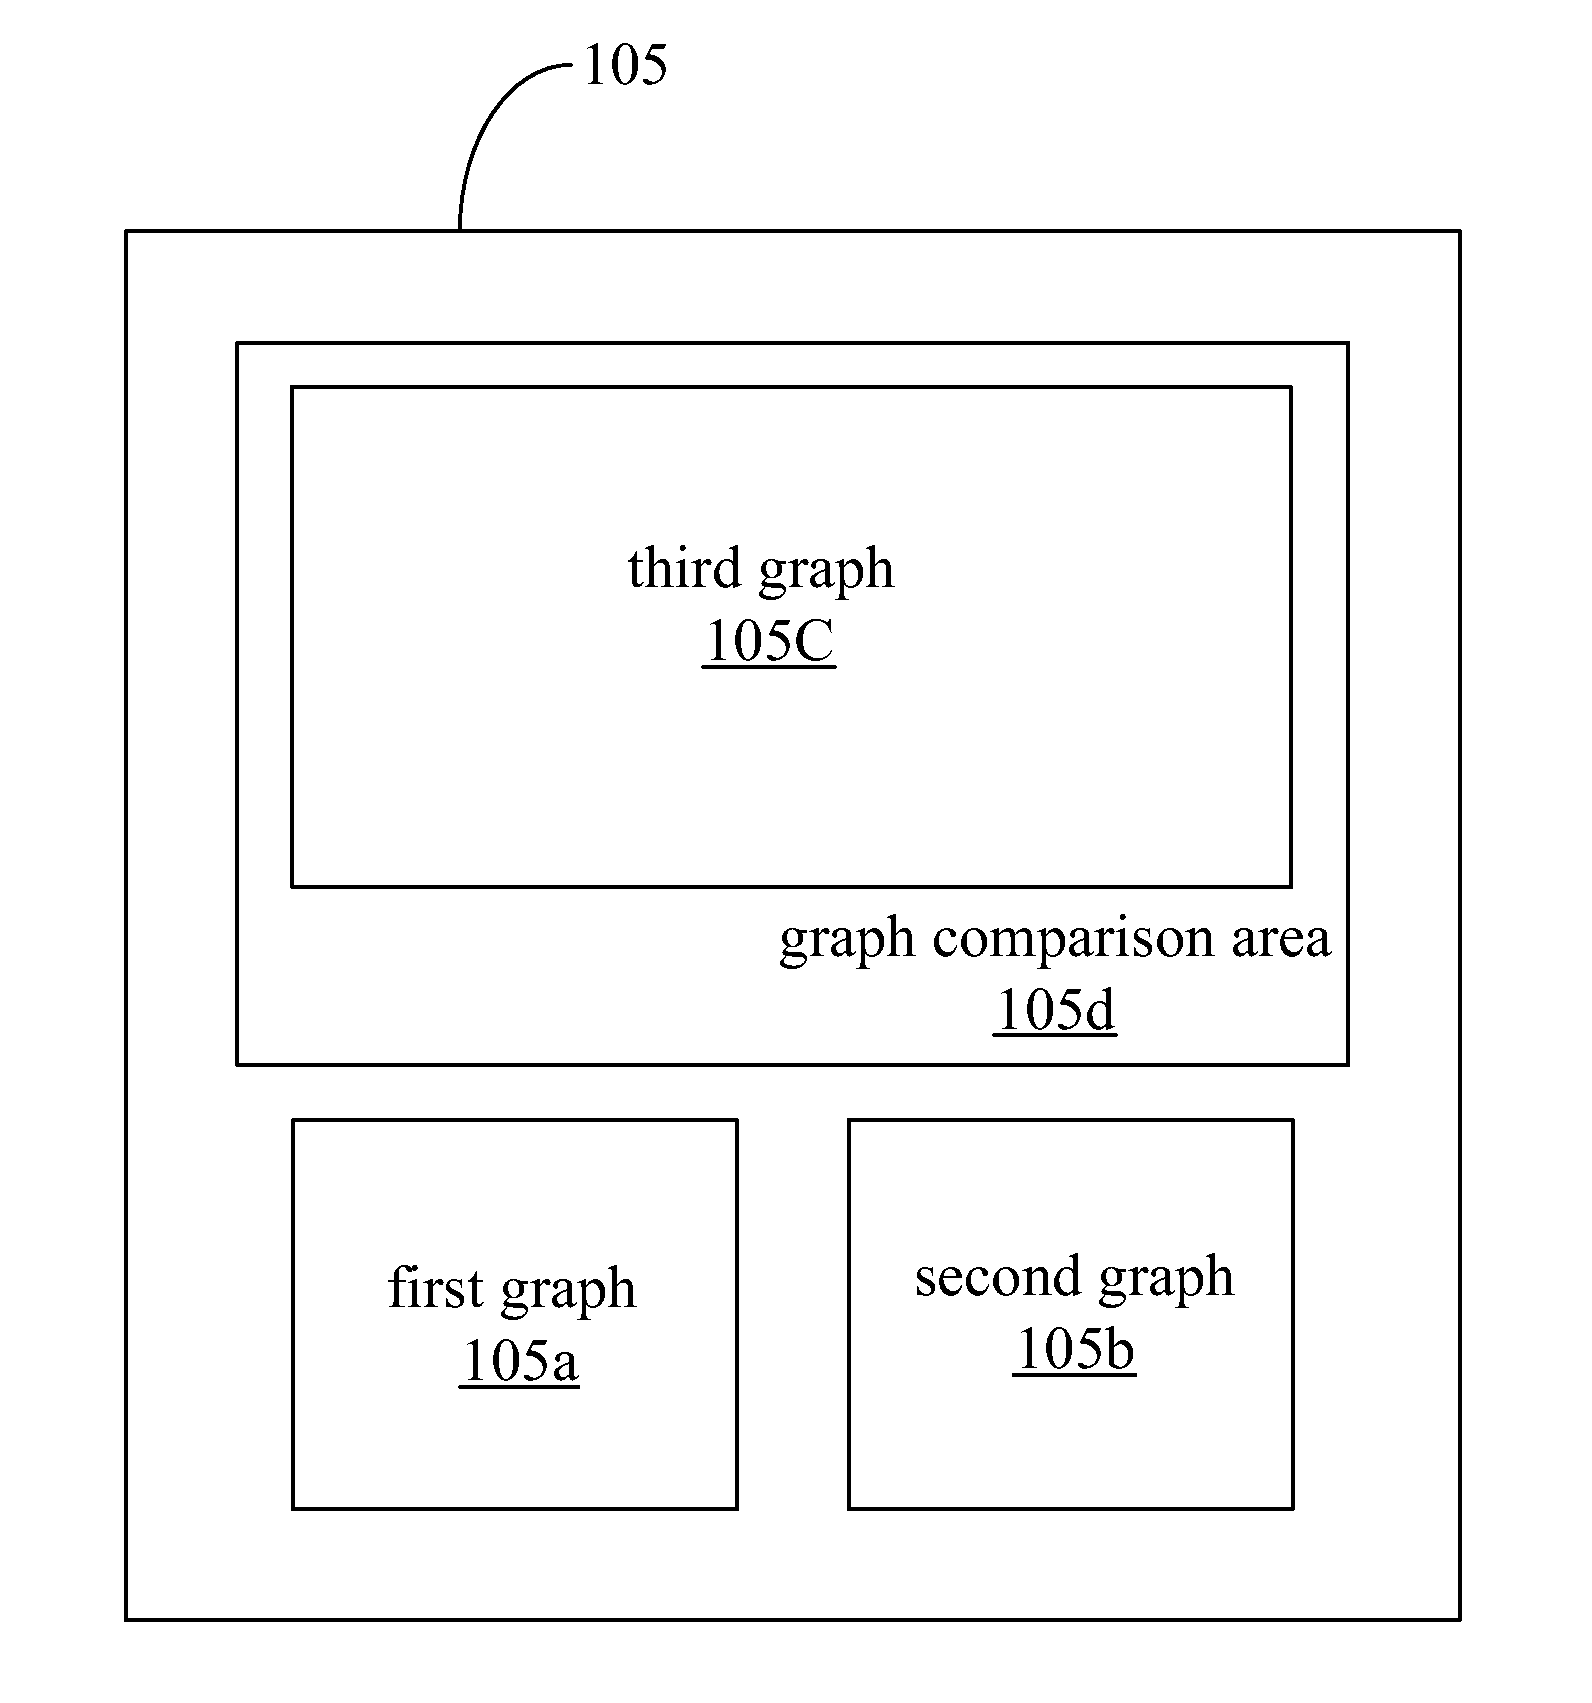
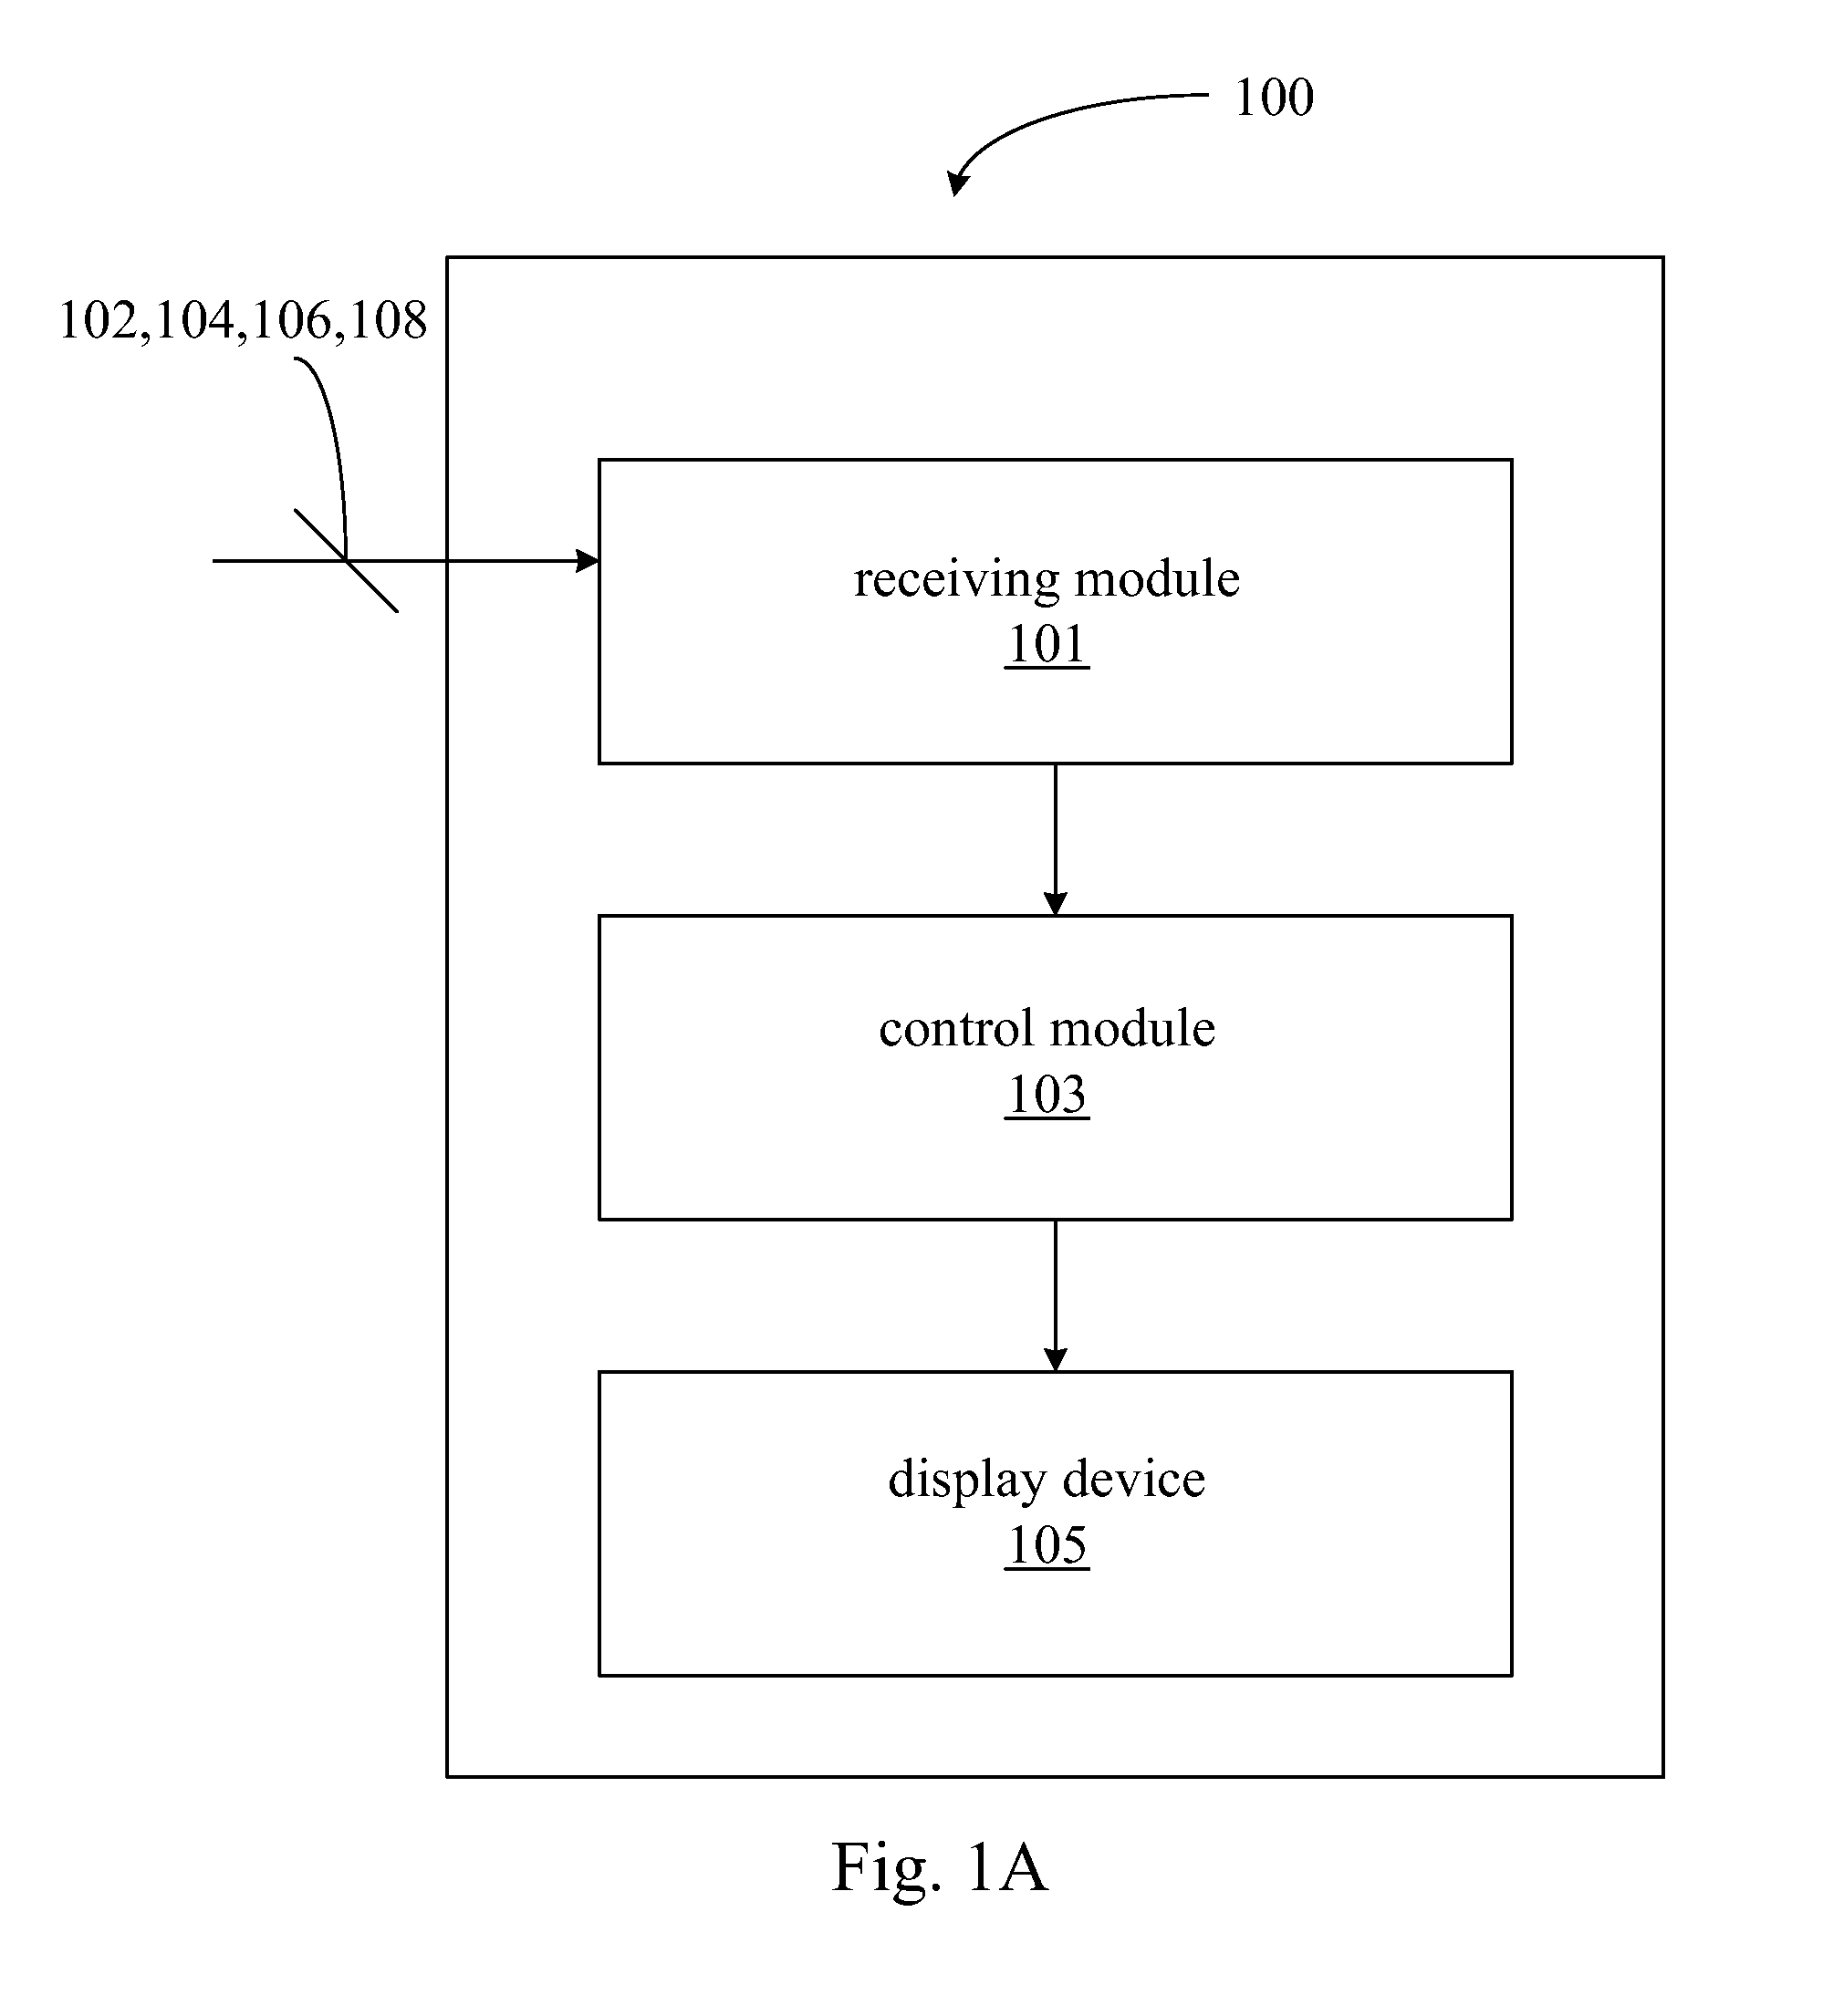
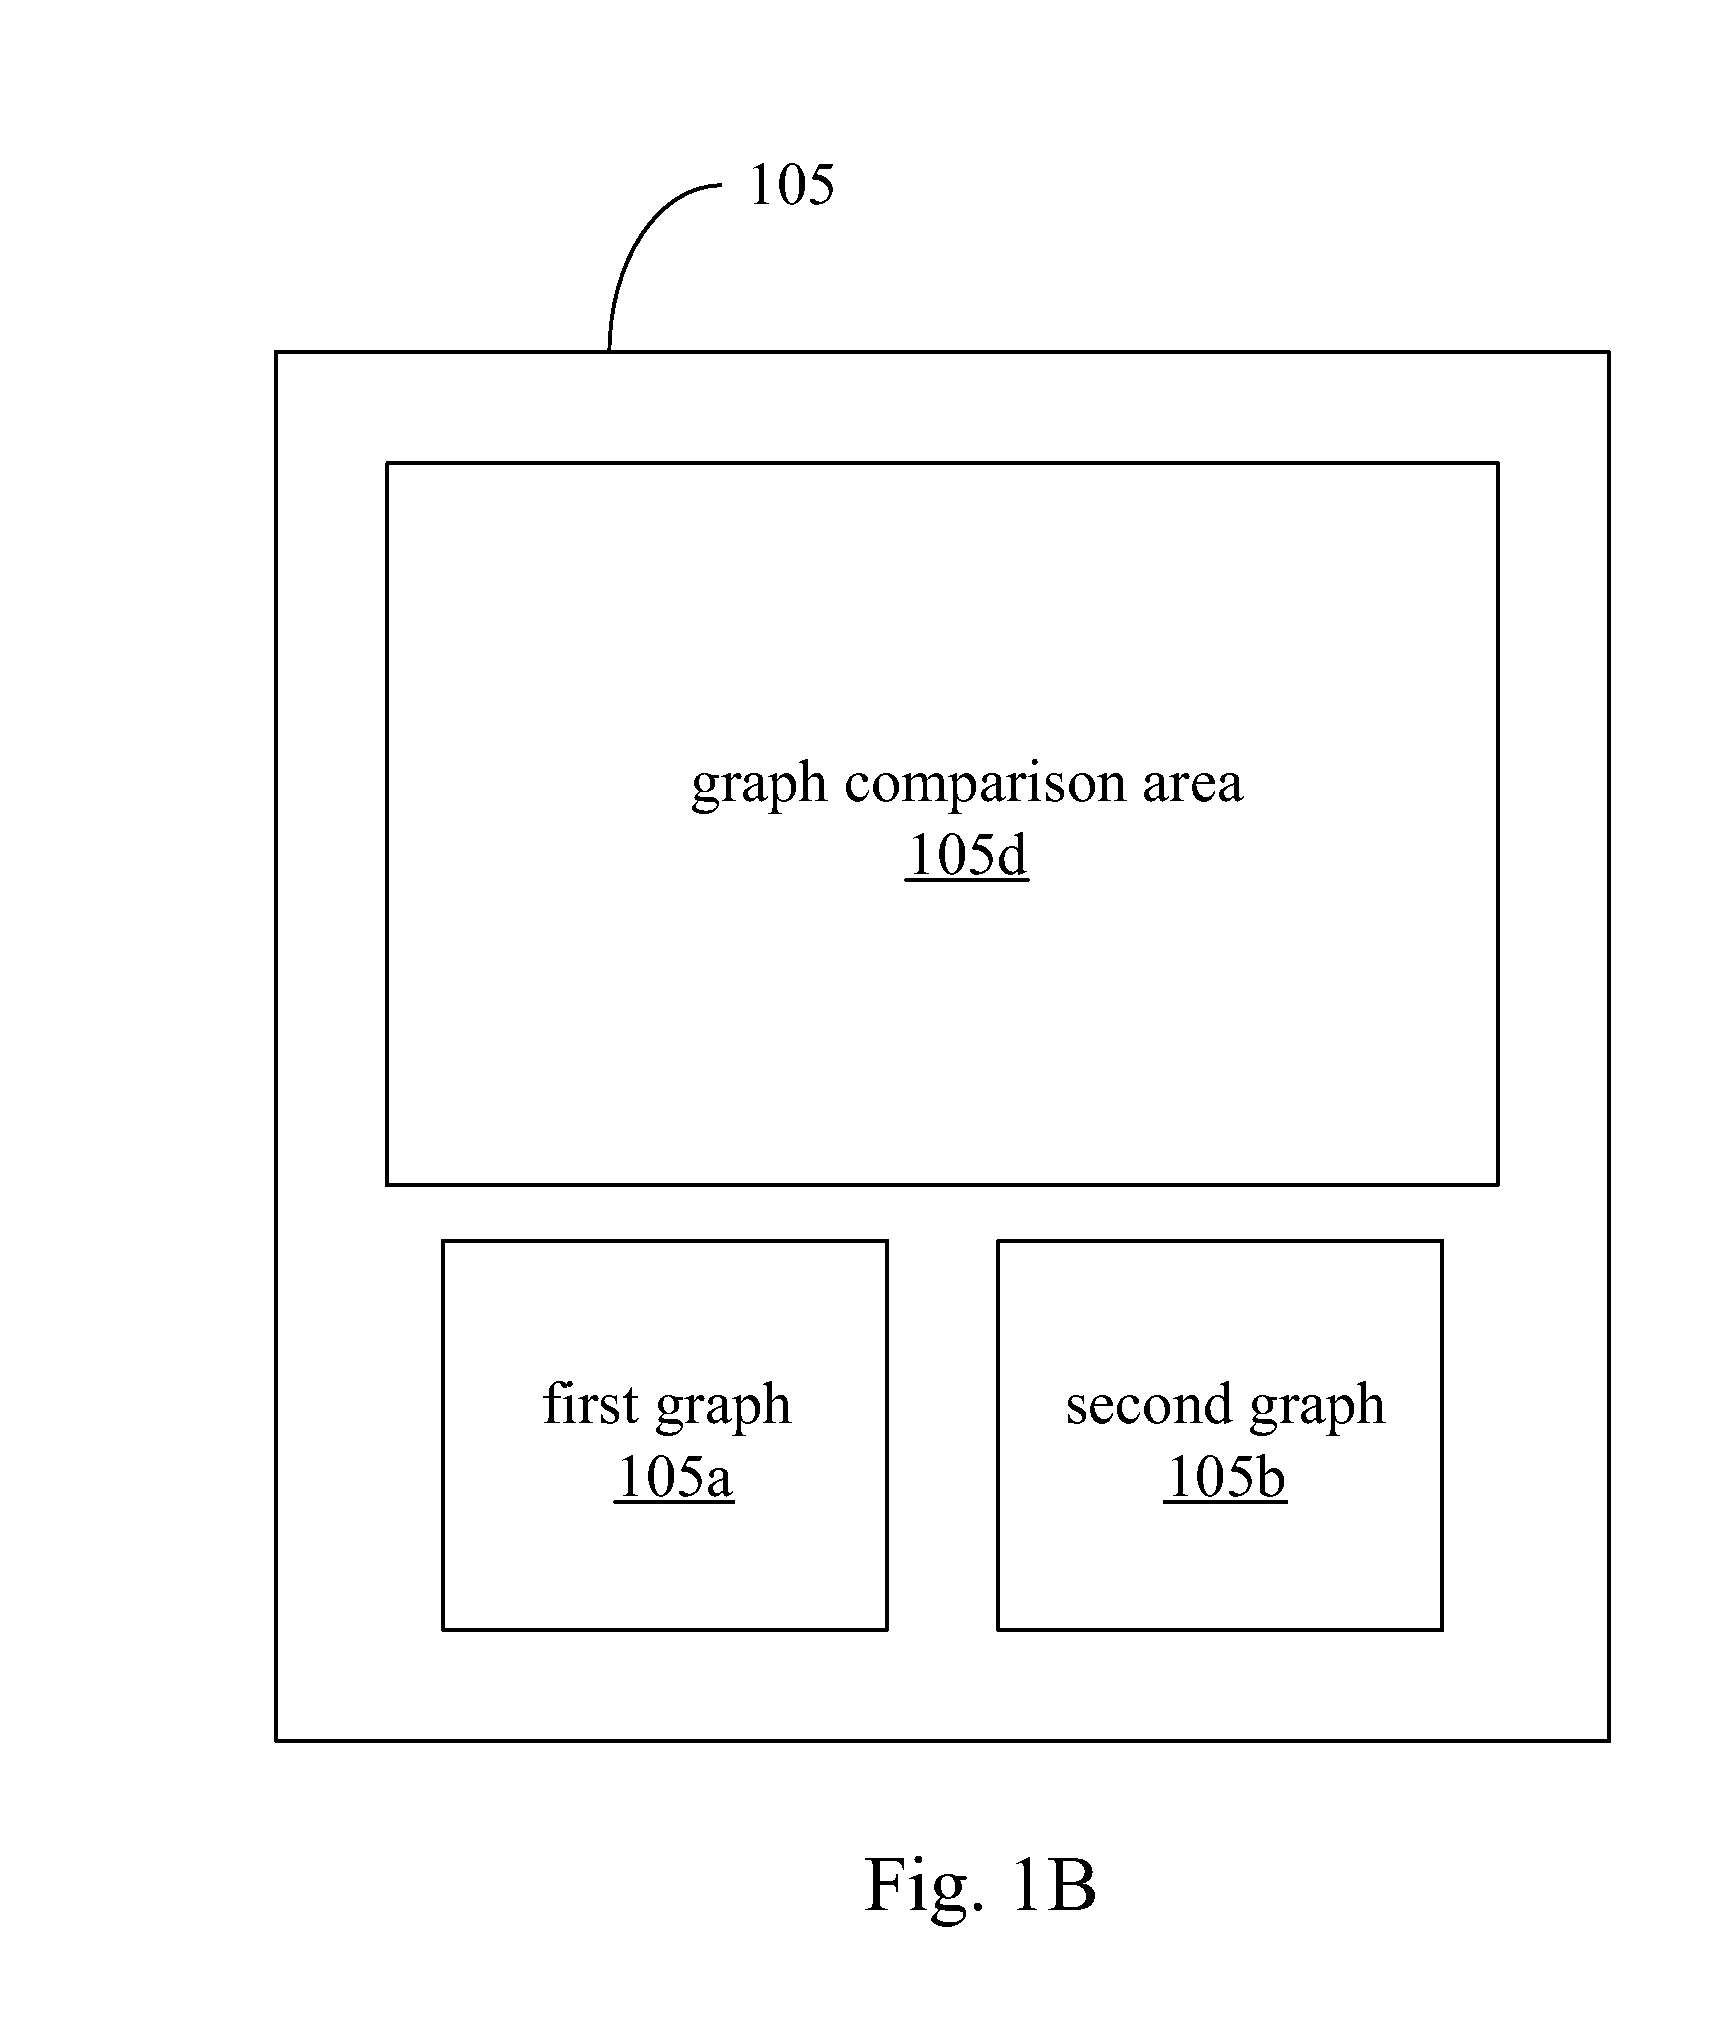
[0018]Reference will now be made in detail to embodiments of the present disclosure, examples of which are described herein and illustrated in the accompanying drawings. While the disclosure will be described in conjunction with embodiments, it will be understood that they are not intended to limit the disclosure to these embodiments. On the contrary, the disclosure is intended to cover alternatives, modifications and equivalents, which may be included within the spirit and scope of the disclosure as defined by the appended claims. In the following embodiments and the accompanying drawings, components which are not directly related to the disclosure are omitted for the sake of brevity. The size ratio between elements in the accompanying drawings is only used for understanding, and not meant to limit the actual embodiments of the present disclosure in scale. Wherever possible, the same reference numbers are used in the drawings and the description to refer to the same or like parts f...


PUM


Abstract

A graphical analysis system and a graphical analysis method are disclosed. The graphical analysis system includes a display device, a receiving module, and a control module. The display device is configured to display a first graph, a second graph, and a graph comparison area, in which the display device displays the first graph according to first data and displays the second graph according to second data. The receiving module is configured to receive a first and second input commands. The control module is configured to respond to the first and second input commands. When the first and second input commands are configured to drag and drop the first graph and the second graph into the graph comparison area respectively, the control module controls the display device to display a third graph and display the corresponding data of the first data and the second data in juxtaposition in the third graph.

Description

RELATED APPLICATIONS[0001]This application claims priority to Chinese Patent Application Serial Number 201310726085.7, filed Dec. 25, 2013, which is herein incorporated by reference.BACKGROUND[0002]1. Technical Field[0003]The present disclosure relates to a graphical analysis system and a graphical analysis method thereof. More particularly, the present disclosure relates to the graphical analysis system which is able to drag and drop graphs and the graphical analysis method thereof.[0004]2. Description of Related Art[0005]With the rapid development of electronic technology, users can use various graphical analysis tools to analyze data by showing the analyzed results in the graphs.[0006]Generally, existing graphical analysis tools provide effective techniques which can present a great quantity of data in the form of graphs, to allow users to easily organize data while burdens of analyzing a great quantity of data are reduced.[0007]However, although lots of functions are included in...

Claims


Application Information

Patent Timeline
Patent Type & Authority Applications(United States)
IPC IPC(8): G06T11/20G06F3/0486
CPCG06F3/0486G06T11/206
Inventor LU, YI-HSIN
Owner AU OPTRONICS CORP
Why Eureka
Try Eureka