Pie Chart Based Information Management System

a technology of information management system and pie chart, which is applied in the field of computer system, can solve the problems of cumbersome type of information in the current used database, difficulty in visualizing and manipulating, and errors in the analysis of information, and may take more time than desired

Active Publication Date: 2016-01-28
ADP
View PDF14 Cites 6 Cited by
  • Summary
  • Abstract
  • Description
  • Claims
  • Application Information

AI Technical Summary

Benefits of technology

[0010]An embodiment of the present disclosure provides a method for visually accessing information. The method displays, by a computer system, pie charts in a graphical user interface in a display system. The pie charts have sections that represent pieces of the information, and each of the pie charts represents a type of the information. The method receives, by the computer system, a user input selecting a portion of the sections from the pie charts displayed in the graphical user interface. The method also displays, by the

Problems solved by technology

However, this type of information in currently used databases may be cumbersome and difficult to visualize and manipulate.
As a result, errors may occur in the analysis of the information and more time than desired may be need

Method used


Image

  • Pie Chart Based Information Management System
  • Pie Chart Based Information Management System
  • Pie Chart Based Information Management System

Examples


Embodiment Construction

[0036]The illustrative embodiments recognize and take into account one or more different considerations. For example, the illustrative embodiments recognize and take into account that viewing, analyzing, combining or otherwise manipulating information may be more difficult than desired using database systems. The illustrative embodiments also recognize that spreadsheets also may not provide a desired level of ease in viewing, analyzing, combining or otherwise manipulating information. For example, when combining information by merging spreadsheets, importing text, or performing other operations with spreadsheets, visualizing, combining, or identifying what sources should be used may be more difficult than desired with spreadsheets.

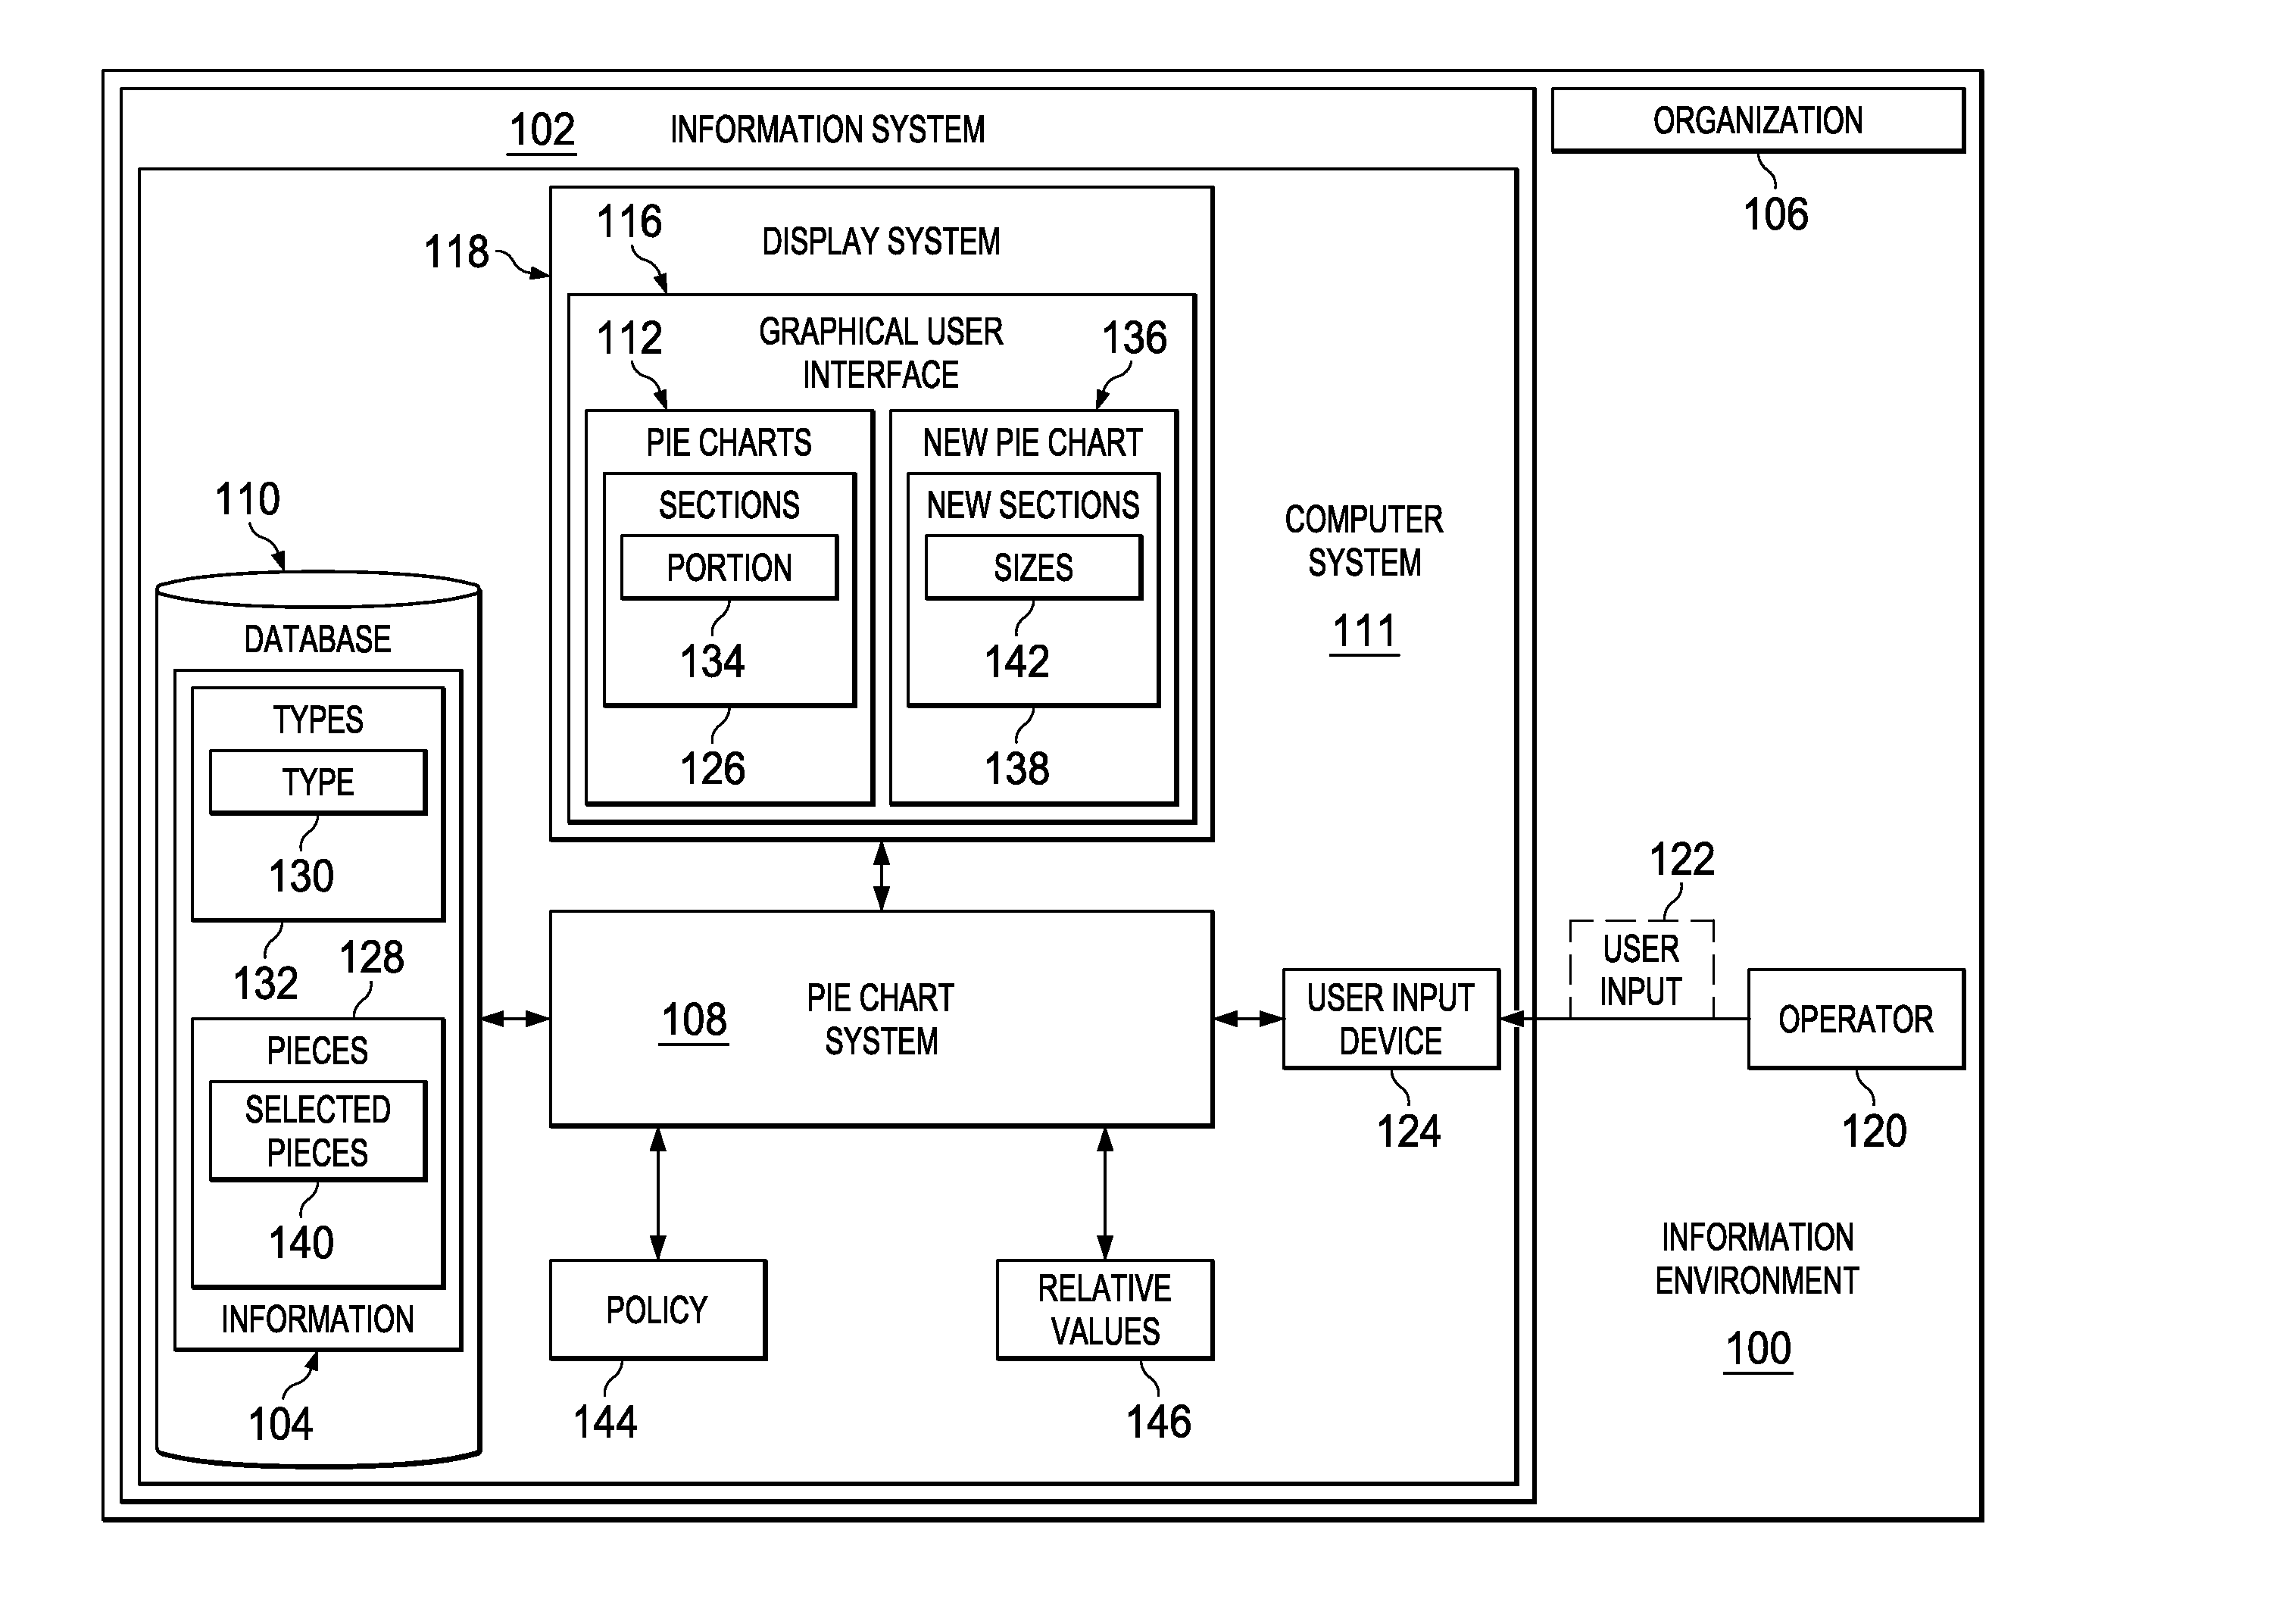
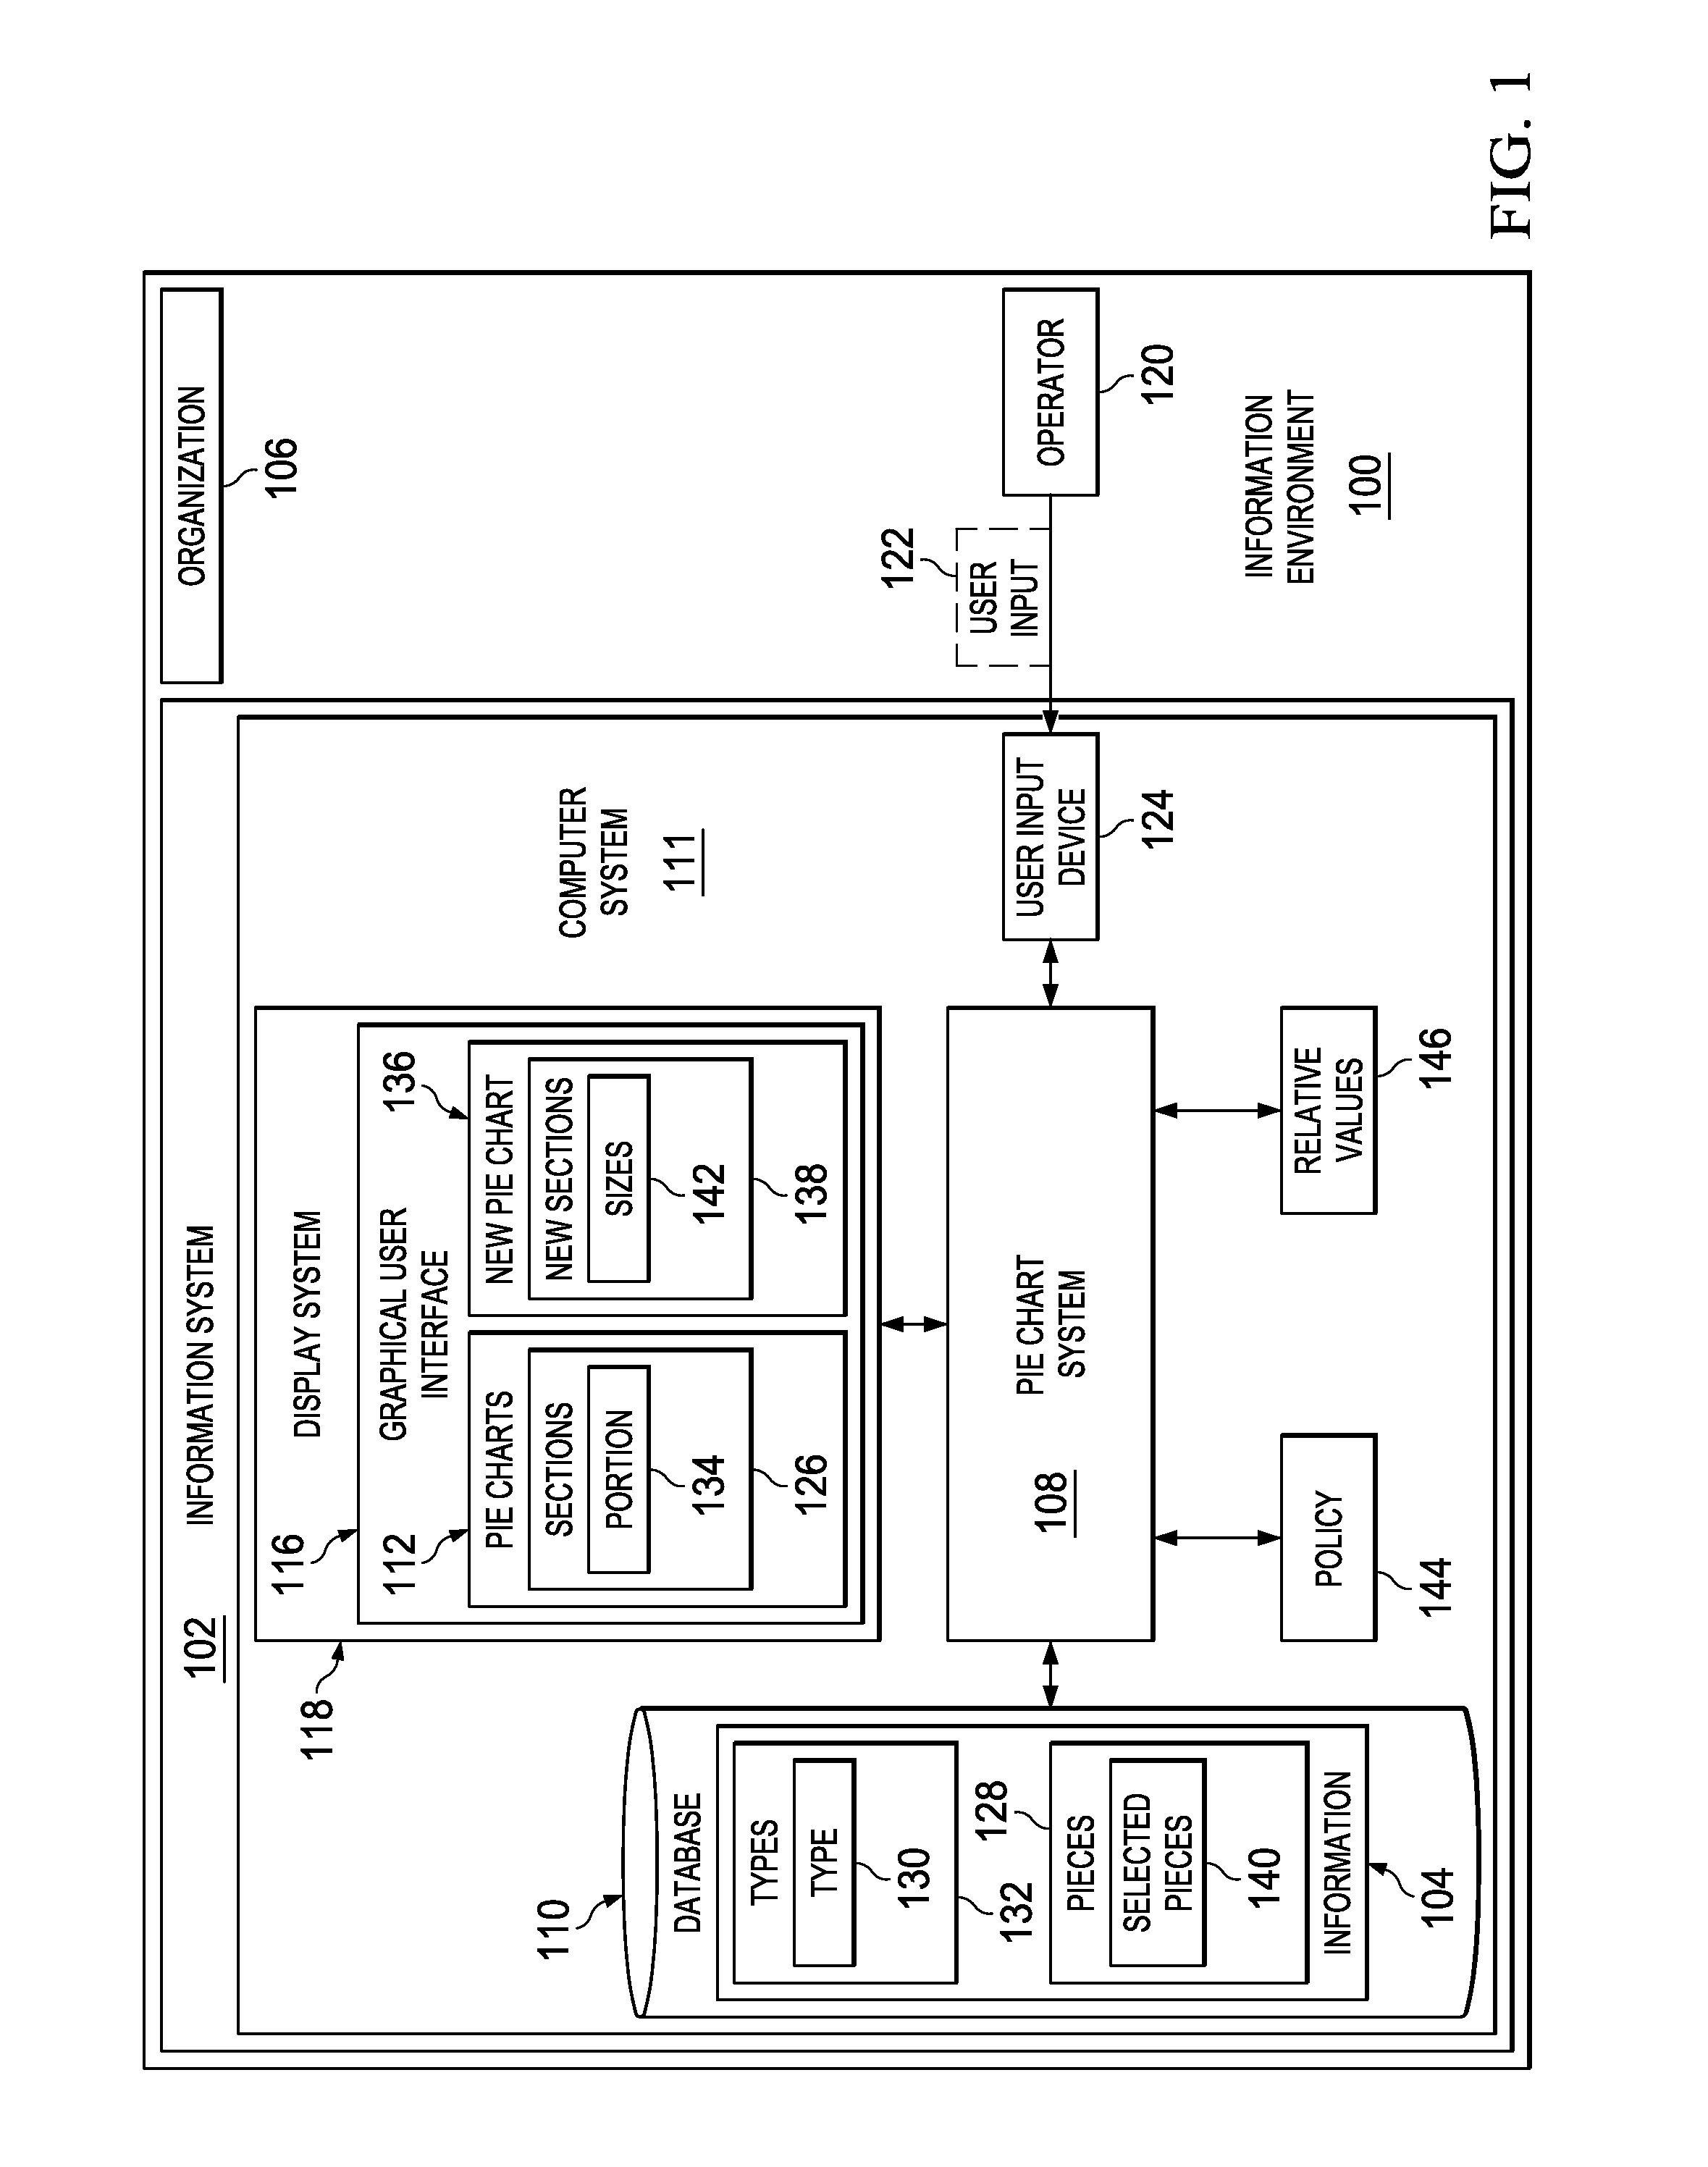
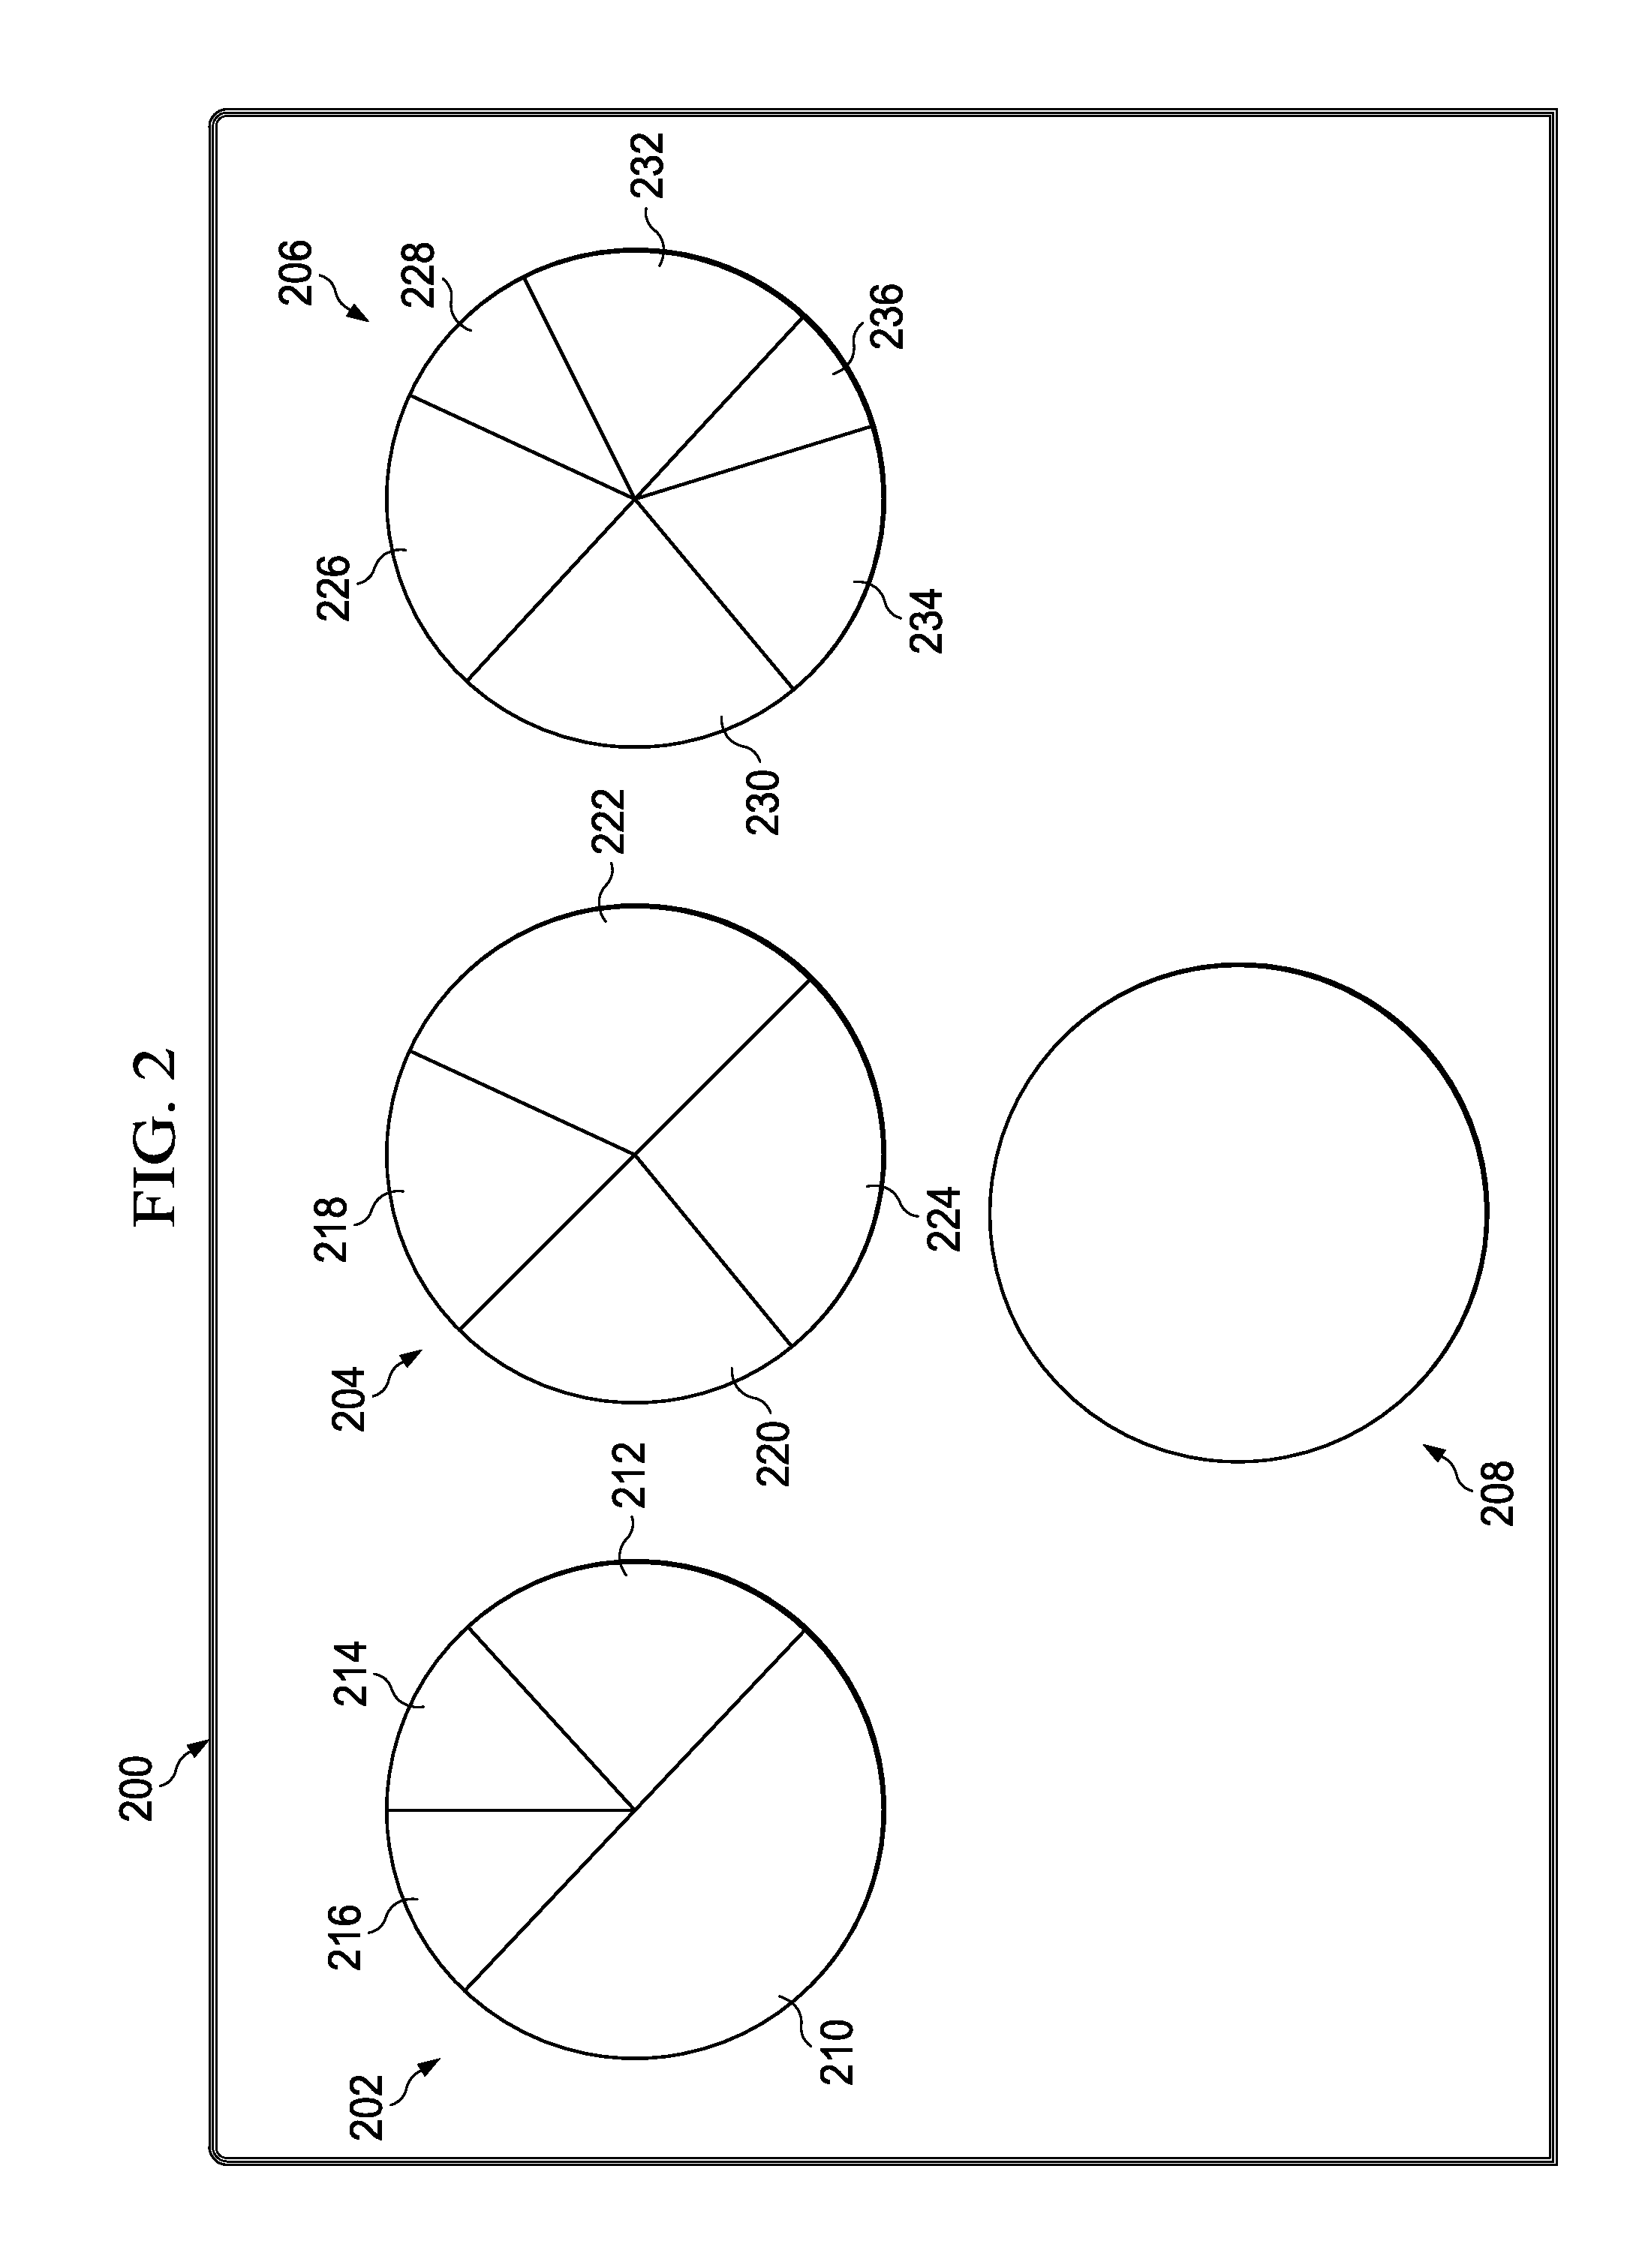
[0037]Thus, the illustrative embodiments provide a method and apparatus for visually accessing information. In one illustrative embodiment, a computer system displays pie charts in a graphical user interface in a display system. The pie charts have section...


PUM


Abstract

A method for visually accessing information. A computer system displays pie charts in a graphical user interface in a display system. The pie charts have sections that represent pieces of the information, and each of the pie charts represents a type of the information. The computer system receives a user input selecting a portion of the sections from the pie charts displayed in the graphical user interface. The computer system displays a new pie chart in the graphical user interface using the portion of the sections selected by the user input. The new pie chart has new sections representing selected pieces of the information corresponding to the portion of the sections. The new sections have sizes based on a policy, and the sizes for the new sections indicates relative values of the pieces of the information with respect to each other. The new pie chart enables visually accessing the information.

Description

RELATED PROVISIONAL APPLICATION[0001]This application claims the benefit of U.S. Provisional Patent Application Ser. No. 62 / 029,910, filed Jul. 28, 2014, and entitled “Dynamic User Interface.”BACKGROUND INFORMATION[0002]1. Field[0003]The present disclosure relates generally to an improved computer system, and in particular, to a method and apparatus for accessing information in a computer system. Still more particularly, the present disclosure relates to a method and apparatus for managing information in a computer system using pie charts.[0004]2. Background[0005]Information systems are used for many different purposes. For example, an information system may be used to process payroll to generate paychecks for employees in an organization. Additionally, an information system also may be used by a human resources department to maintain benefits and other records about employees. For example, a human resources department may manage health insurance, wellness plans, and other programs ...

Claims


Application Information

Patent Timeline
IPC IPC(8): G06T11/20G06T11/60G06V10/75
CPCG06T11/60G06T11/206G06Q10/06G06V10/75G06F18/22G06F40/166G06F40/106G06V40/172H04L67/535H04L67/306H04L67/1053
Inventor SCHIFFER, JORDANFULTON, KEITH WILSONKAVANAGH, GREGORY PETER
Owner ADP
Why Eureka
Try Eureka