Visualization suggestion application programming interface

Active Publication Date: 2016-03-24
BUSINESS OBJECTS SOFTWARE
View PDF2 Cites 7 Cited by
  • Summary
  • Abstract
  • Description
  • Claims
  • Application Information

AI Technical Summary

Problems solved by technology

A user who is not an expert in the relevant area of a report may be overwhelmed when it comes to discerning interesting relationships from the data of the reports.
For example, a user may access a large volume of data from airports at multiple locations and find it impossible to make any meaningful

Method used


Image

  • Visualization suggestion application programming interface
  • Visualization suggestion application programming interface
  • Visualization suggestion application programming interface

Examples


example statistical

Analysis and Ranking

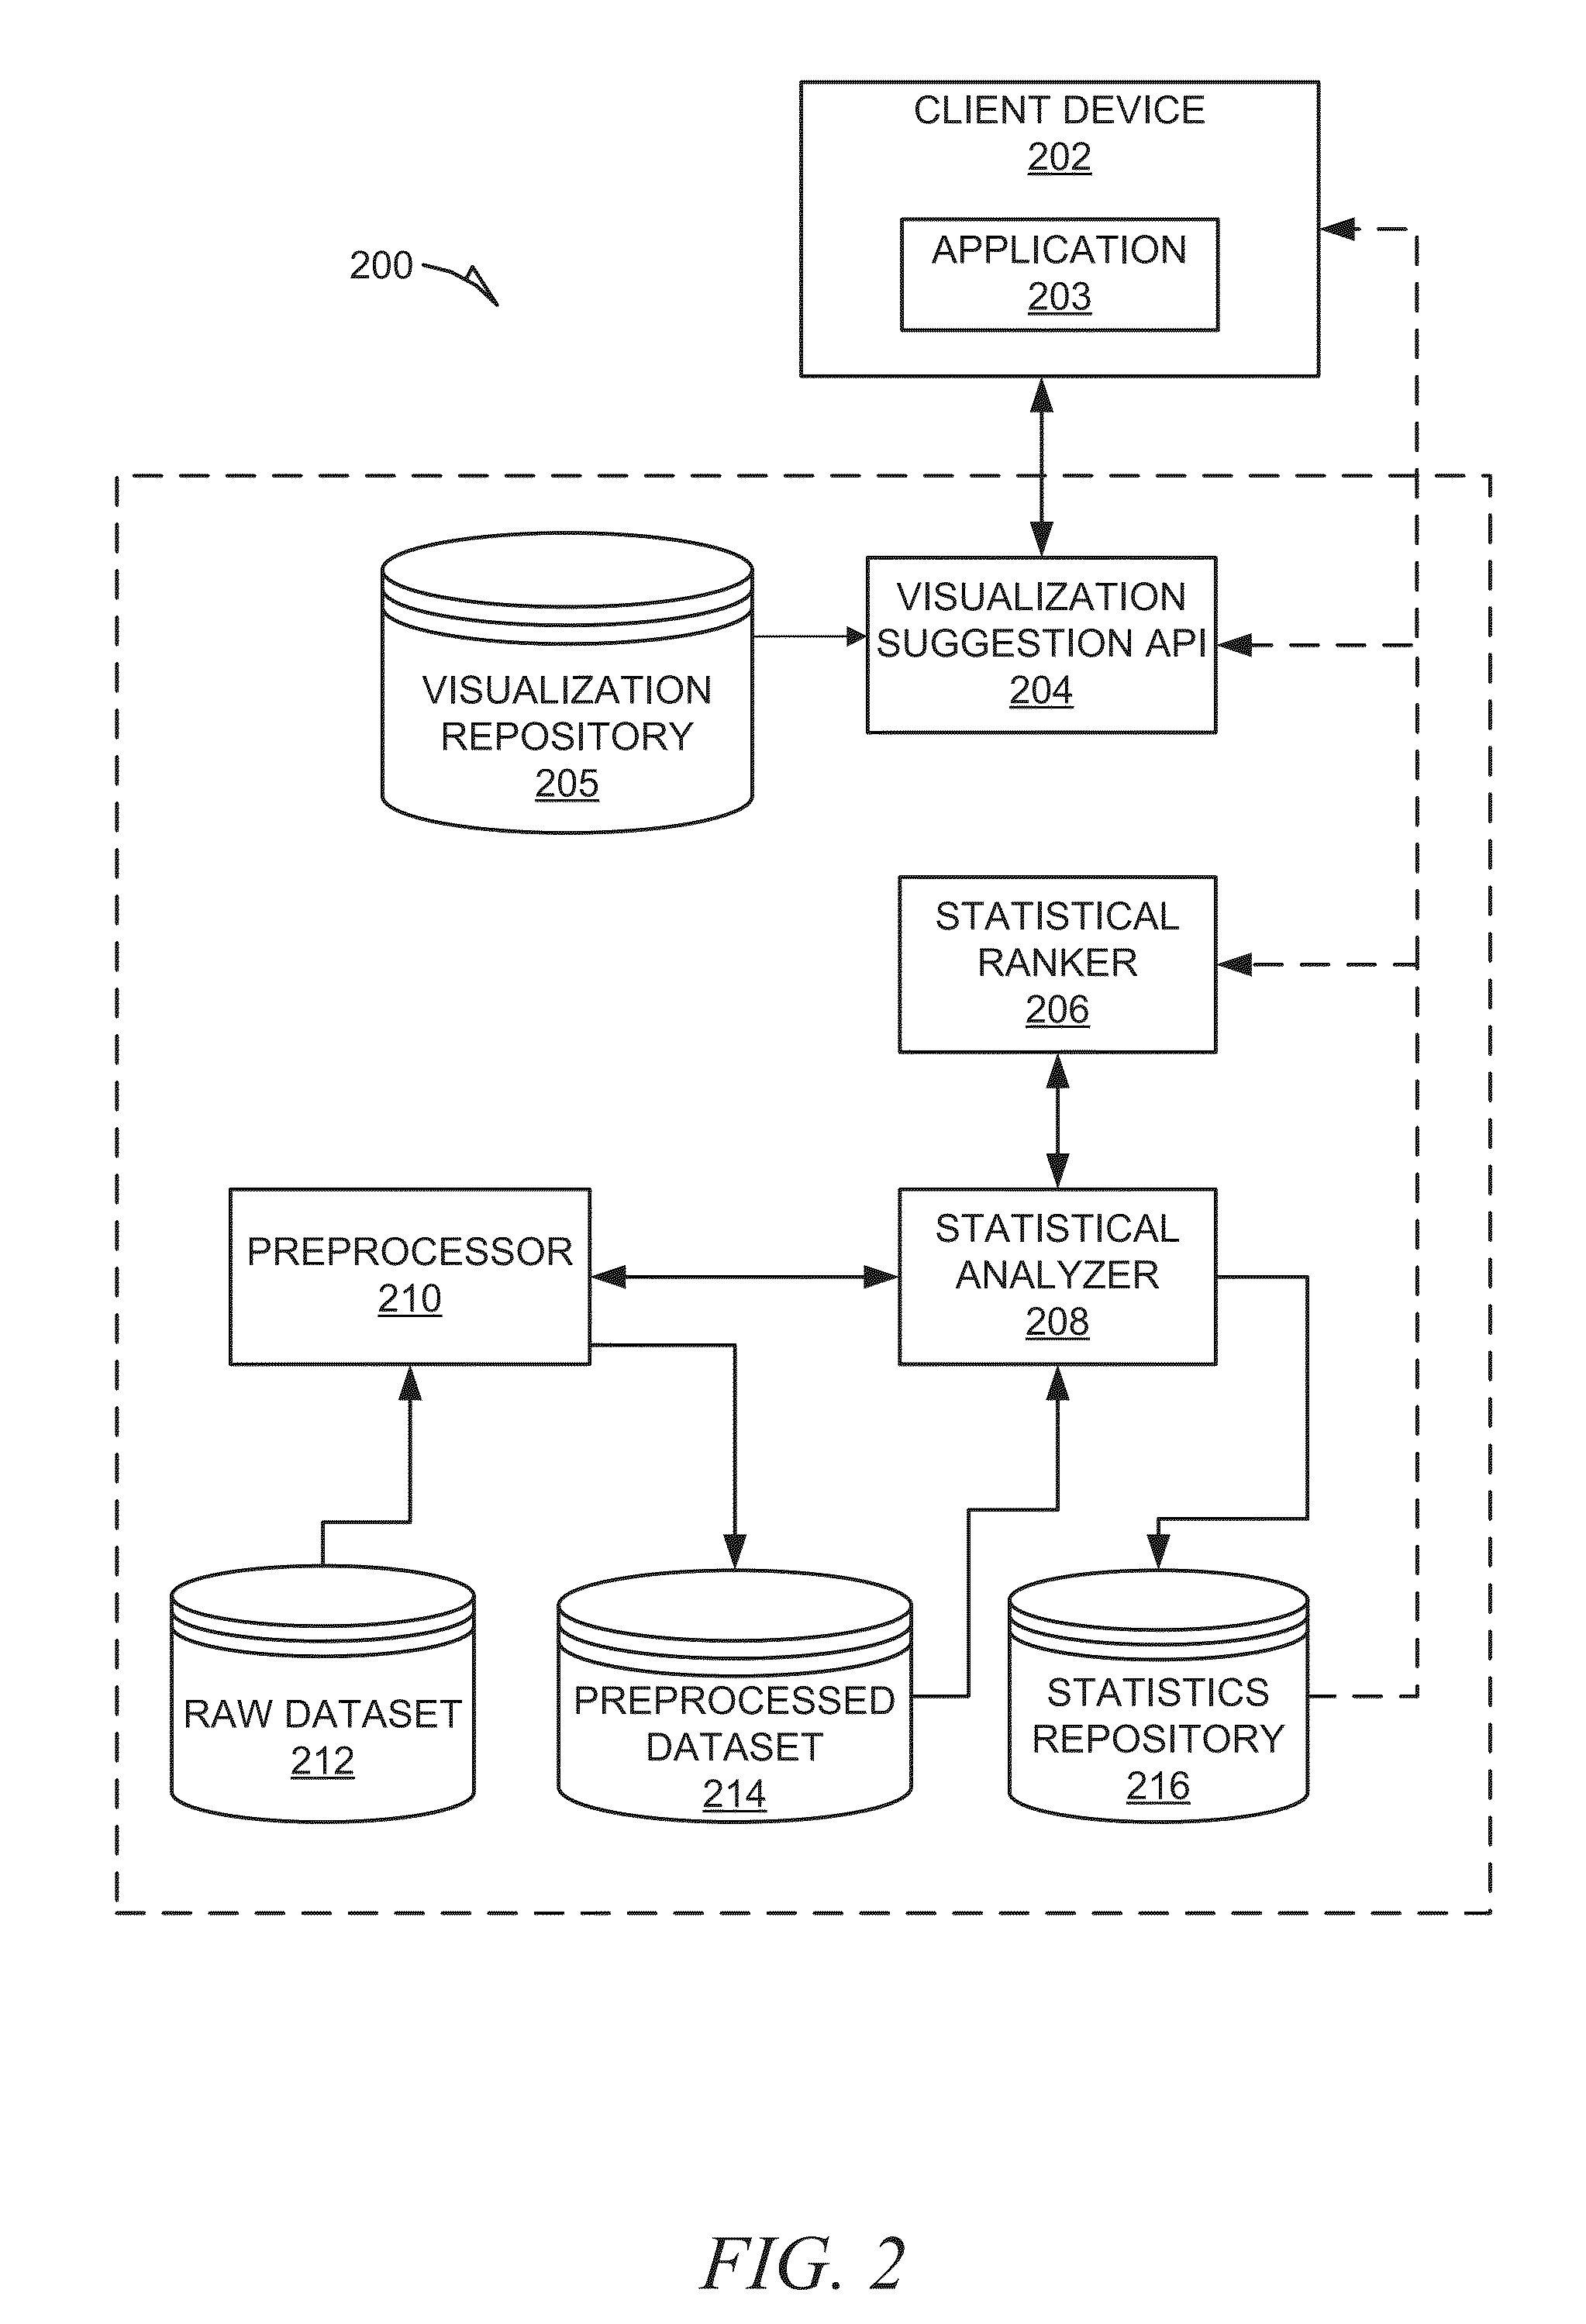
[0080]In an example, and as mentioned above, the number of user selected columns in relation to which the statistical analyzer 208 may evaluate the remaining unselected columns may be restricted to a specified threshold number of columns. The selection of columns may be from a preprocessed dataset 214 which includes OLAP data. Since the values of measures may be calculated accurately based on the aggregated data, as mentioned above with respect to data modeling and aggregation, the statistical analyzer 208 does not require access to the original raw dataset 212. This may reduce the runtime since the amount of data being analyzed may be much less than the amount of data in the original raw dataset 212.

[0081]In an example, the output of the statistical analyzer 208 may be a score for each column, or the score may be generated by statistical ranker 206 based on the results of a statistical analysis provided by the statistical analyzer 208. In example embodiments, di...


PUM


Abstract

A dataset and some user selected columns of the dataset are received by a statistical analysis module for analysis. The statistical analysis module generates a score for each unselected column of the dataset based on statistical analysis of the unselected columns and all or a subset of the selected columns. A ranking of the unselected columns is presented to the user for selection of one additional column of the dataset, after which the remaining unselected columns are re-ranked according to their associated scores and once again displayed to the user. The user may continue selecting from among the ranked columns until a threshold number of columns has been selected, at which point the user may deselect a selected column in order to continue selecting additional columns. A visualization suggestion application program interface then matches the selected columns with compatible visualization configurations and presents some of these visualizations to the user.

Description

TECHNICAL FIELD[0001]This document relates generally to data analysis and visualization, and more particularly, but not by way of limitation, to systems and methods for automatically identifying columns of a dataset that are used to produce insightful visualizations for a user who may have limited (e.g., little or no) experience with the particular dataset.BACKGROUND[0002]In a typical business environment a user may be presented with reports including data relating to subjects or fields that the user may not be familiar with. A user who is not an expert in the relevant area of a report may be overwhelmed when it comes to discerning interesting relationships from the data of the reports. Furthermore, the user may desire an “insightful” visualization of the report data, for example a visualization that presents the subsets of data that exhibit a non-random and / or non-intuitive structure to the user in a form that is clear and visually appealing.BRIEF DESCRIPTION OF THE DRAWINGS[0003]S...

Claims


Application Information

Patent Timeline
IPC IPC(8): G06F17/30
CPCG06F17/30572G06F17/30592G06F17/30601G06F17/30315G06F17/30563G06F16/26G06F16/221G06F16/248G06F16/254G06F16/283G06F16/287
Inventor WONG, JOHNSONMOSER, FLAVIAKUMAR, VIREN
Owner BUSINESS OBJECTS SOFTWARE
Why Eureka
Try Eureka