Travel demand inference for public transportation simulation

a technology of public transportation and transportation demand, applied in the field of trip simulation in a transportation network, can solve the problems of unveiled limitations in accurately simulating transit trips, difficult to track passengers during transfers, and existing approaches that generate important divergence from observed results

Inactive Publication Date: 2017-11-16
CONDUENT BUSINESS SERVICES LLC
View PDF3 Cites 7 Cited by
  • Summary
  • Abstract
  • Description
  • Claims
  • Application Information

AI Technical Summary

Problems solved by technology

One problem with the existing approach is that it aggregates too much sample ODT data, in part for a set of short trips, thus unveiling certain limitations in accurately simulating the transit trips.
For example, in an entry-only ticket validation operation, it can be difficult to track passengers during tra

Method used


Image

  • Travel demand inference for public transportation simulation
  • Travel demand inference for public transportation simulation
  • Travel demand inference for public transportation simulation

Examples


example 1

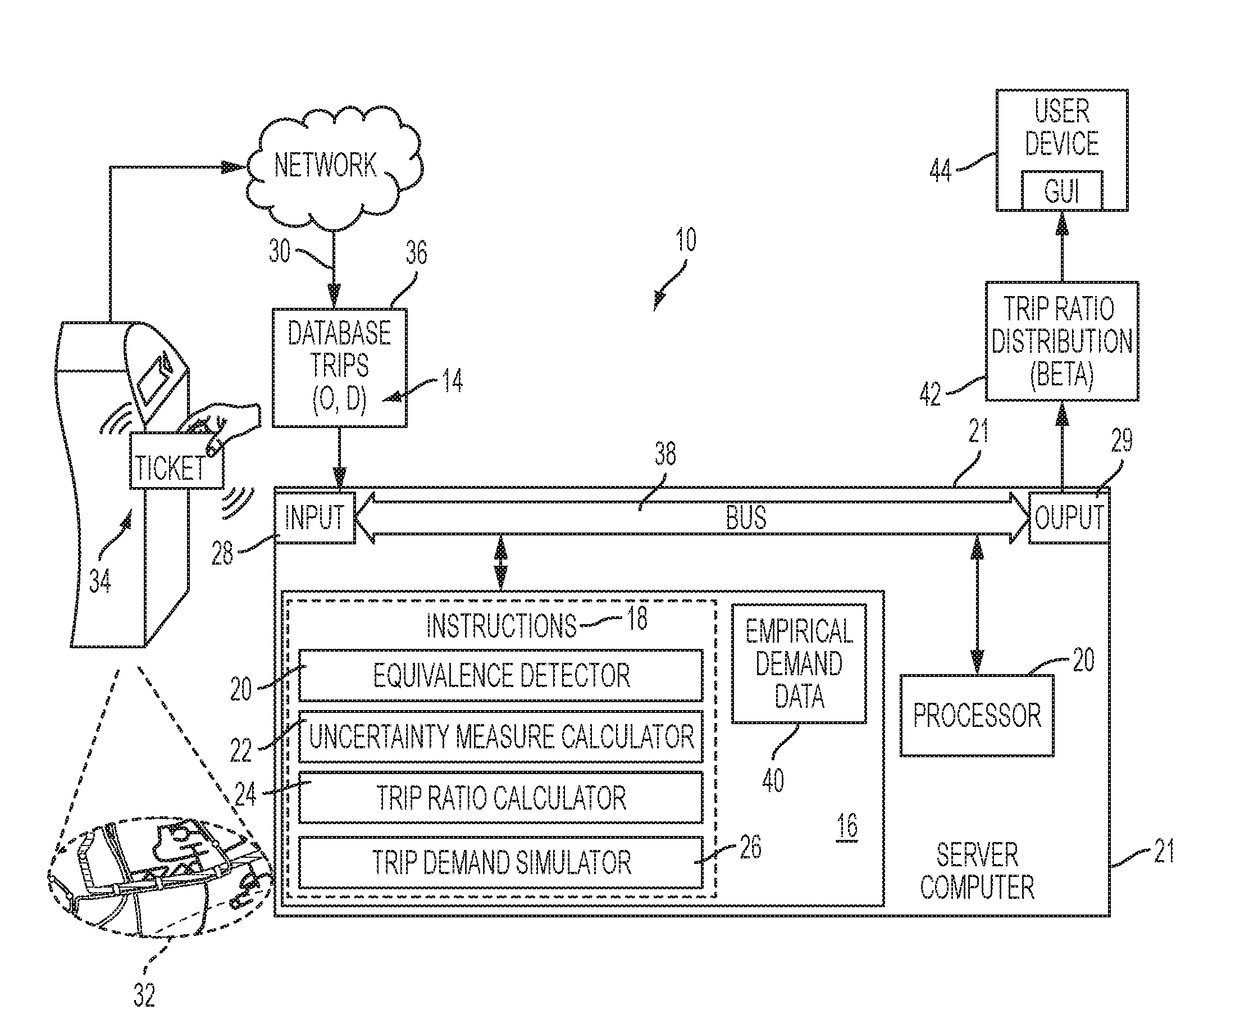
[0082]The disclosed method was tested on seven individual transit (o,d) pairs in a transporation network dataset. FIG. 11 shows an empirical trip angle distribution (top row) and a Beta distribution (bottom row) for the example dataset. Specifically, the

[0083]FIG. 9 shows (upper row) the empirical angle ratio distribution for seven different (o, d) pairs in Nancy dataset. Once they were used to fit the Beta distribution, the low row shows the PDF (probability distribution functions) with the corresponding (αi, βi) parameters.

[0084]Regarding the temporal modality, multiple transit trips exposed unexpectedly long transit times between public transportation services. These trips were likely multi-goal that cannot be properly modeled by a conventional trip planner. The temporal modality xte of a trip was introduced and parametrized as a Beta distribution. Any transfer during a trip was treated as a function of the distance between the stops, walking speed, vehicle (such as, bus) arrival...

example 2

[0085]The disclosed method was tested on dataset including 224,000 trips collected from a transporation network during a period of 3 months in 2012. The public transport system offered 27 bus and tram schedule-based services running along 89 different routes, and accounting for a total of 1129 stops. For the purpose of the example, only the datasets collected on workdays was evaluated. Trip data collected on holidays (vacation) and weekends was excluded.

[0086]The uncertainty measure was used to test different methods on the capacity to model the travel demand in the urban mobility context. Table 1 reports uncertainty measures when testing different combinations of methods described in the previous sections:

TABLE 1Uncertainty values for diff methods.MethodMinMaxAverageRaw0.984.612.39SE0.974.341.97SE + SBeta0.974.031.78SE + TBeta0.974.341.95SE + SBeta + TBeta0.974.001.72

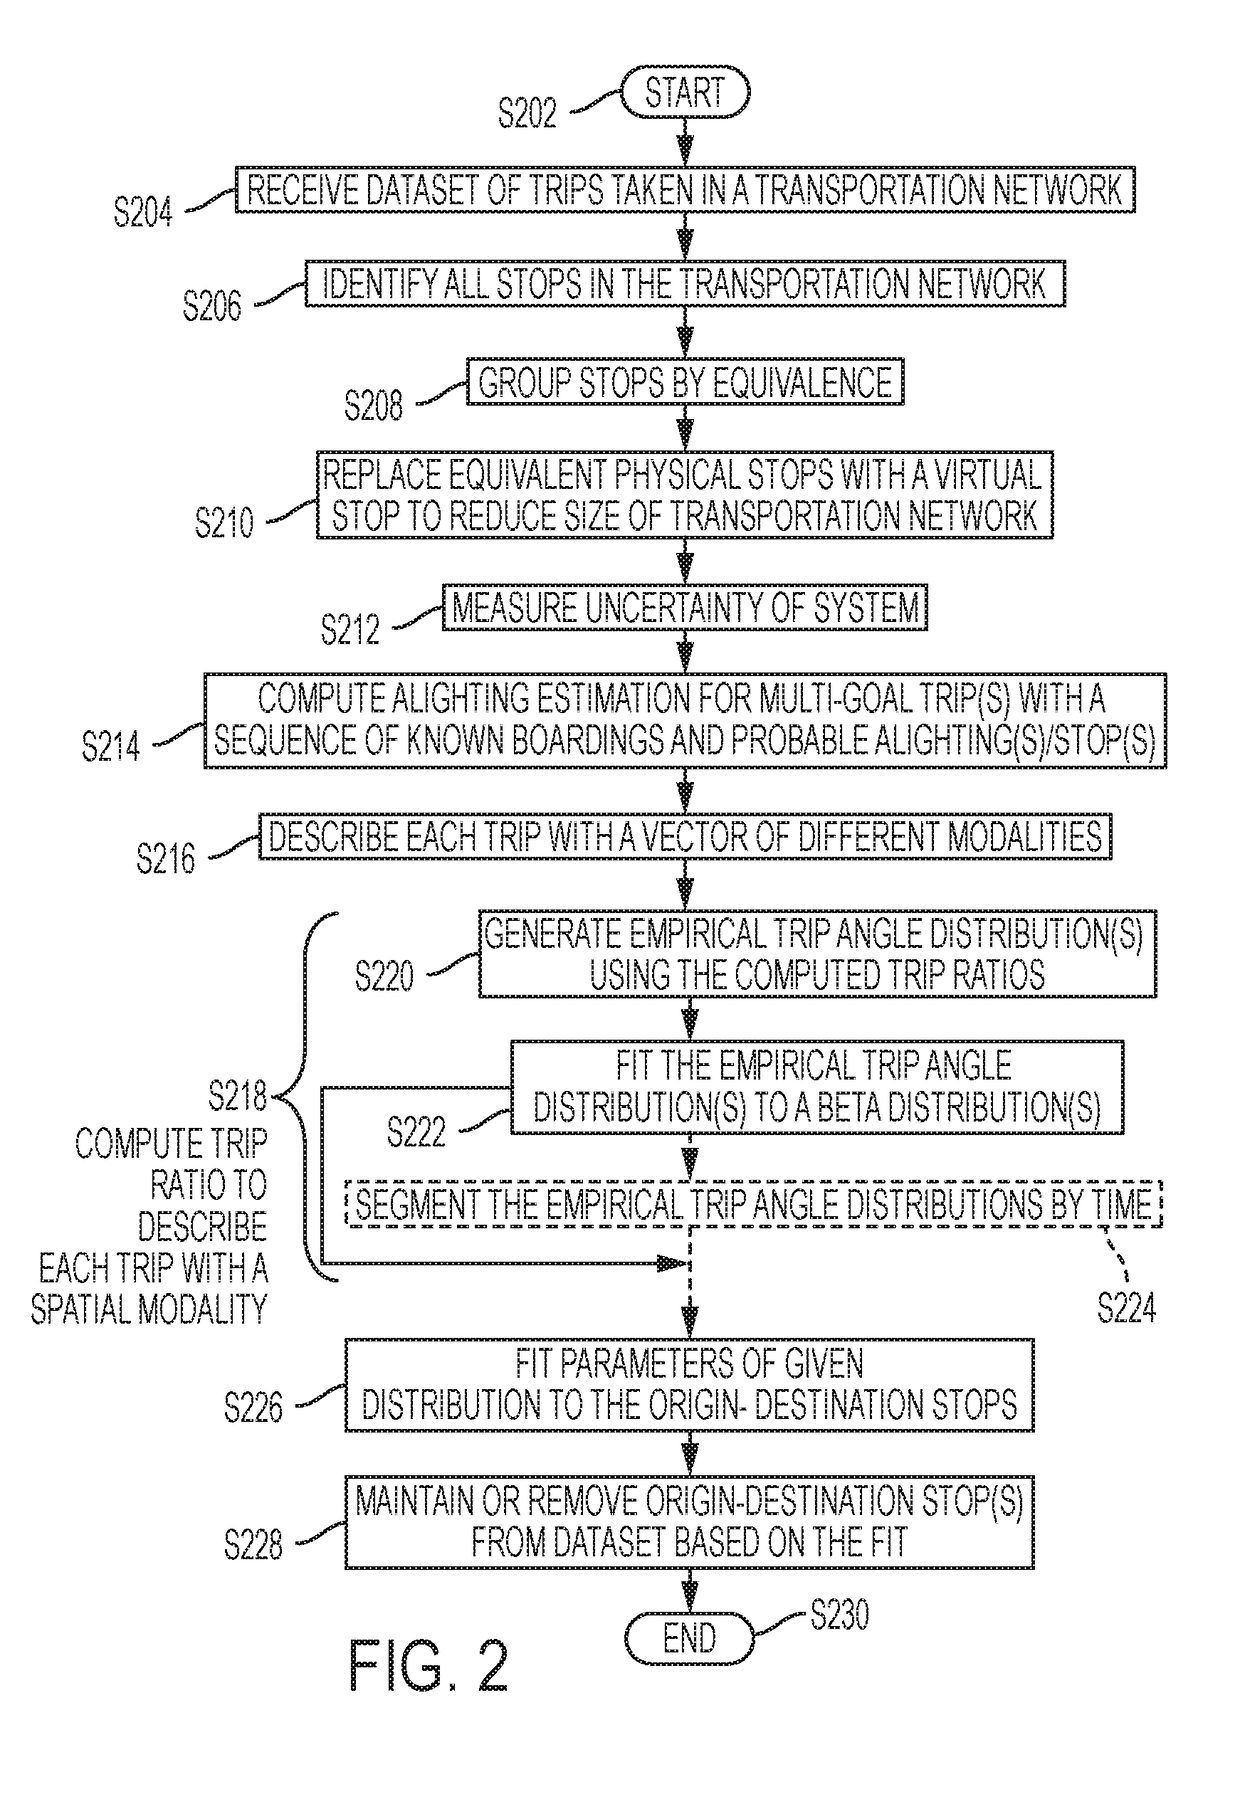
wherein “Raw” means that raw data was used; “SE” means that stop equivalence classes were used to reduce the network...


PUM


Abstract

A method for estimating travel demand in a transportation network includes receiving a dataset of trips. The trips were taken in the transportation network and are each represented by an origin-destination pair and a departure time. A trip can include a sequence of legs. Each trip is described by a vector of modalities. For trips that include the sequence of legs, boarding and alighting stops are estimated. An empirical trip distribution is generated for each modality for given origin-destination stops. The empirical trip distribution is fitted to a specific family of probability distributions. At least one of the generating the empirical trip distribution for a given modality and the fitting the empirical trip distribution to the probability distributions is performed with a processor.

Description

BACKGROUND[0001]The present disclosure relates to trip simulation in a transportation network. The disclosure finds application in public transportation systems, particularly regarding the simulation of passenger behavior to estimate demand, but it is also amenable to other modes of transport.[0002]A public transportation network is defined by, inter alia, specified modes of transportation (bus, rapids, and ferries, etc.), stop locations, routes that serve the stops, change points, and route schedules. Passenger behavior can be observed by transactions, such as, for example, ticket-based trips where passengers swipe or scan a fare card upon entering or exiting a vehicle.[0003]This information can be collected by the public transportation system to build a dataset used to create a simulation of the public transportation network. The simulation of public transportation systems plays an important role in urban transportation management and planning. The main goal of any public transpor...

Claims


Application Information

Patent Timeline
IPC IPC(8): G06Q10/02G01C21/26G06Q30/02G06Q50/30
CPCG06Q10/025G06Q30/0202G01C21/26G06Q50/30
Inventor CHIDLOVSKII, BORIS
Owner CONDUENT BUSINESS SERVICES LLC
Why Eureka
Try Eureka