Method and system for microseismic event location error analysis and display

a microseismic event and location error technology, applied in the field of microseismic monitoring, can solve the problems of not being able to determine, not easily applied to real-world scenarios, and their limits of applicability, and achieve the effect of reducing transparency and high varian

Active Publication Date: 2021-12-16
SEISMIC INNOVATIONS
View PDF10 Cites 0 Cited by
  • Summary
  • Abstract
  • Description
  • Claims
  • Application Information

AI Technical Summary

Benefits of technology

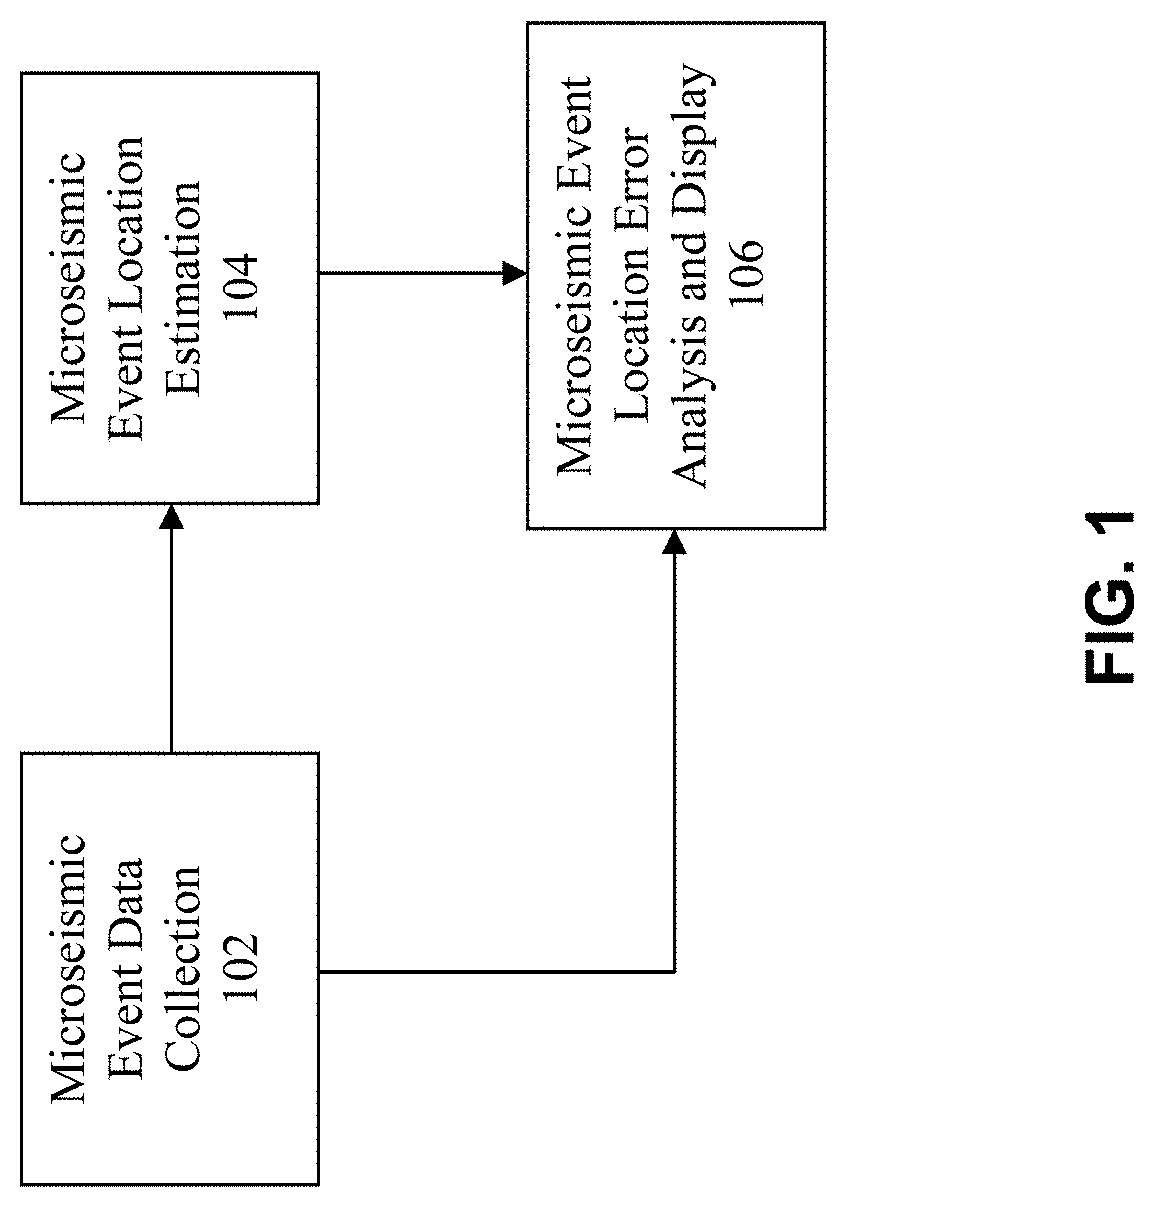
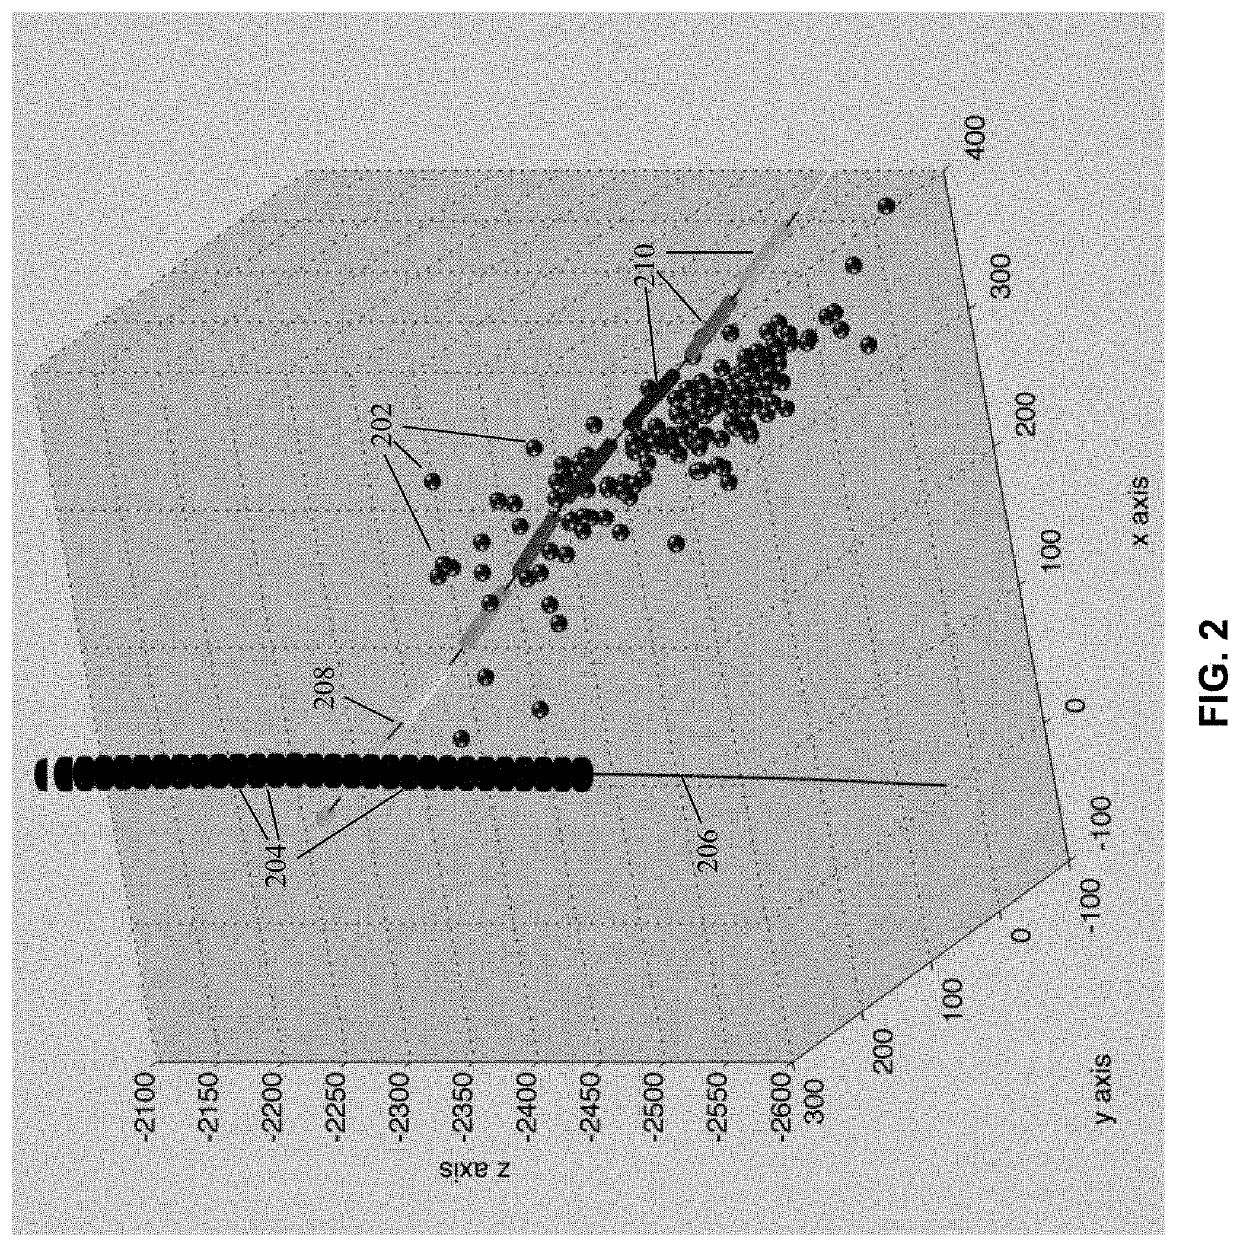
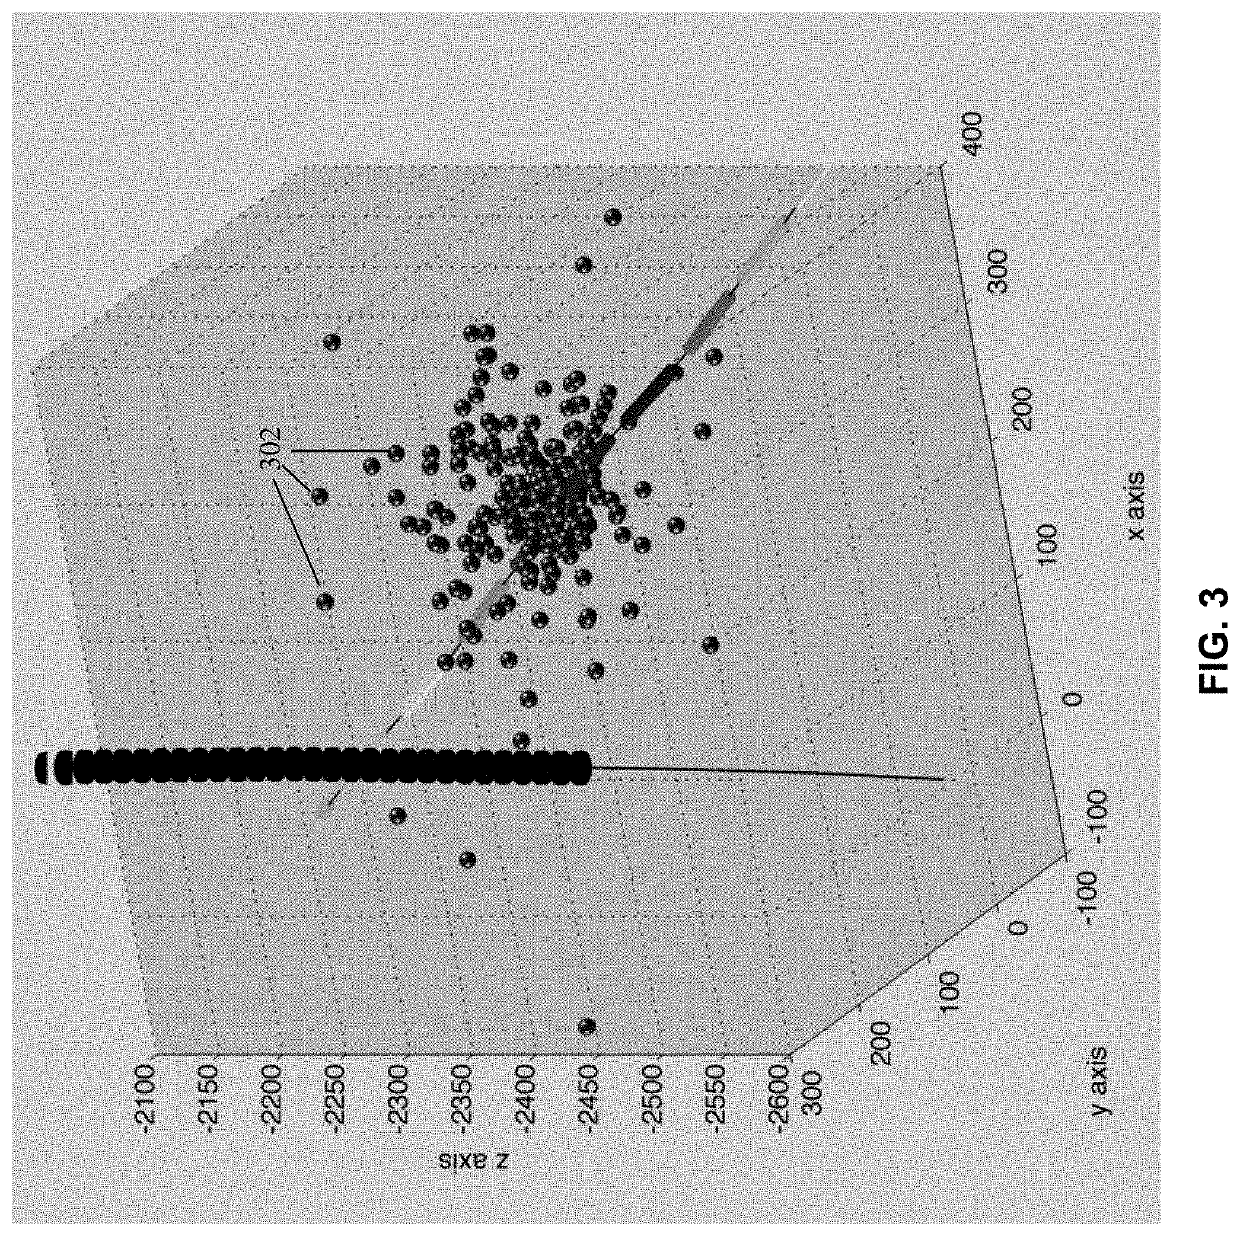
[0028]In another embodiment, a region in space is divided into voxels, each preferably no larger than the greatest event localization accuracy, and the probability that each voxel in the region contains an event, the probability volume, is computed. Each voxel is then displayed using characteristics (e.g., color, intensity, transparency) that reflect the computed probability. In this way, an estimate with high variance will slightly darken a range of voxels in the region, whereas an accurately localized event will noticeably darken just a few voxels. In another embodiment, the intermediate step of computing the probability volume is skipped, and each event is in turn used to modify the properties of a set of voxels in the neighborhood of the estimated event location. In a preferred embodiment, the region would be an ellipsoid, sized according to the estimate variance, and the modification each event would affect would be a nonlinear decrease in the transparency according to the estimate variance.

Problems solved by technology

Inaccuracies in location estimates result from seismic background energy and uncertainties in seismic wave propagation, and are related to the array and fracture geometry.
While some rules of thumb have been developed using this approach, they are not easily applied to real-world scenarios, and their limits of applicability are not known.
Without having a known mathematical relationship between the scenario geometry and signal characteristics and the localization error, it may not be possible to determine whether a characteristic of the collection of event locations results from measurement error or is important to the interpretation of the treatment.
A difficulty with this approach has to do with the handling of estimated locations that appear to be outliers and the choice of the subset of localized events that is to define this convex hull: the stimulated volume estimate should be extended to include positions of accurately localized outlying events, but should not be extended in the case of poorly localized outlying events.
One problem with this approach is that the greater the event energy, the more accurately the event may be localized—it has greater amplitude, and its features more visible above the seismic background.
As a result, it is misleading to plot energetic events with markers that span larger volumes.
In addition, the event spheres are opaque, and it is not possible to understand the density of events within a given volume if there are more than a few events present.
One issue that arises is how to correlate the discrete locations of the events with the continuous data, especially if the event positions are known with varying accuracy.

Method used


Image

  • Method and system for microseismic event location error analysis and display
  • Method and system for microseismic event location error analysis and display
  • Method and system for microseismic event location error analysis and display

Examples


Embodiment Construction

[0054]The present invention will now be described in detail with reference to the drawings, which are provided as illustrative examples of the invention so as to enable those skilled in the art to practice the invention. Notably, the figures and examples below are not meant to limit the scope of the present invention to a single embodiment, but other embodiments are possible by way of interchange of some or all of the described or illustrated elements. Moreover, where certain elements of the present invention can be partially or fully implemented using known components, only those portions of such known components that are necessary for an understanding of the present invention will be described, and detailed descriptions of other portions of such known components will be omitted so as not to obscure the invention. Embodiments described as being implemented in software should not be limited thereto, but can include embodiments implemented in hardware, or combinations of software and...


PUM


Abstract

According certain aspects, embodiments of the invention consider the problem of microseismic event localization from a parameter estimation perspective, and include a method and system for computing and displaying characteristics of event localization errors. According to certain other aspects, embodiments of the invention include techniques for deriving aggregate statistics from a set of event location estimates, including methods for computing and displaying the probability that an event occurred in any given volume, and methods for describing and displaying the smallest volume that contains a specified percentage of the event probability or expected to contain the specified percentage of the events.

Description

CROSS-REFERENCE TO RELATED APPLICATIONS[0001]The present application is a continuation of U.S. application Ser. No. 14 / 340,356 filed Jul. 24, 2014, which application claims priority to PCT / US2013 / 022950, filed Jan. 24, 2013, which application claims priority to U.S. Prov. Appin. No. 61 / 590,189 filed Jan. 24, 2012, and which application is also a continuation-in-part of U.S. application Ser. No. 13 / 598,580, filed Aug. 29, 2012, which application claims priority to U.S. Prov. Appin. No. 61 / 528,730, filed Aug. 29, 2011. The contents of all of the above applications are incorporated herein by reference in their entireties.FIELD OF THE INVENTION[0002]The present invention relates generally to seismic monitoring and more particularly to a system and method for location error analysis and the display of information regarding microseismic events associated with a monitored volume.BACKGROUND OF THE INVENTION[0003]Passive localization of microseismic events is commonly used to monitor resourc...

Claims


Application Information

Patent Timeline
Patent Type & Authority Applications(United States)
IPC IPC(8): G01V1/34G01V1/28
CPCG01V1/345G01V2210/123G01V2210/74G01V1/288G01V2210/65
Inventor ABEL, JONATHAN S.COFFIN, SEAN A.HUR, YOOMIYEH, YOO HSIU
Owner SEISMIC INNOVATIONS
Why Eureka
Try Eureka