Interactive business data visualization system

a business data and visualization system technology, applied in television systems, multi-programming arrangements, instruments, etc., can solve the problems of large amounts of warehoused or otherwise collected business data that are useless without software tools for their analysis

Inactive Publication Date: 2006-02-07
DAEDALUS BLUE LLC
View PDF2 Cites 287 Cited by
  • Summary
  • Abstract
  • Description
  • Claims
  • Application Information

AI Technical Summary

Problems solved by technology

The vast amounts of warehoused or otherwise collected business data would be useless without software tools for its analysis.

Method used


Image

  • Interactive business data visualization system
  • Interactive business data visualization system
  • Interactive business data visualization system

Examples


Embodiment Construction

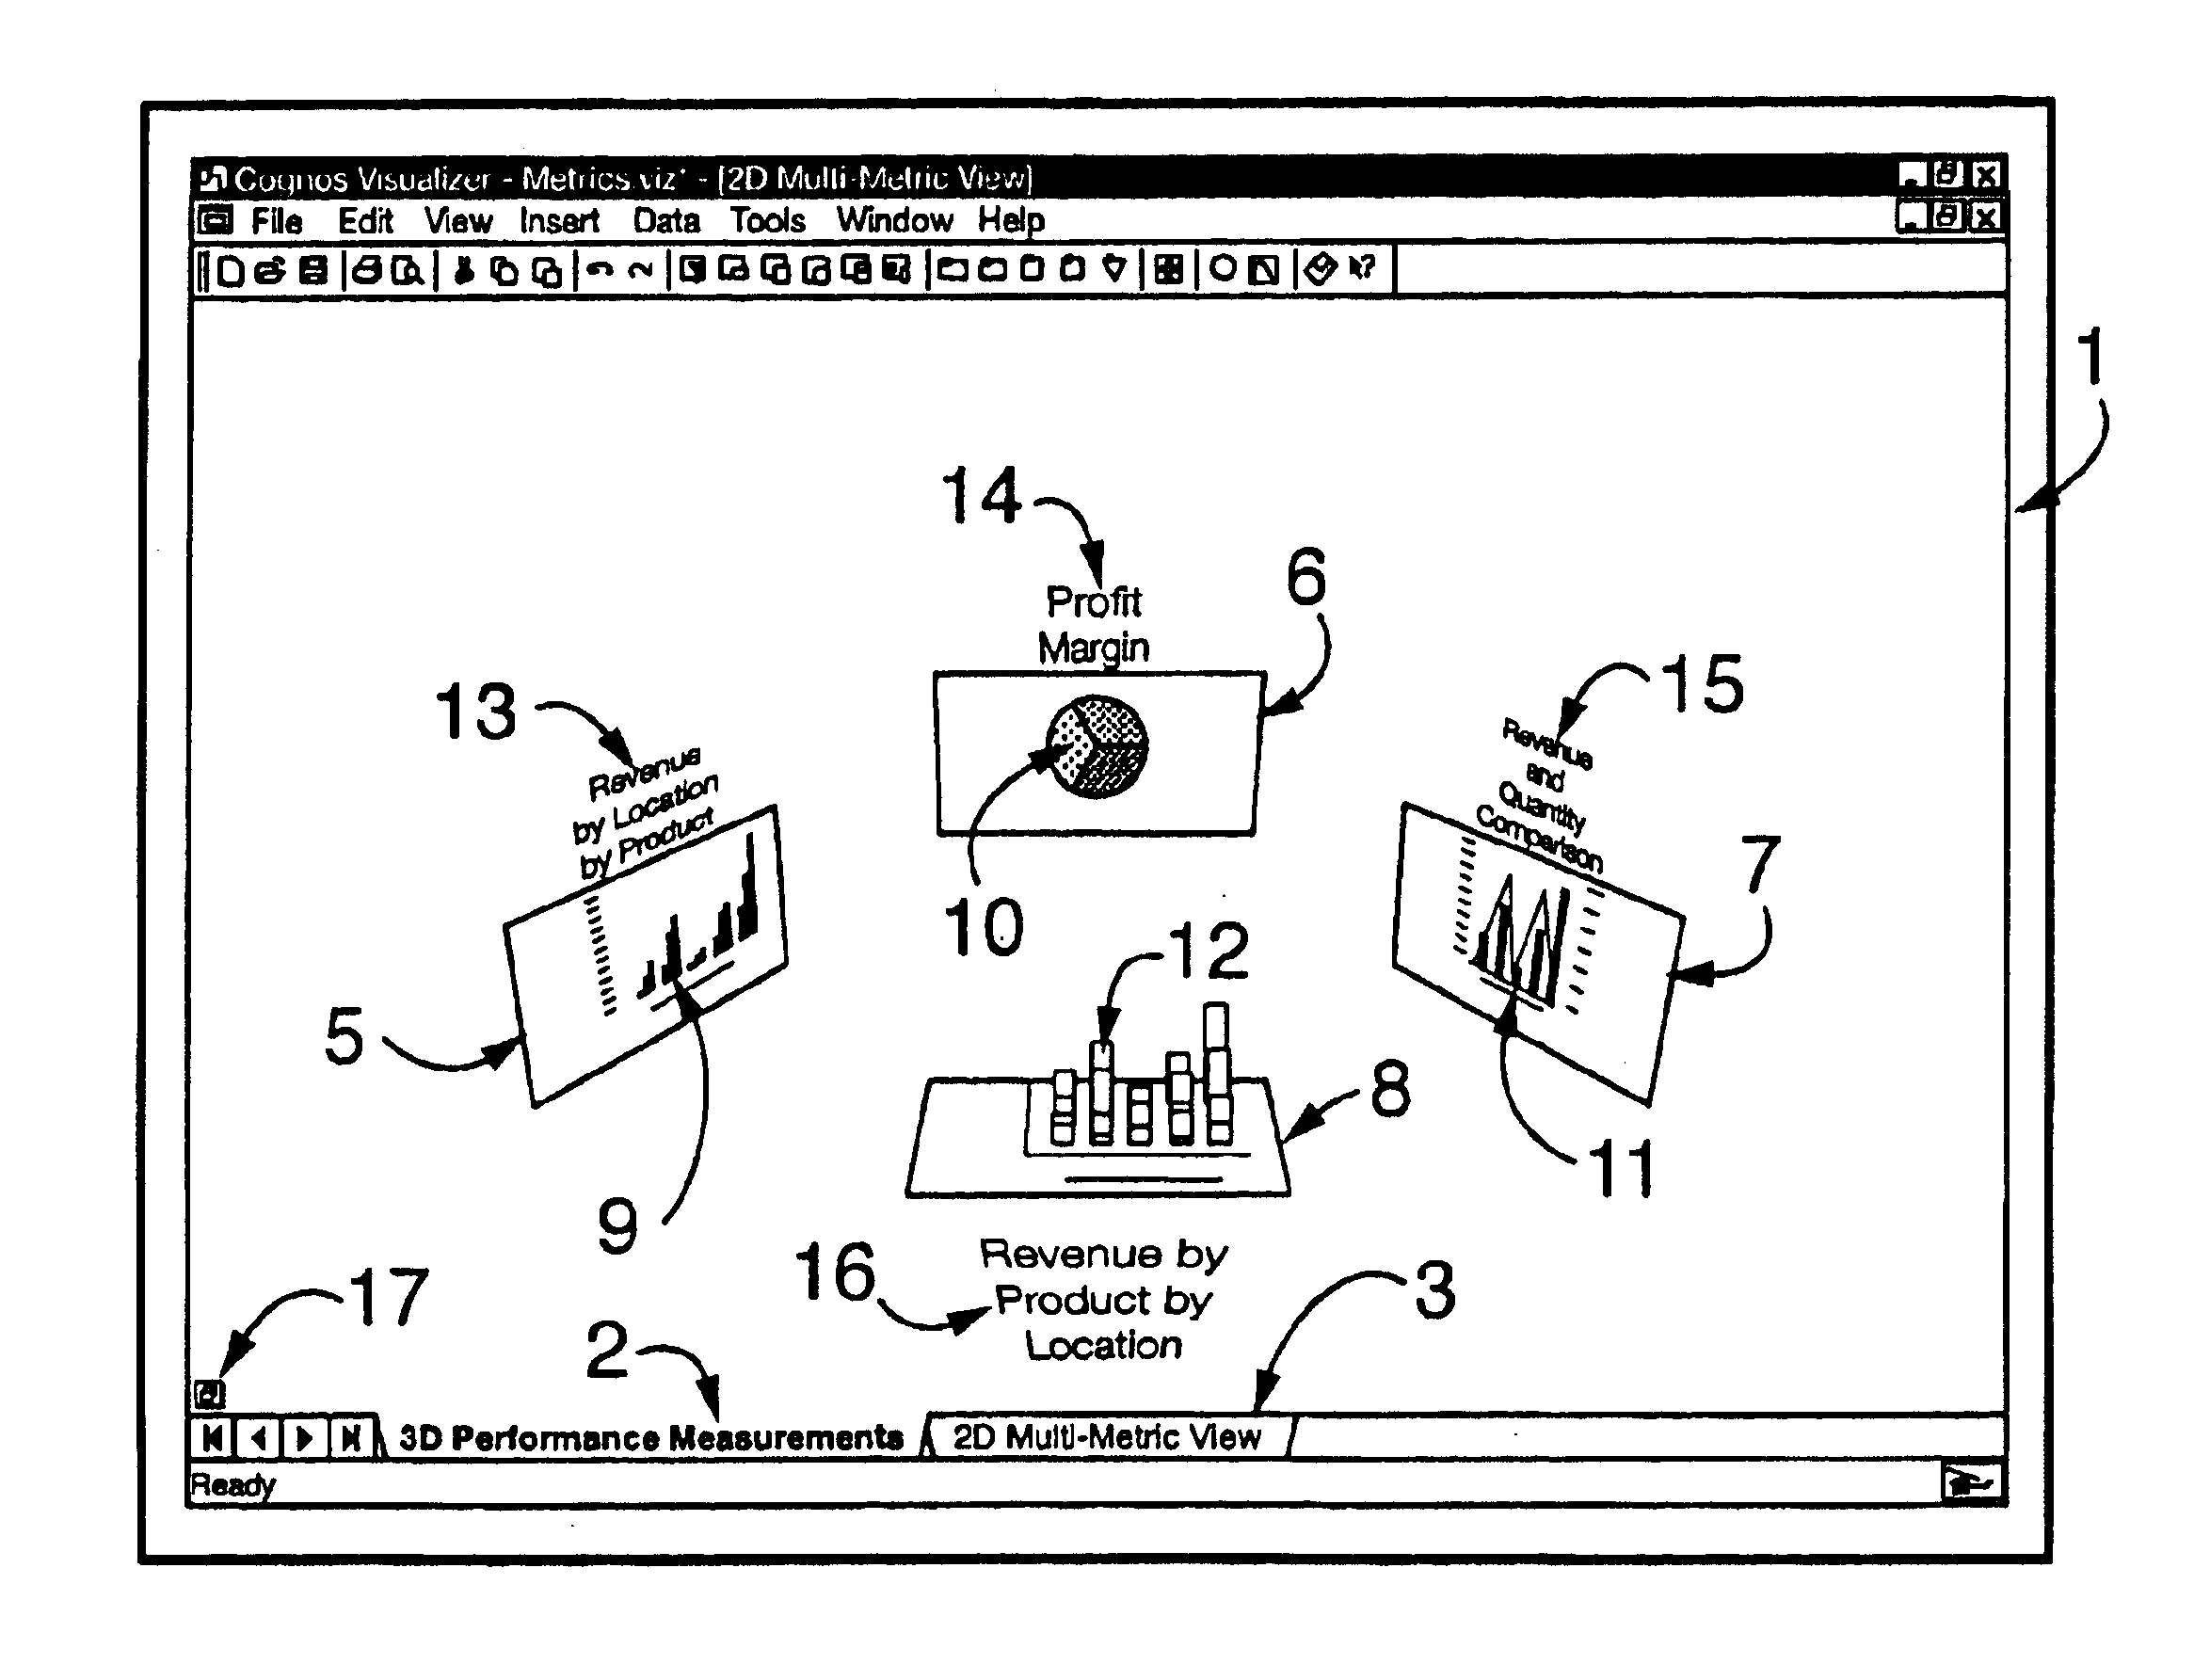
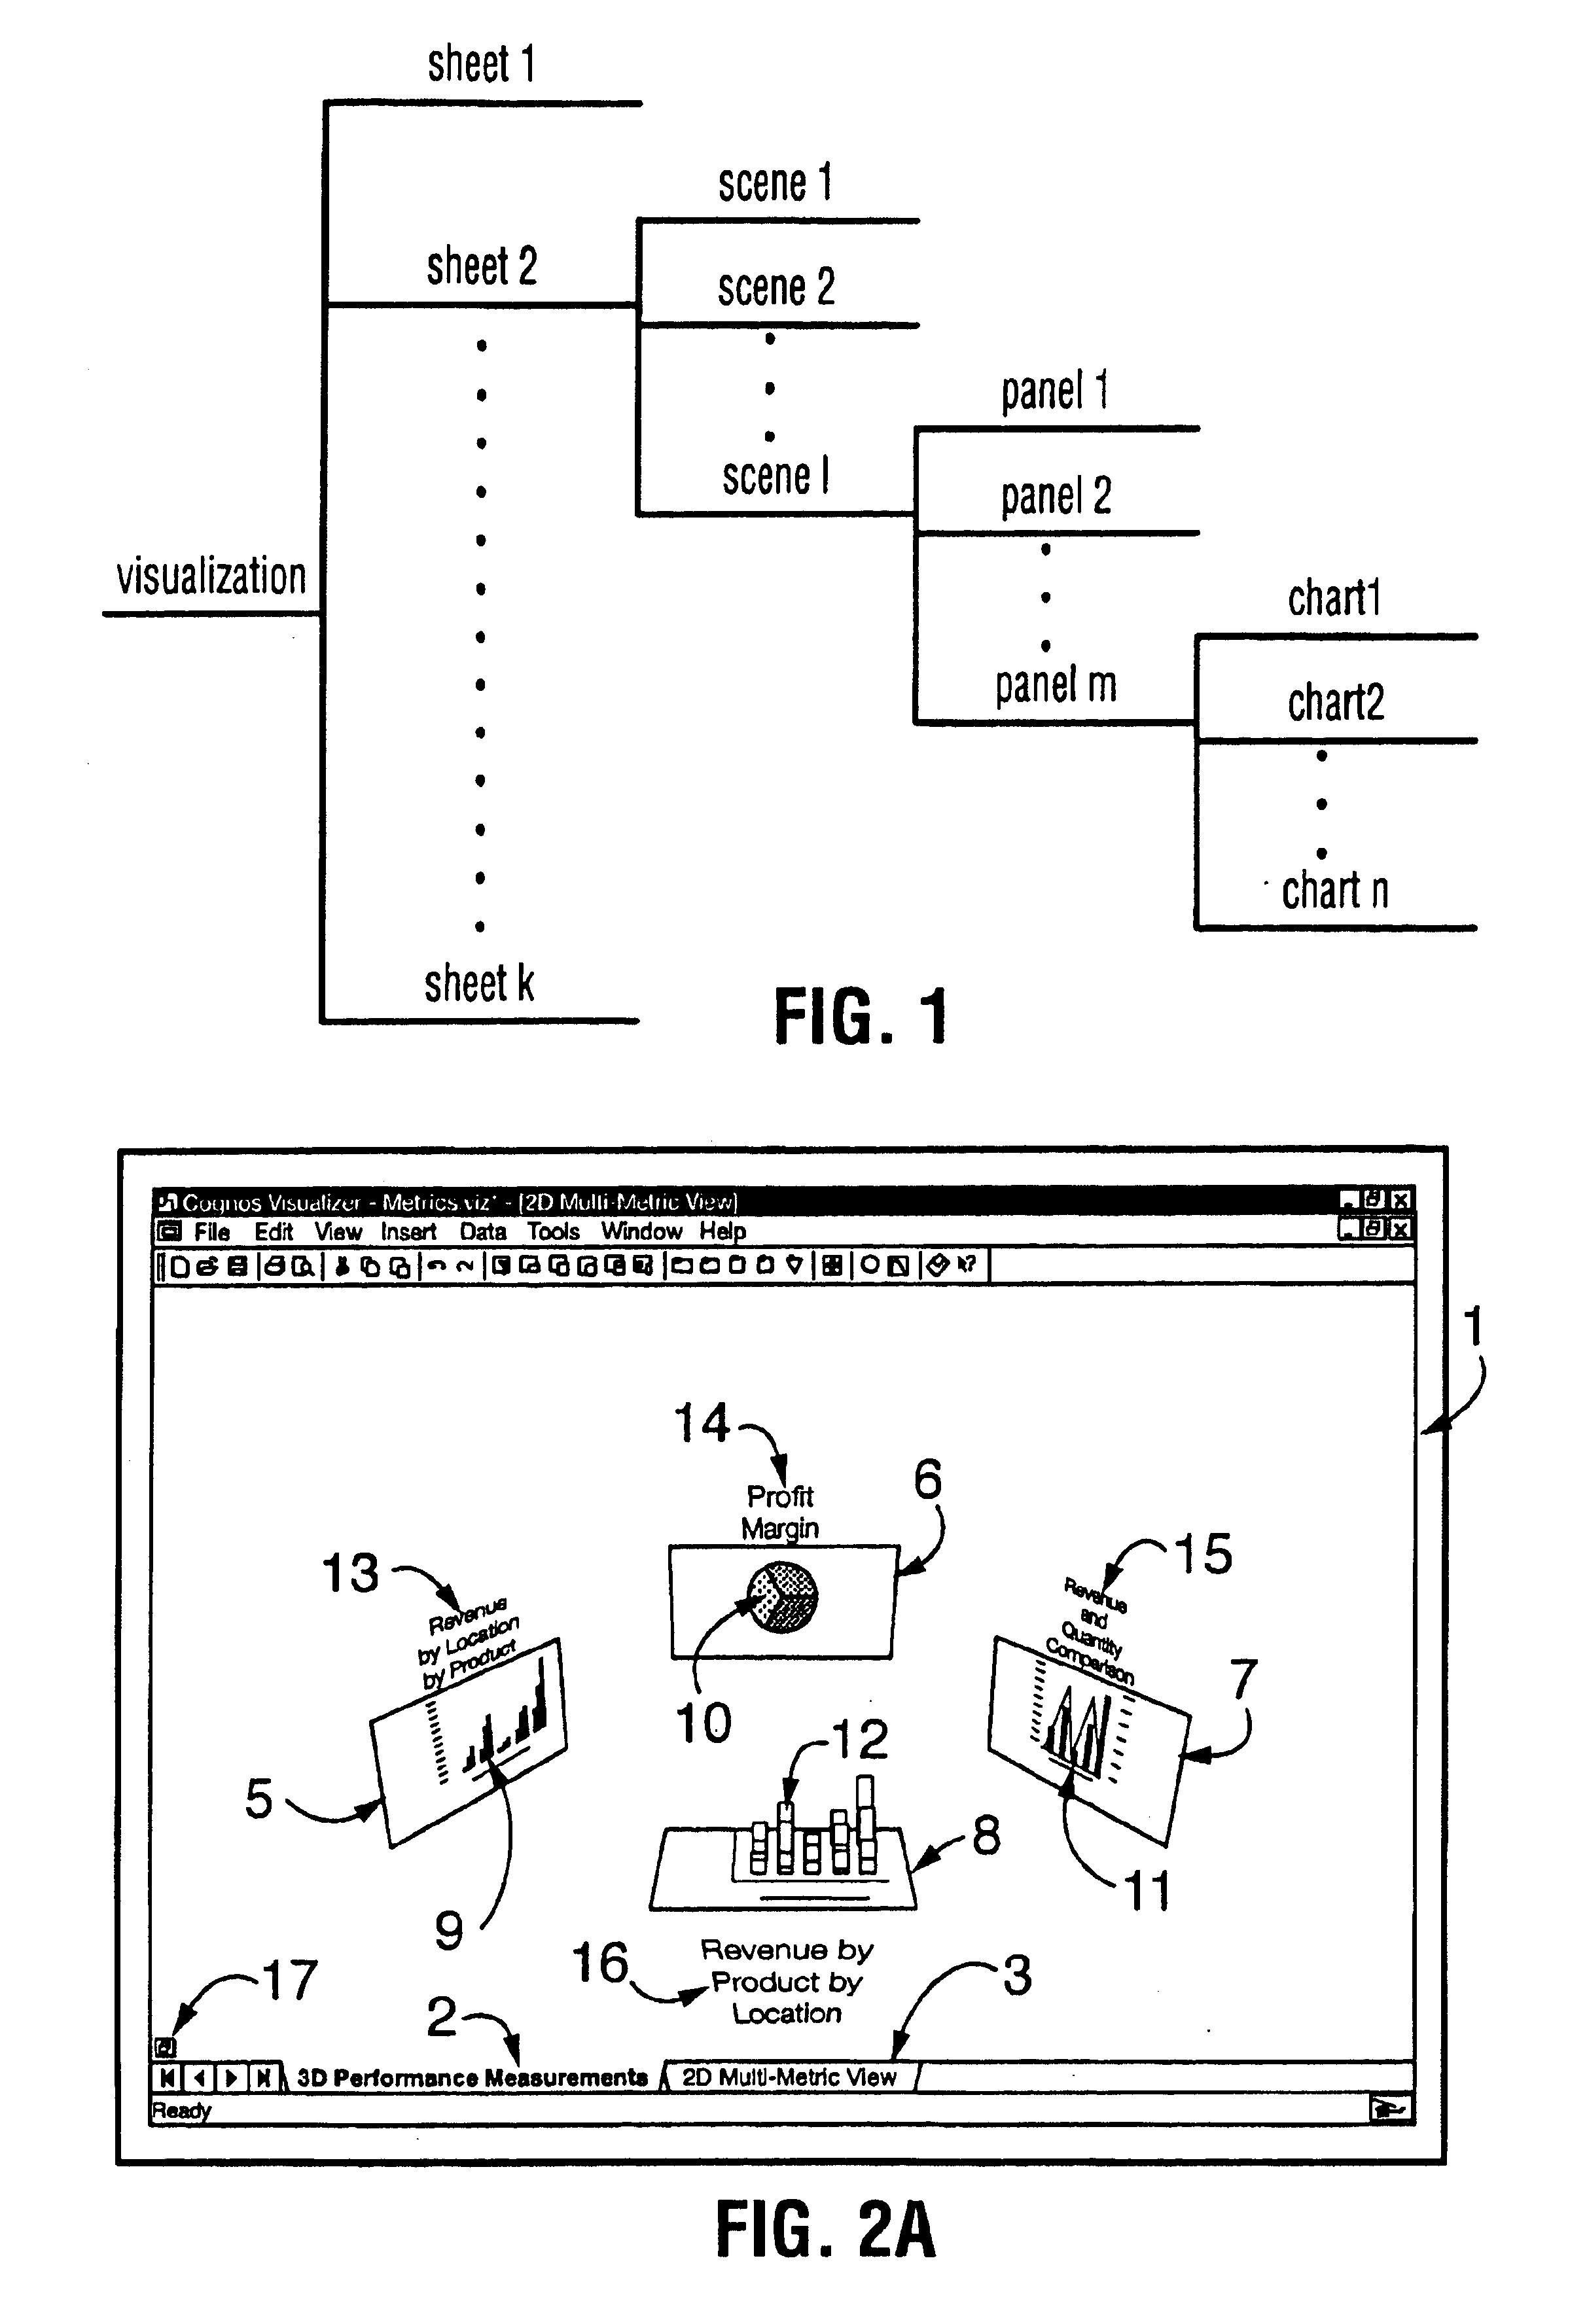
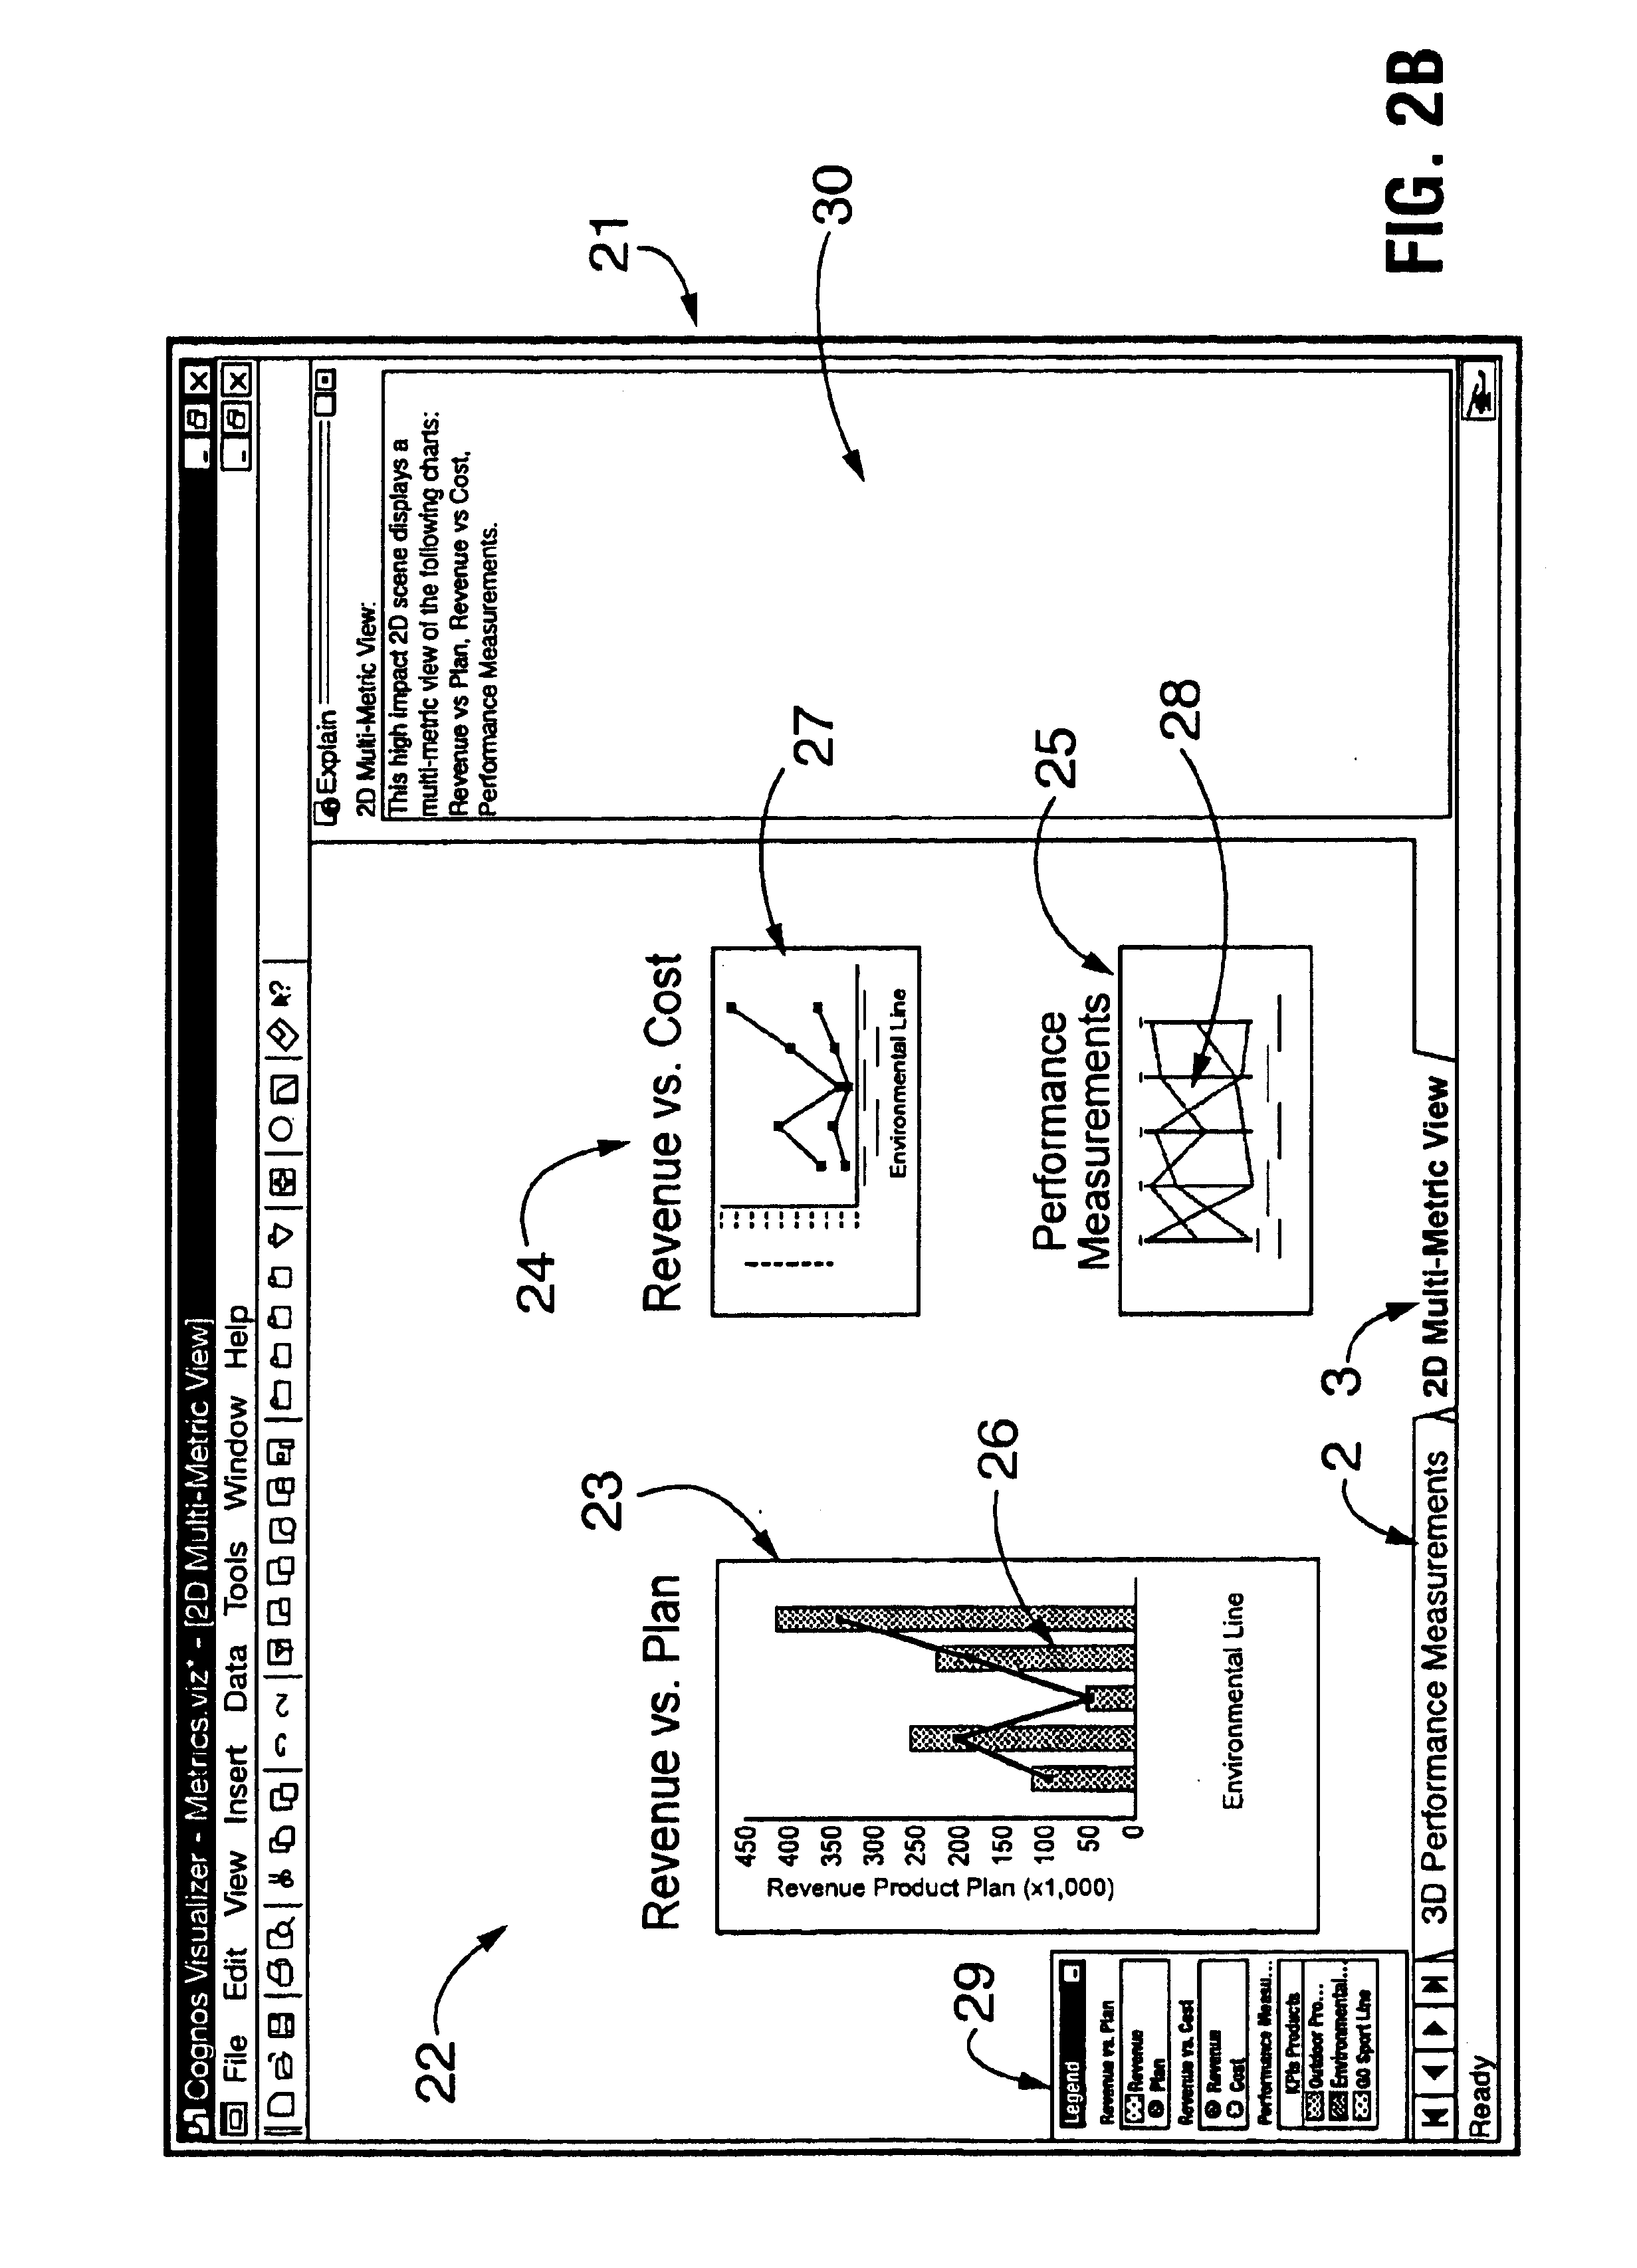
[0022]As used herein, the term “visualization” is understood broadly as a graphical, multimetric, and interactive presentation of business data, consolidating in a limited space a large amount of complex business information and summarizing it by a number of metrics presented to the user in a highly visual form. The term “metric” (noun) is understood as any quantitative (numerical) measure or qualitative (non-numerical) characteristic calculated or otherwise obtained from business data, which measure or characteristic provides a summary of some aspects of business activities or performances. Metrics are usually numerical and aggregate (formed by adding or combining) business data representations and may combine data or information from more than one data source. An “interactive visualization” is understood as a visualization involving the user in the process of creating the visualization and in the data exploration using the visualization so created. The term “measure” is understood...


PUM


Abstract

An interactive system for visualizing business data organized according to the dimensional model allows to combine data from more than one data source and present the data in the form of a graphical, multi-metric data visualization. The visualizations are hierarchically structured and built from visualization elements including, in ascending order of hierarchy, charts, panels, scenes and sheets. The system provides a large variety of two- and three-dimensional visualization elements, mostly predefined charts, which can be combined in any number into fully customized visualizations. In a preferred embodiment, a visualization is built by the system, which prompts the user to select data sources, data items to be visualized, and certain features of the presentation layout. In response to the user input, the system generates a number of candidate visualizations and presents them to the user for selection in descending order of preference, based on numerical scores assigned to the candidate visualizations by a scoring algorithm. The data to be visualized can be filtered, drilled down for details, or presented in a series of consecutive visualizations, to create an animation effect.

Description

CROSS REFERENCE TO RELATED APPLICATION[0001]This document claims priority to and the benefit of the filing date of copending provisional application entitled INTERACTIVE BUSINESS DATA VISUALIZATION SYSTEM, assigned Ser. No. 60 / 202,911, and filed May 10, 2000, which is hereby incorporated by reference.FIELD OF THE INVENTION[0002]The present invention relates to a business data visualization system and method, more particularly to an interactive system and method of visualizing business data organized according to the dimensional model.BACKGROUND OF THE INVENTION[0003]The field of business applications of computer technology has seen many important changes over the last few years. With steadily growing computational power and data storage capacities of computer systems used for business data processing, the interest of the business community has shifted from transactional data management systems (on-line transaction processing systems, or OLTP systems, mostly supporting day-to-day bus...

Claims


Application Information

Patent Timeline
Patent Type & Authority Patents(United States)
IPC IPC(8): G06T11/20G06F3/00G06F9/46G06T15/40G06T17/00H04N5/445
CPCG06F9/542G06F2209/545
Inventor JOU, STEPHAN F.CAMPBELL, DONBALLANTYNE, IAN
Owner DAEDALUS BLUE LLC
Why Eureka
Try Eureka