Systems and methods for risk processing and visualization of supply chain management system data

a supply chain management and data technology, applied in the field of systems and methods for risk processing and visualization of supply chain management system data, can solve the problems of increasing the complexity of the supply chain, increasing the pressure on companies to reduce costs, and shortening the product lifecycle, so as to reduce the amount of inventory

Pending Publication Date: 2015-04-30
JABIL INC
View PDF8 Cites 71 Cited by
  • Summary
  • Abstract
  • Description
  • Claims
  • Application Information

AI Technical Summary

Benefits of technology

[0074]FIG. 3B illustrates, at the primary node 101 of a data exchange diagram, platform 307. In the illustration, platform 307 may provide a plurality of rules and processes, such as the aforementioned analytics, exception management, risk management, and visualization techniques, that may be applied by one or more modules. That is, access to the rules and processes provided by the platform may be available to the aforementioned modules. Thus, these applications, also referred to herein as “apps” or modules, may be “thin client”, wherein the processes reside entirely within the platform's processing and are accessed by the app; “thick client,” wherein the processes reside entirely within the app's processing; or partially thin client, wherein processing and rule application is shared between the app and the platform.
[0075]Data inputs for the one of more modules, also referred to in the pertinent art as “data hooks” for “apps,” may be associated with the platform 307, and thus may obtain data that is made available by the platform, such as may be obtained from hardware or software outputs provided from nodes 104, 107 and/or sources 110, 111. As illustrated, data may be received in platform modules for risk management 311, analytics 312, information visualization 313 and exception management 314. The data may be provided in the form of network optimization data 321, supply chain analytics data 322, design/engineering/technology data 315, consumer intelligence data 316, supplier data 317, procurement data 318, operations data 321, and supply and demand data 319, by way of non-limiting example. Output data from any given app may be provided through visualization rules unique to the app and within the app, or via the platform, such as within a discreet display aspect for a given app within the platform. Output data from any given app may be provided, such as through visualization rules unique to the app, within the app, or via the platform, such as within a discreet display aspect, such as a drop down, top line, or side line menu, for a given app within the platform.
[0076]Moreover, primary data employed by the platform and its associated apps may be atypical of that employed by conventional SCM systems. For example, customer intelligence data may include social media trends in relation to a device or device line. Secondary data derived from the social media trend for a device, for example, allows for secondary data to be derived therefrom in relation to inventory stock, need for alternate sourcing, and the like. For example, a negative overall indication on a device, as indicated by social media data drawn from one or more networked social media locations, would indicate a need for decreased inventory (since a negative consumer impression likely indicates an upcoming decrease in sales), notwithstanding any request by the seller of the device to the contrary. This need for decreased inventory may also dictate modif

Problems solved by technology

Supply chains have become increasingly complex, and product companies are faced with numerous challenges such as globalization, shortening product lifecycles, high mix product offerings and countless supply chain procurement models.
In addition, challenging economic conditions have placed additional pressure on companies to reduce cost to maximize margin or profit.
Supply chain risk or the likelihood of supply chain disruptions is emerging as a key challenge to SCM.
However, such conventional systems are needlessly complicated and somewhat disorganized in that multiple layers of classification risks are utilized and, too often, the systems focus mainly on the prediction of disruptive events instead of analyzing and processing underlying root causes for potential disruption.
Moreover, conventional supply chain management has historically been based on various assumptions that may prove incorrect.
By way of example, it has generally been understood that the highest risk in the supply chain resides with suppliers

Method used


Image

  • Systems and methods for risk processing and visualization of supply chain management system data
  • Systems and methods for risk processing and visualization of supply chain management system data
  • Systems and methods for risk processing and visualization of supply chain management system data

Examples


example 11

[0122]Raw Material Mfg.→Supplier→Component→Assembly→Customer

example 2

[0123]Mfg. Plant→Distribution→Customer→End Consumer

example 3

[0124]Supplier→Vendor Hub→Mfg. Plant→Customer Hub→End Consumer

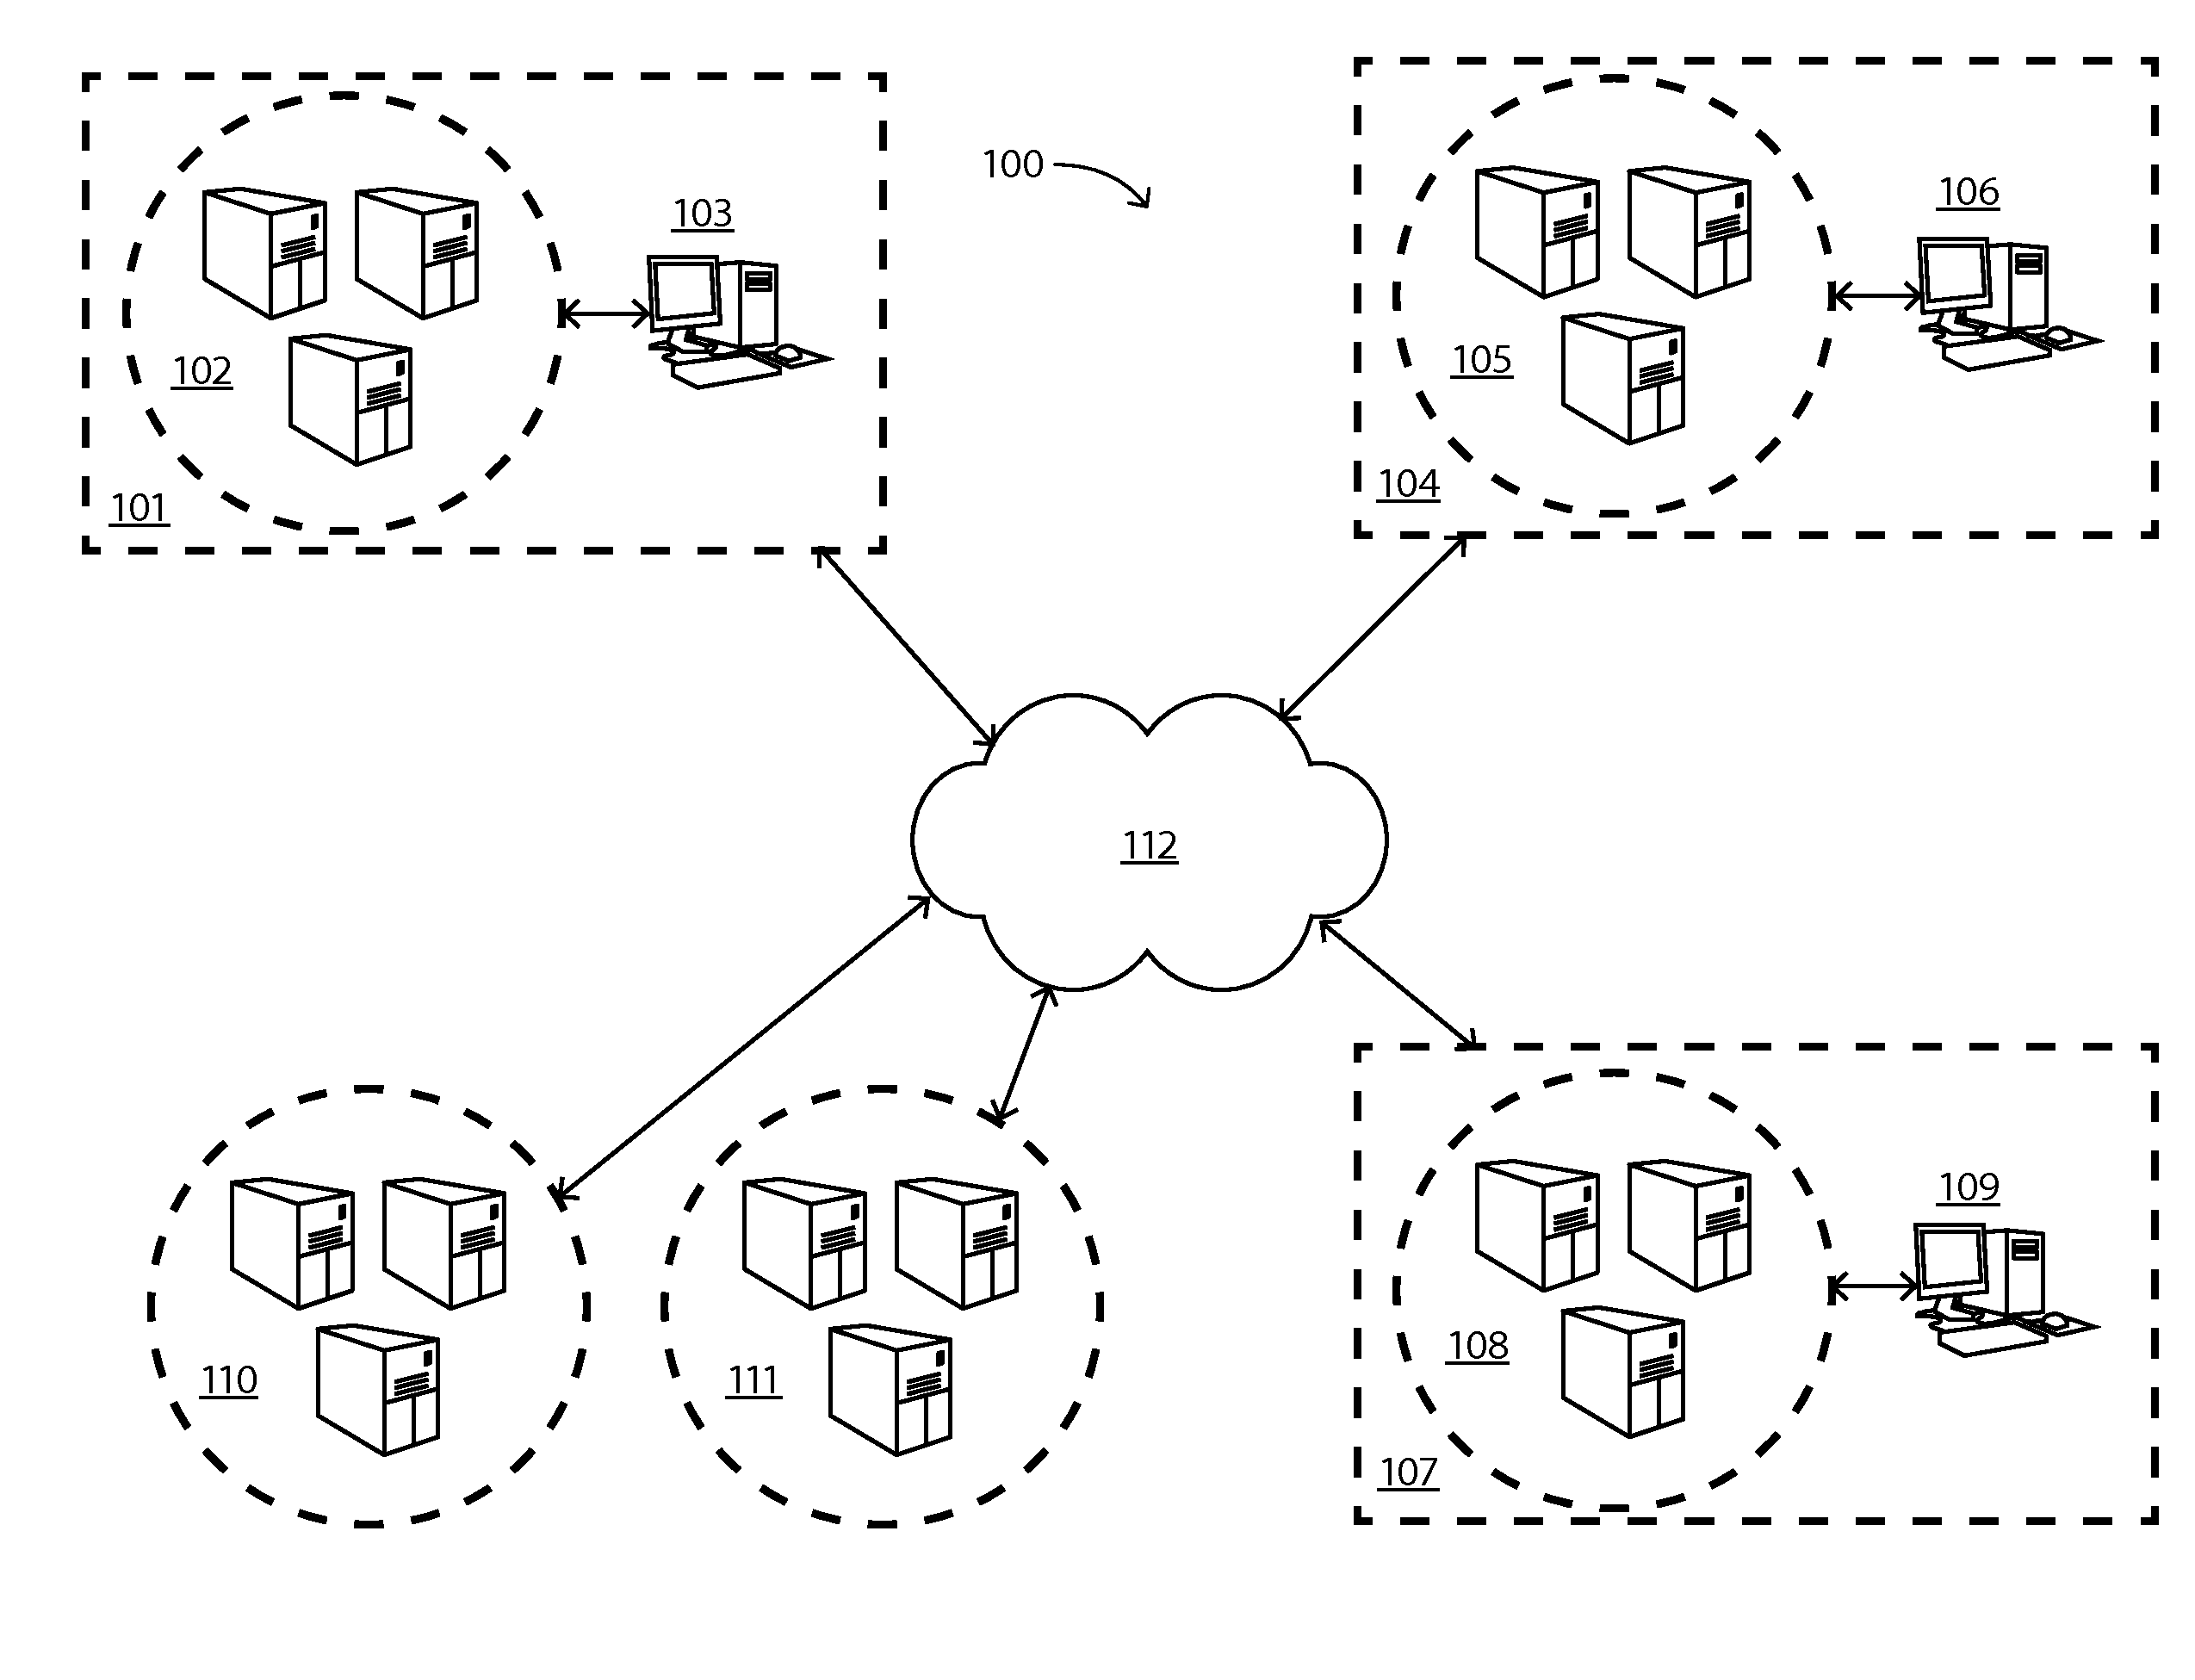
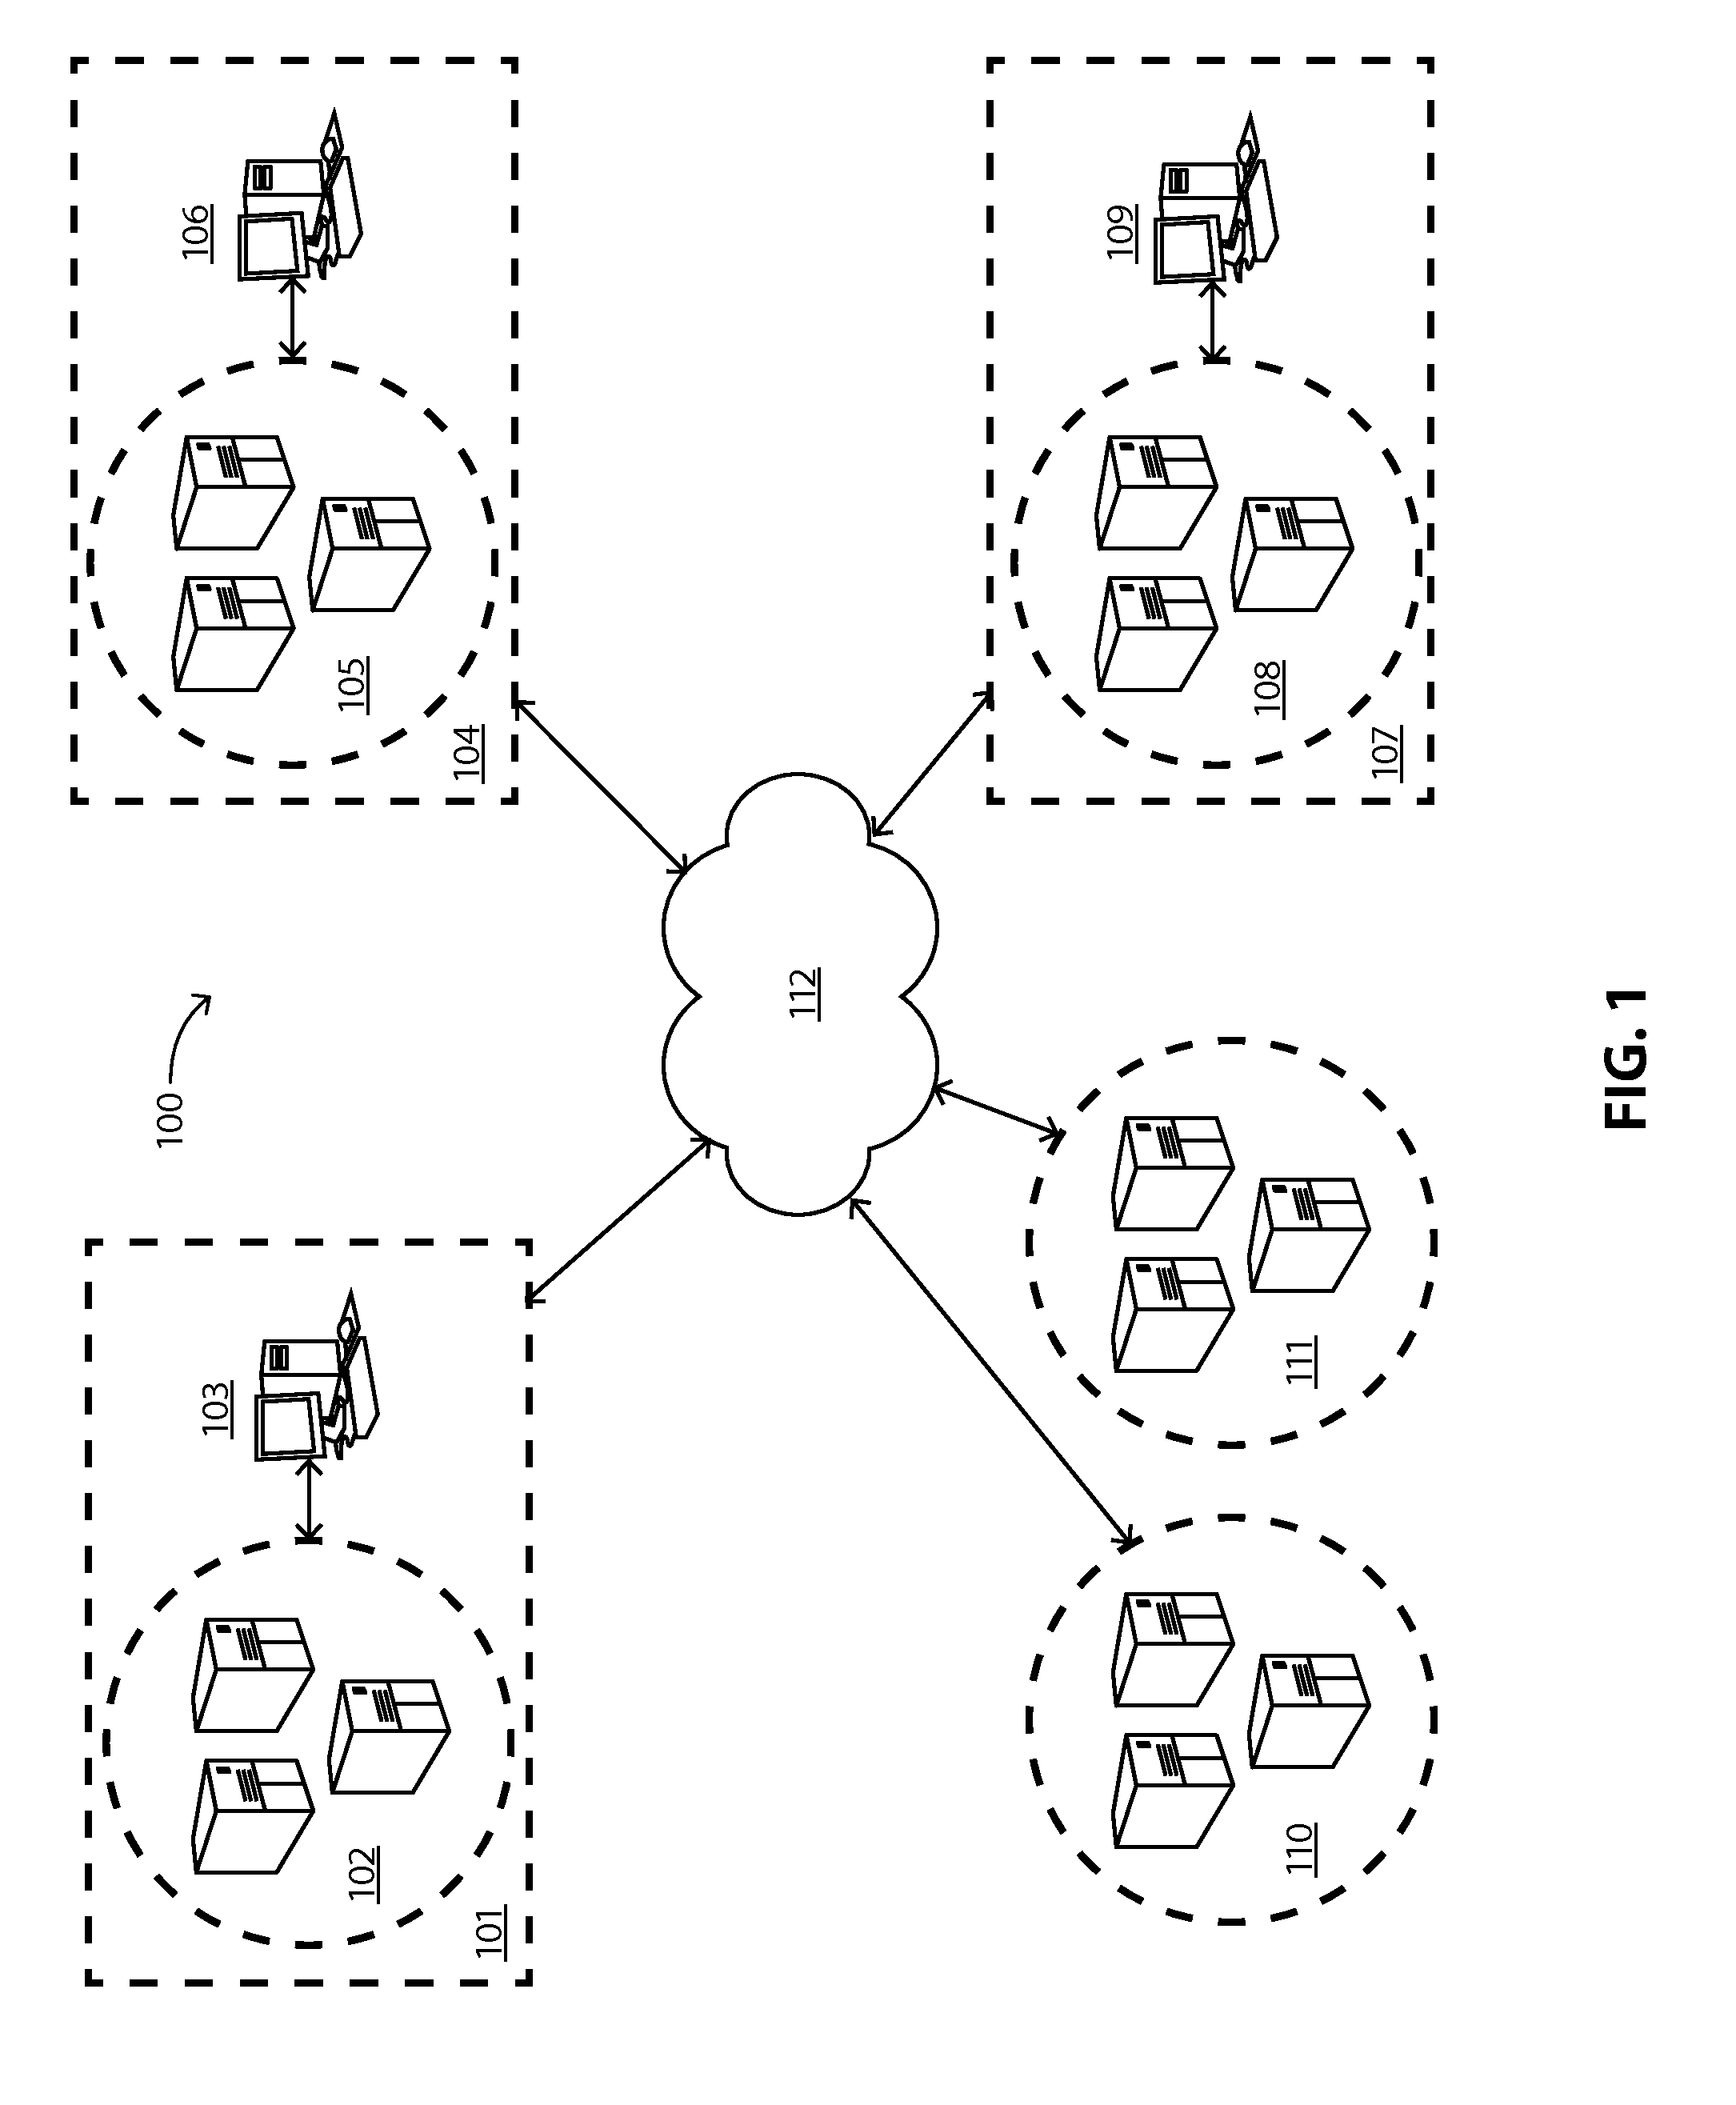
[0125]As shown in FIG. 15, each supply chain node is linked by a connection. These connections may be one-to-one, one-to-many and / or many-to-many. The visualization makes it possible to display every node in a given supply chain in a single graphic which allows a user to understand the overall activity and complexity within a supply chain, as well as its overall health. Likewise, displayed nodes may be limited by a user or by the app, and / or by number or by node type, by way of non-limiting example. The exemplary embodiment allows a user to quickly relate to patters being depicted in the node tree visualization. For example, certain nodes may be quickly identified as having high concentrations of demand flowing through them. Nodes may also be identified having existing overall risk and / or opportunity in certain parts of the supply chain. As mentioned previously, a single holistic visualization may allow a company to make ...


PUM


Abstract

Apparatus, system and method for supply chain management (SCM) system processing. A SCM operating platform is operatively coupled to SCM modules for collecting, storing, distributing and processing SCM data to determine statistical opportunities and risk in a SCM hierarchy. SCM risk processing may be utilized to determine risk values that are dependent upon SCM attributes. Multiple SCM risk processing results may be produced for further drill-down by a user. SCM network nodes, their relation and status may further be produced for fast and efficient status determination.

Description

RELATED APPLICATIONS[0001]The present application claims priority to U.S. provisional patent application Ser. No. 61 / 895,636, to Valentine, et al., titled “Node Network Interactive Data Visualization,” filed Oct. 25, 2013, U.S. provisional patent application Ser. No. 61 / 895,665, to Joyner et al., titled “System and Method for Managing Supply Chain Risk,” filed Oct. 25, 2013, and U.S. provisional patent application Ser. No. 61 / 896,251 to McLellan et al., titled “Method for Identifying and Presenting Risk Mitigation Opportunities in a Supply Chain,” filed Oct. 28, 2013. Each of these is incorporated by reference in their respective entireties herein.TECHNICAL FIELD[0002]The present disclosure relates to supply chain management (SCM) system processing. More specifically, the present disclosure is related to processing SCM data to reduce cost, improve flexibility and to identify and mitigate risk in a supply chain. Furthermore, the SCM data may be organized in the disclosure in such a w...

Claims


Application Information

Patent Timeline
IPC IPC(8): G06Q10/06
CPCG06Q10/0635G06Q10/06315
Inventor BAJAJ, MUDITHARTUNG, FREDERICKIWASKO, GREGGJOYNER, ANDREWLAPINSKI, KEITHMCBETH, JOEMCLELLAN, JASONVALENTINE, ROSS
Owner JABIL INC
Why Eureka
Try Eureka