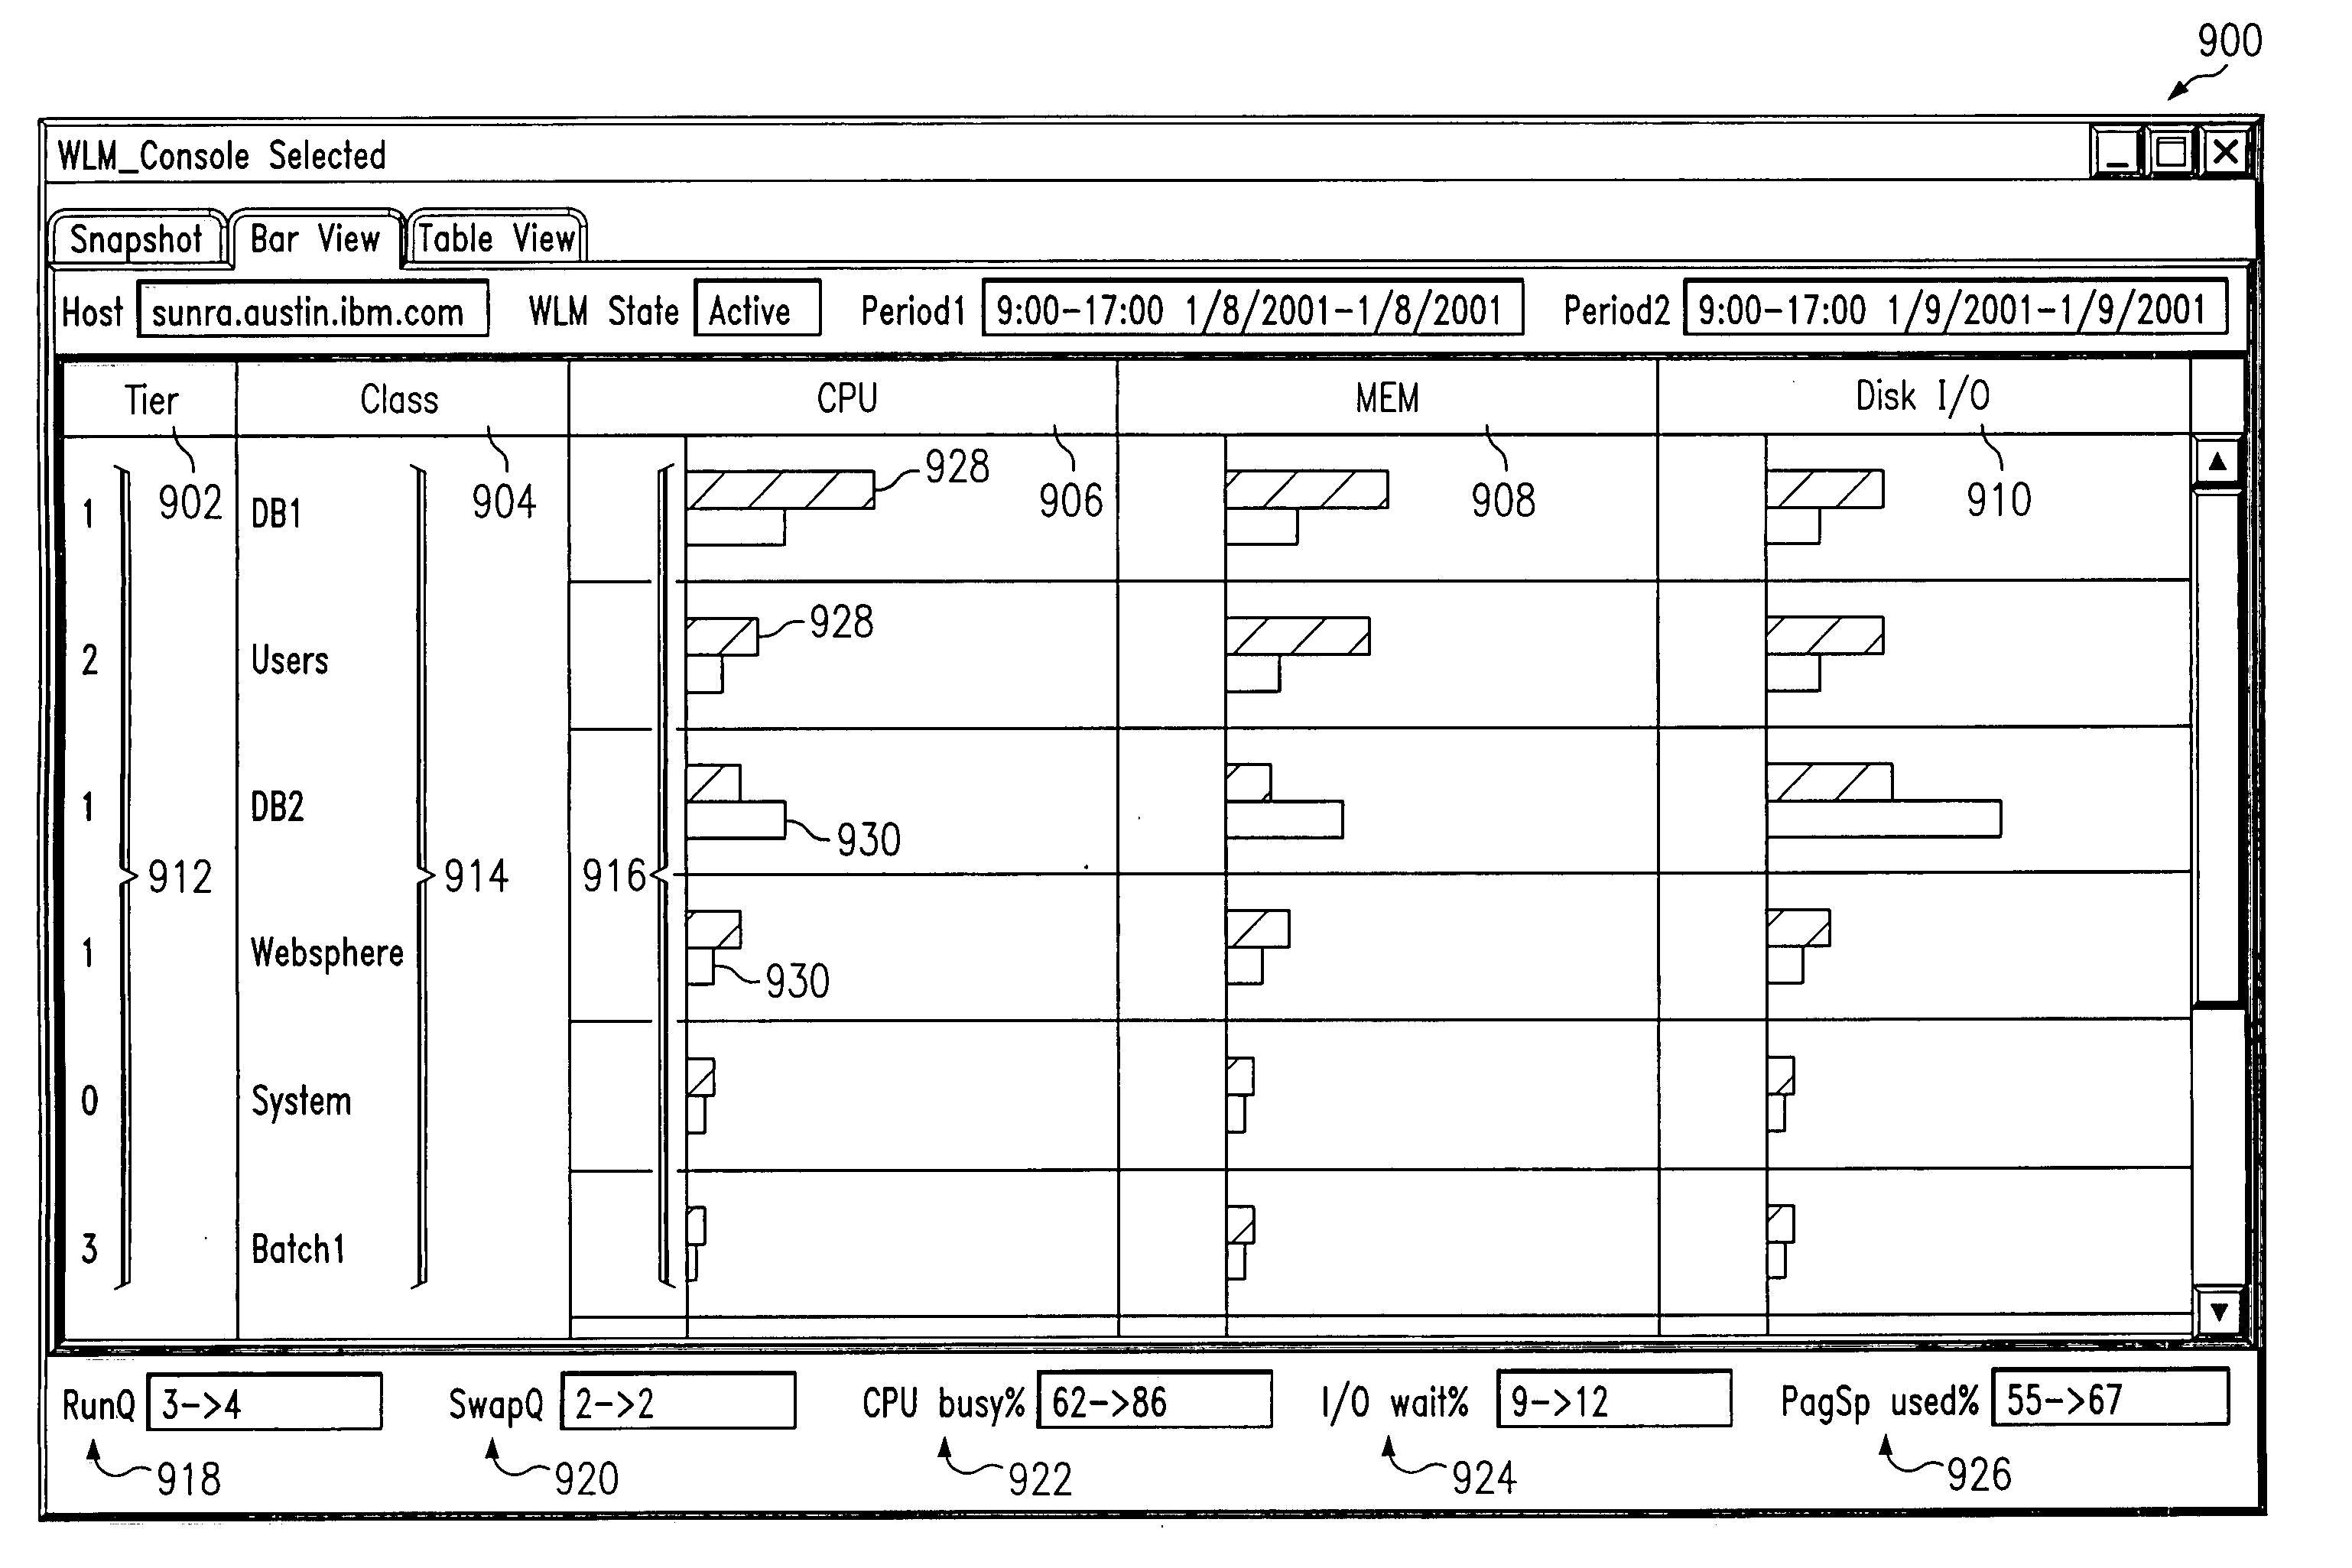
Graphical user interface for visualization of sampled data compared to entitled or reference levels
- Summary
- Abstract
- Description
- Claims
- Application Information
AI Technical Summary
Benefits of technology
Problems solved by technology
Method used
Image

Examples
Embodiment Construction
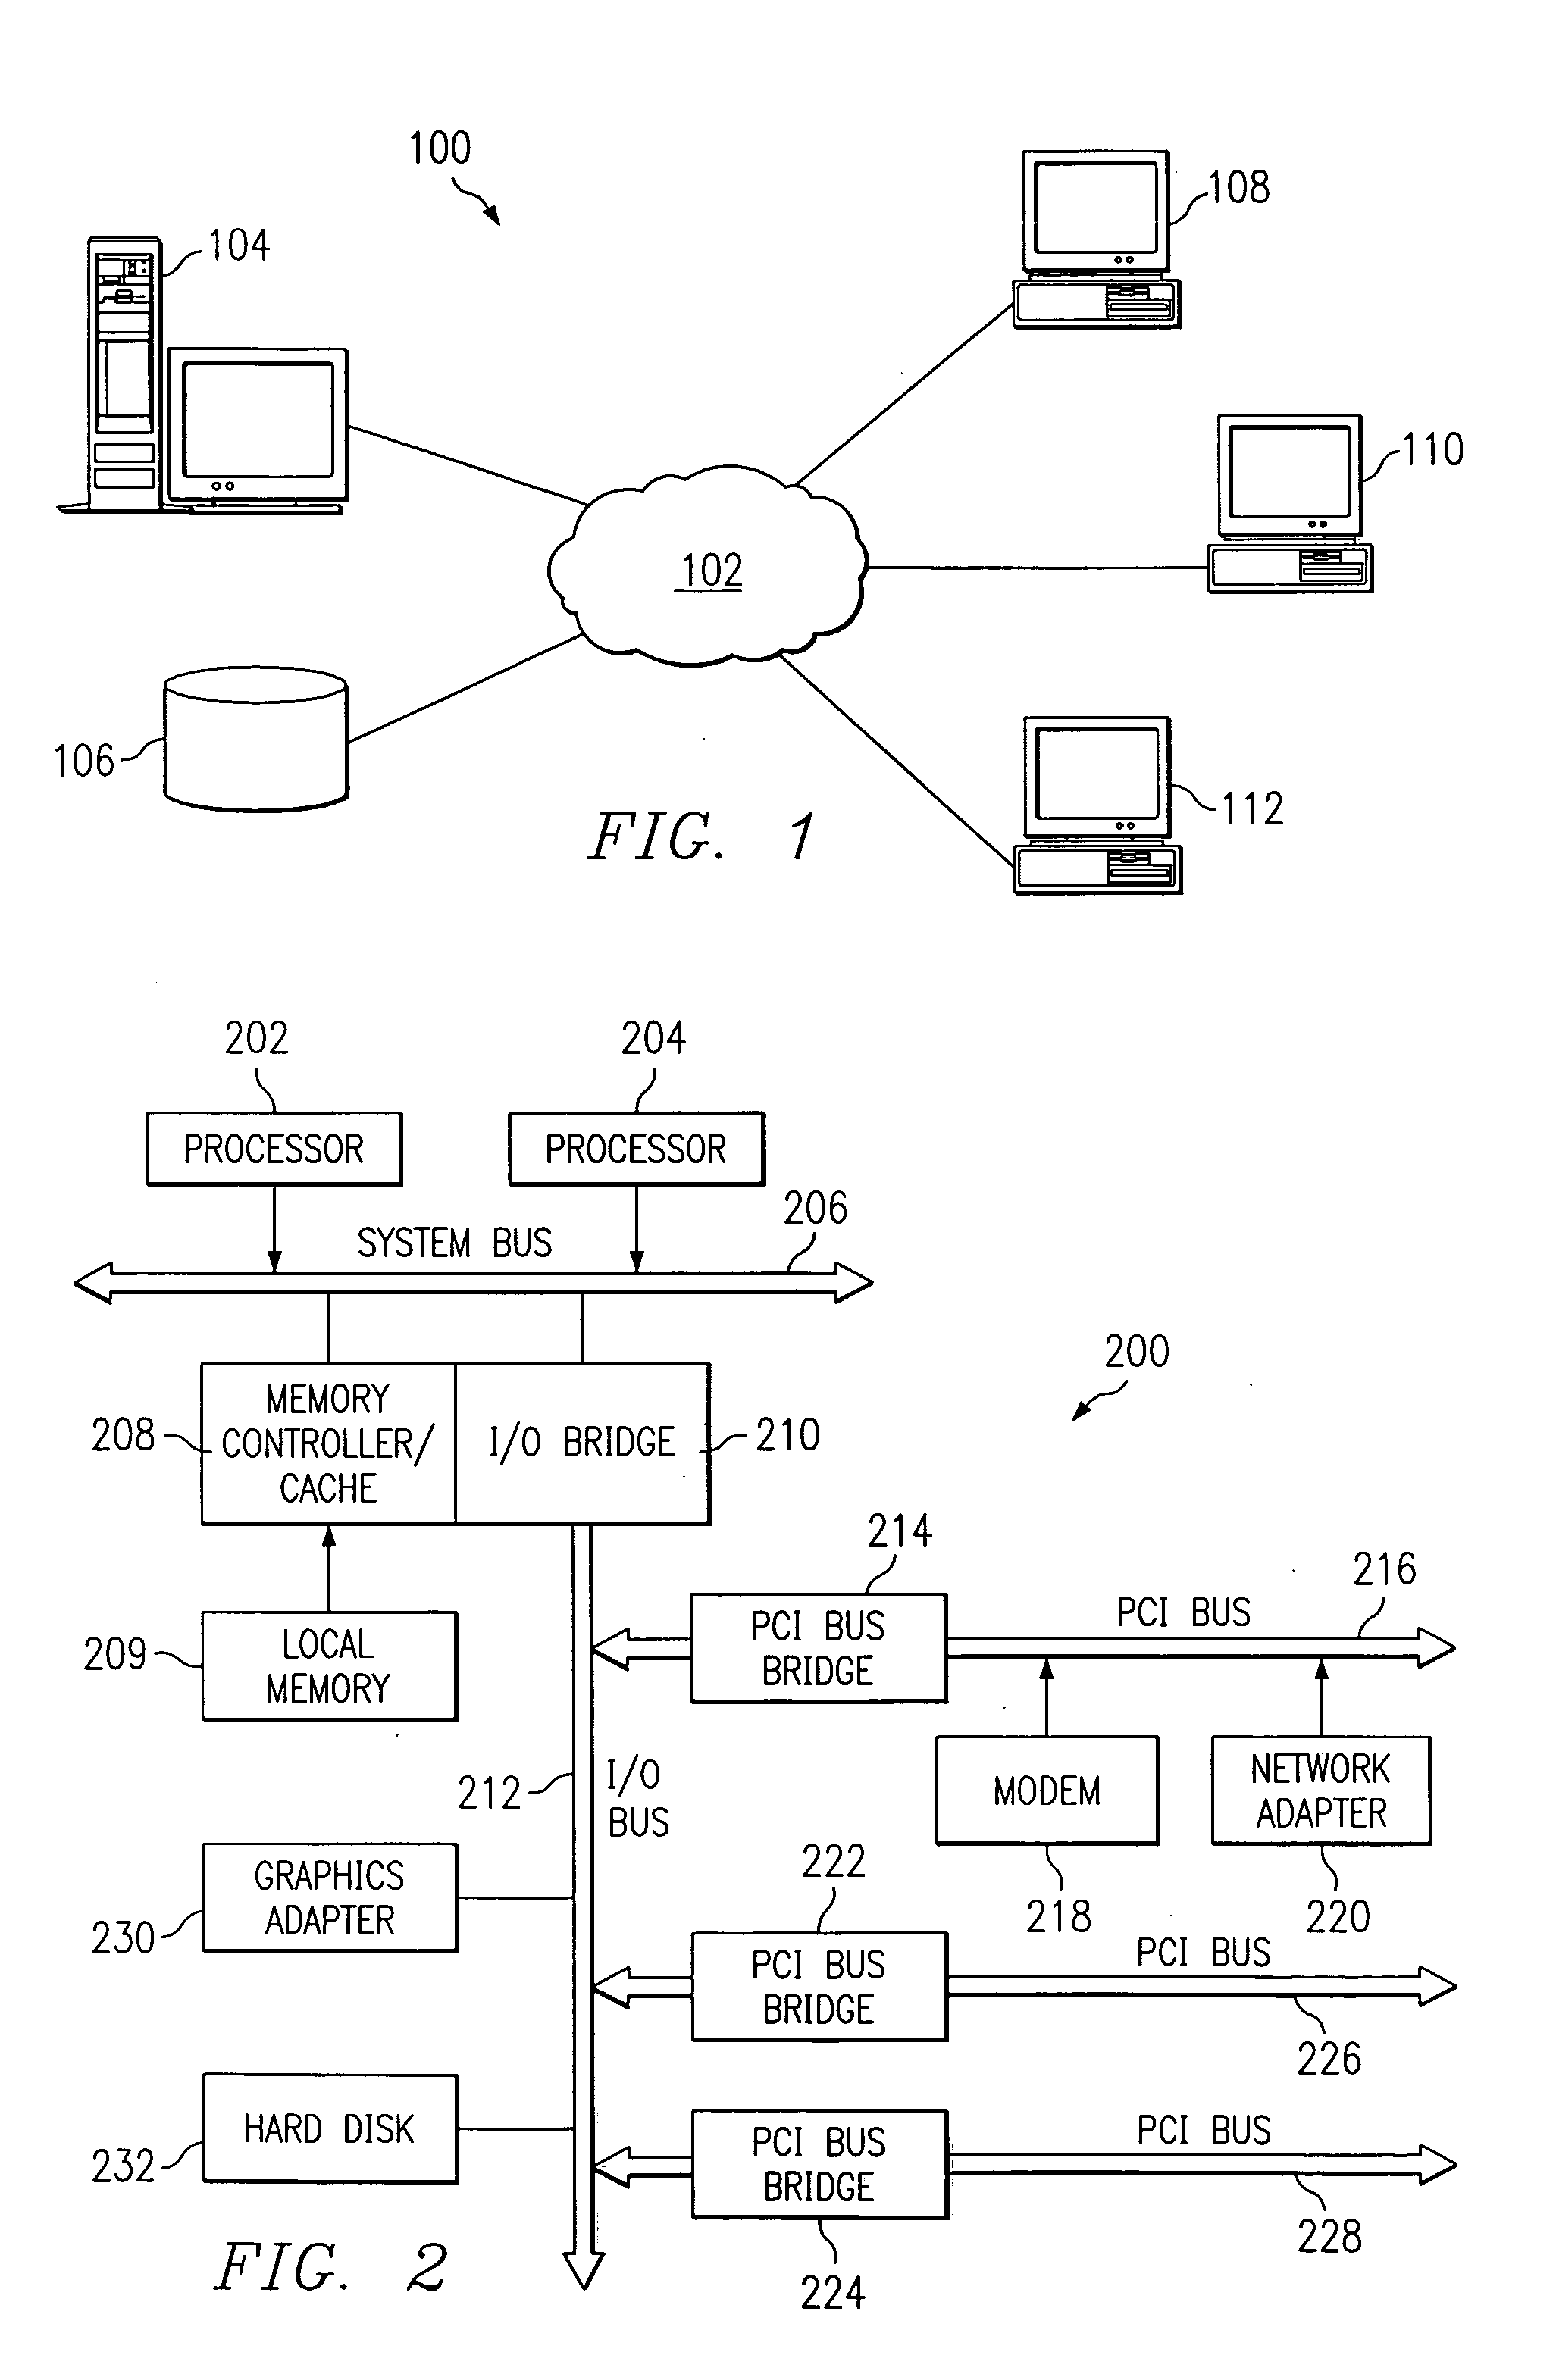
[0021]With reference now to the figures, FIG. 1 is a pictorial representation of a networked data processing system in which the present invention may be implemented. Networked data processing system 100 is a network of computers in which the present invention may be implemented. Networked data processing system 100 contains a network 102, which is the medium used to provide communications links between various devices and computers connected together within networked data processing system 100. Network 102 may include wireline connections, such as copper wire or fiber optic cables, and wireless connections, such as cellular telephone connections. Also, the connections for network 102 may be either permanent, such as with a dedicated line, and / or temporary, such as connections made through dial up telephone connections.
[0022]In the depicted example, a server 104 is connected to network 102 along with storage unit 106. In addition, clients 108, 110, and 112 also are connected to netw...
PUM
 Abstract
Description
Claims
Application Information
 - R&D Engineer
- R&D Manager
- IP Professional
- Industry Leading Data Capabilities
- Powerful AI technology
- Patent DNA Extraction
Browse by: Latest US Patents, China's latest patents, Technical Efficacy Thesaurus, Application Domain, Technology Topic.
© 2024 PatSnap. All rights reserved.Legal|Privacy policy|Modern Slavery Act Transparency Statement|Sitemap