Nuisance alarm reductions in a physiological monitor

a physiological monitor and alarm technology, applied in the field of improvement in reducing nuisance alarms of pulse oximeters, can solve problems such as false events and trigger alarms, lowering thresholds, and reducing thresholds

Inactive Publication Date: 2006-10-17
TYCO HEALTHCARE GRP LP
View PDF21 Cites 359 Cited by
  • Summary
  • Abstract
  • Description
  • Claims
  • Application Information

AI Technical Summary

Problems solved by technology

In addition to clinically insignificant alarms, parameter measurement error due to noise, signal artifact or bias can also produce false events and trigger alarms.
Lowering the threshold can be problematic because a patient's blood oxygen saturation can remain indefinitely below the original threshold, but above the new threshold, and an alarm will never be generated.
Delaying alarm generation by a fixed amount of time is also problematic due to a potentially serious situation in which a patient's saturation abruptly falls to and remains at a very low level, requiring prompt medical attention.
A limitation in the use of the each of these prior art methods occurs when the SpO2 value (or other measured value) is systematically in error, as in where there is a high or low bias in the measured value, even if the bias error is relatively small.
The erroneously high SpO2 value may interfere with the ability to accurately calculate the proper value of the SatSecond integral 28.
Hence, SpO2 bias affects the reliability of measured values and alarms based on those values.
However, under some circumstances such a bias can and does occur.
Additionally, sensor placement variations, as well as other factors introduce bias, such that even instrument specifications acknowledge the presence of bias.
Under such circumstances (i.e., two sensors placed on the same patient), one sensor may indicate an alarm state, while the other does not, resulting in ambiguity in not knowing which sensor is providing the more correct reading.
Thus, although the SatSecond invention greatly reduces nuisance alarms in pulse oximeter readings, the measurements and hence alarm events may still be susceptible to bias-induced nuisance alarms.
This fixed threshold can also be problematic, as is described below.
However, the fixed window approach may be problematic for patients having, for example, a chronically elevated pulse rate value.

Method used


Image

  • Nuisance alarm reductions in a physiological monitor
  • Nuisance alarm reductions in a physiological monitor
  • Nuisance alarm reductions in a physiological monitor

Examples


example 1

Correct SpO2 Readings

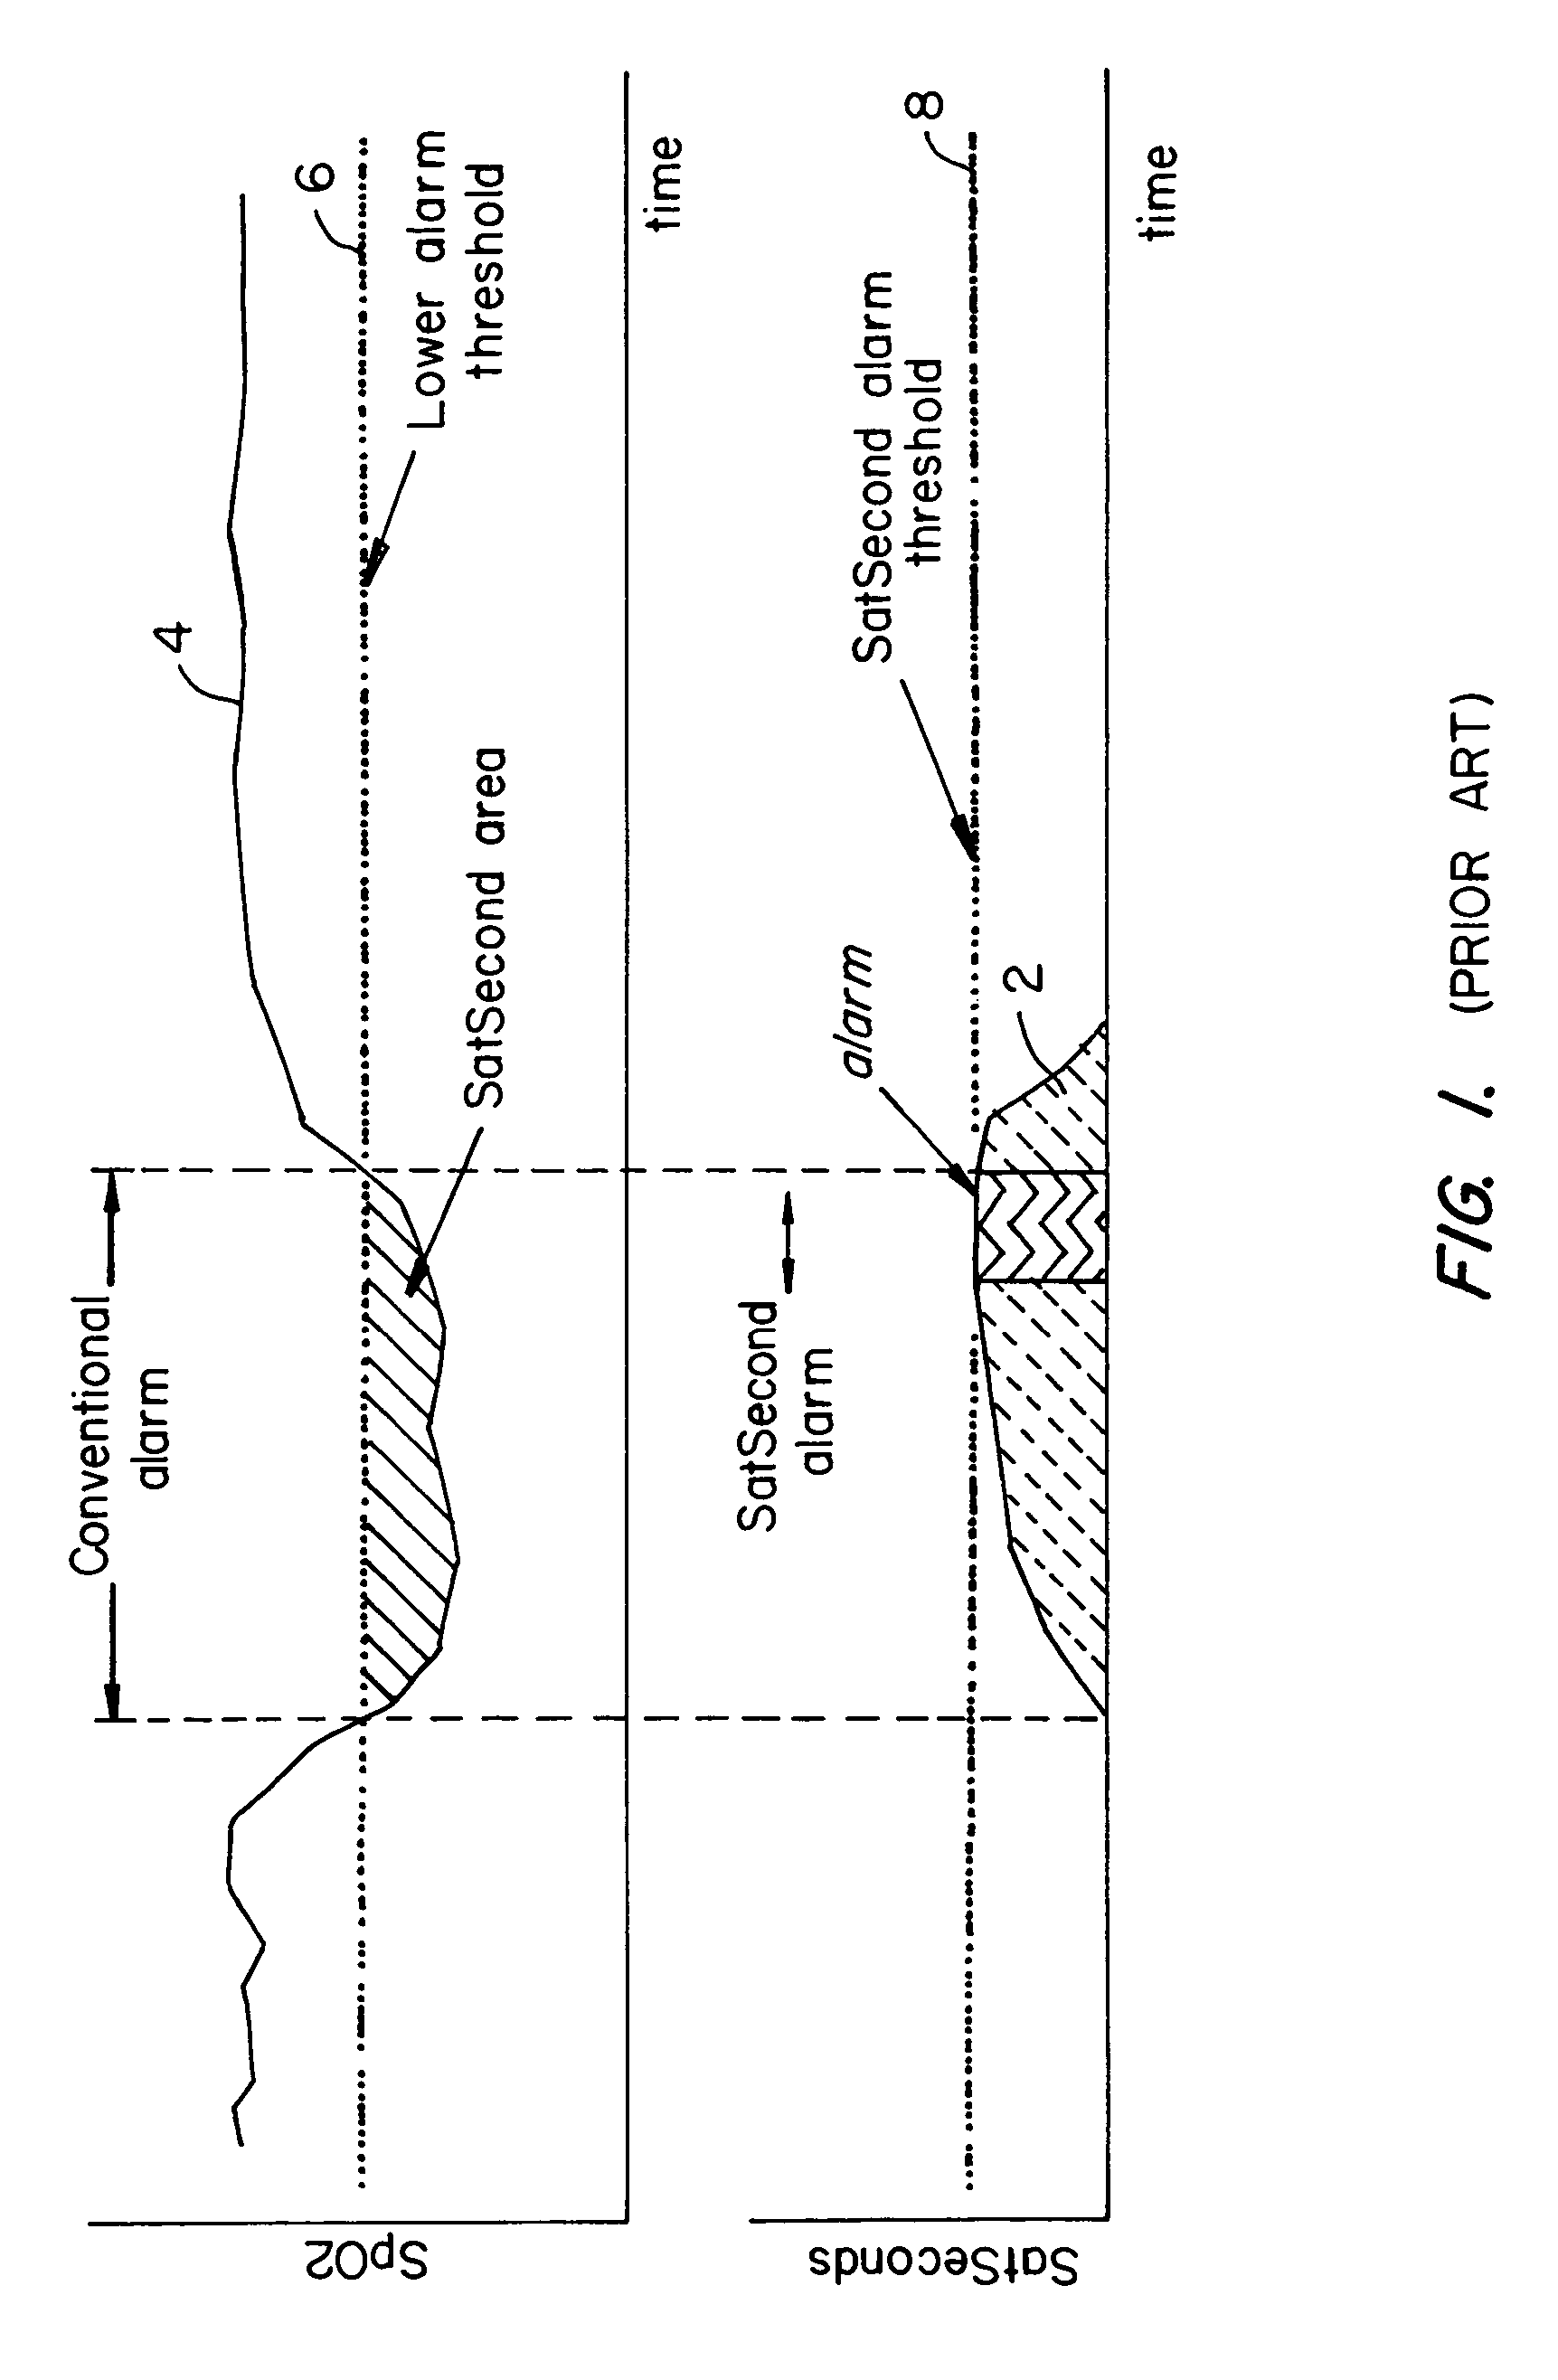
[0041]This example involves a scenario where the SpO2 readings are correct, or in other words, the SpO2 and SaO2 readings are equivalent, since no measurement bias is present. In this example, if the SaO2 value drops 2 points below the fixed threshold (83% SaO2 and SpO2), the SS alarm will sounds in 13 seconds (13 sec*2 sat deviation=26 sat-seconds, which is greater than 25 sat seconds). The ΔSS level triggers at an equivalent point, but is redundant. Both trigger events represent True Positives (TP). A Positive event is an event where the diagnostic device triggers an alarm. A “True” condition refers to the real and actual data supporting the presence of an alarm condition. Thus a TP event is where the diagnostic device senses an event and triggers an alarm where a real clinically significant event was present. A TP event represents an event where the diagnostic device has correctly identified a clinically significant event and triggered an alarm.

[0042]If the S...

example 2

Positively Biased SpO2 Readings

[0043]This example involves a scenario where the SpO2 baseline reads 98%, 3 points high relative to the true SaO2 value due to a reading with positive bias. In this example, if the SaO2 value drops 12 points, that is 2 points below the threshold (83%), an alarm state should occur in 13 seconds (13 sec*2 sat deviation=26 sat-seconds, which is greater than 25 sat seconds), but does not due to the bias resulting in a SpO2 reading of 86%. This results in a False Negative (FN) for the SatSecond (SS) threshold. A “False” event refers to a state sensed by the diagnostic device that is not supported by the real and actual data. Thus a FN event is where a diagnostic device should trigger an alarm but does not. A FN event represents an event where the diagnostic device has missed a clinically significant event and not triggered an alarm. In this example, the SS alarm would never occur since the SpO2 value never drops below 85%. Further, a conventional SpO2 set t...

example 3

Negatively Biased SpO2 Readings

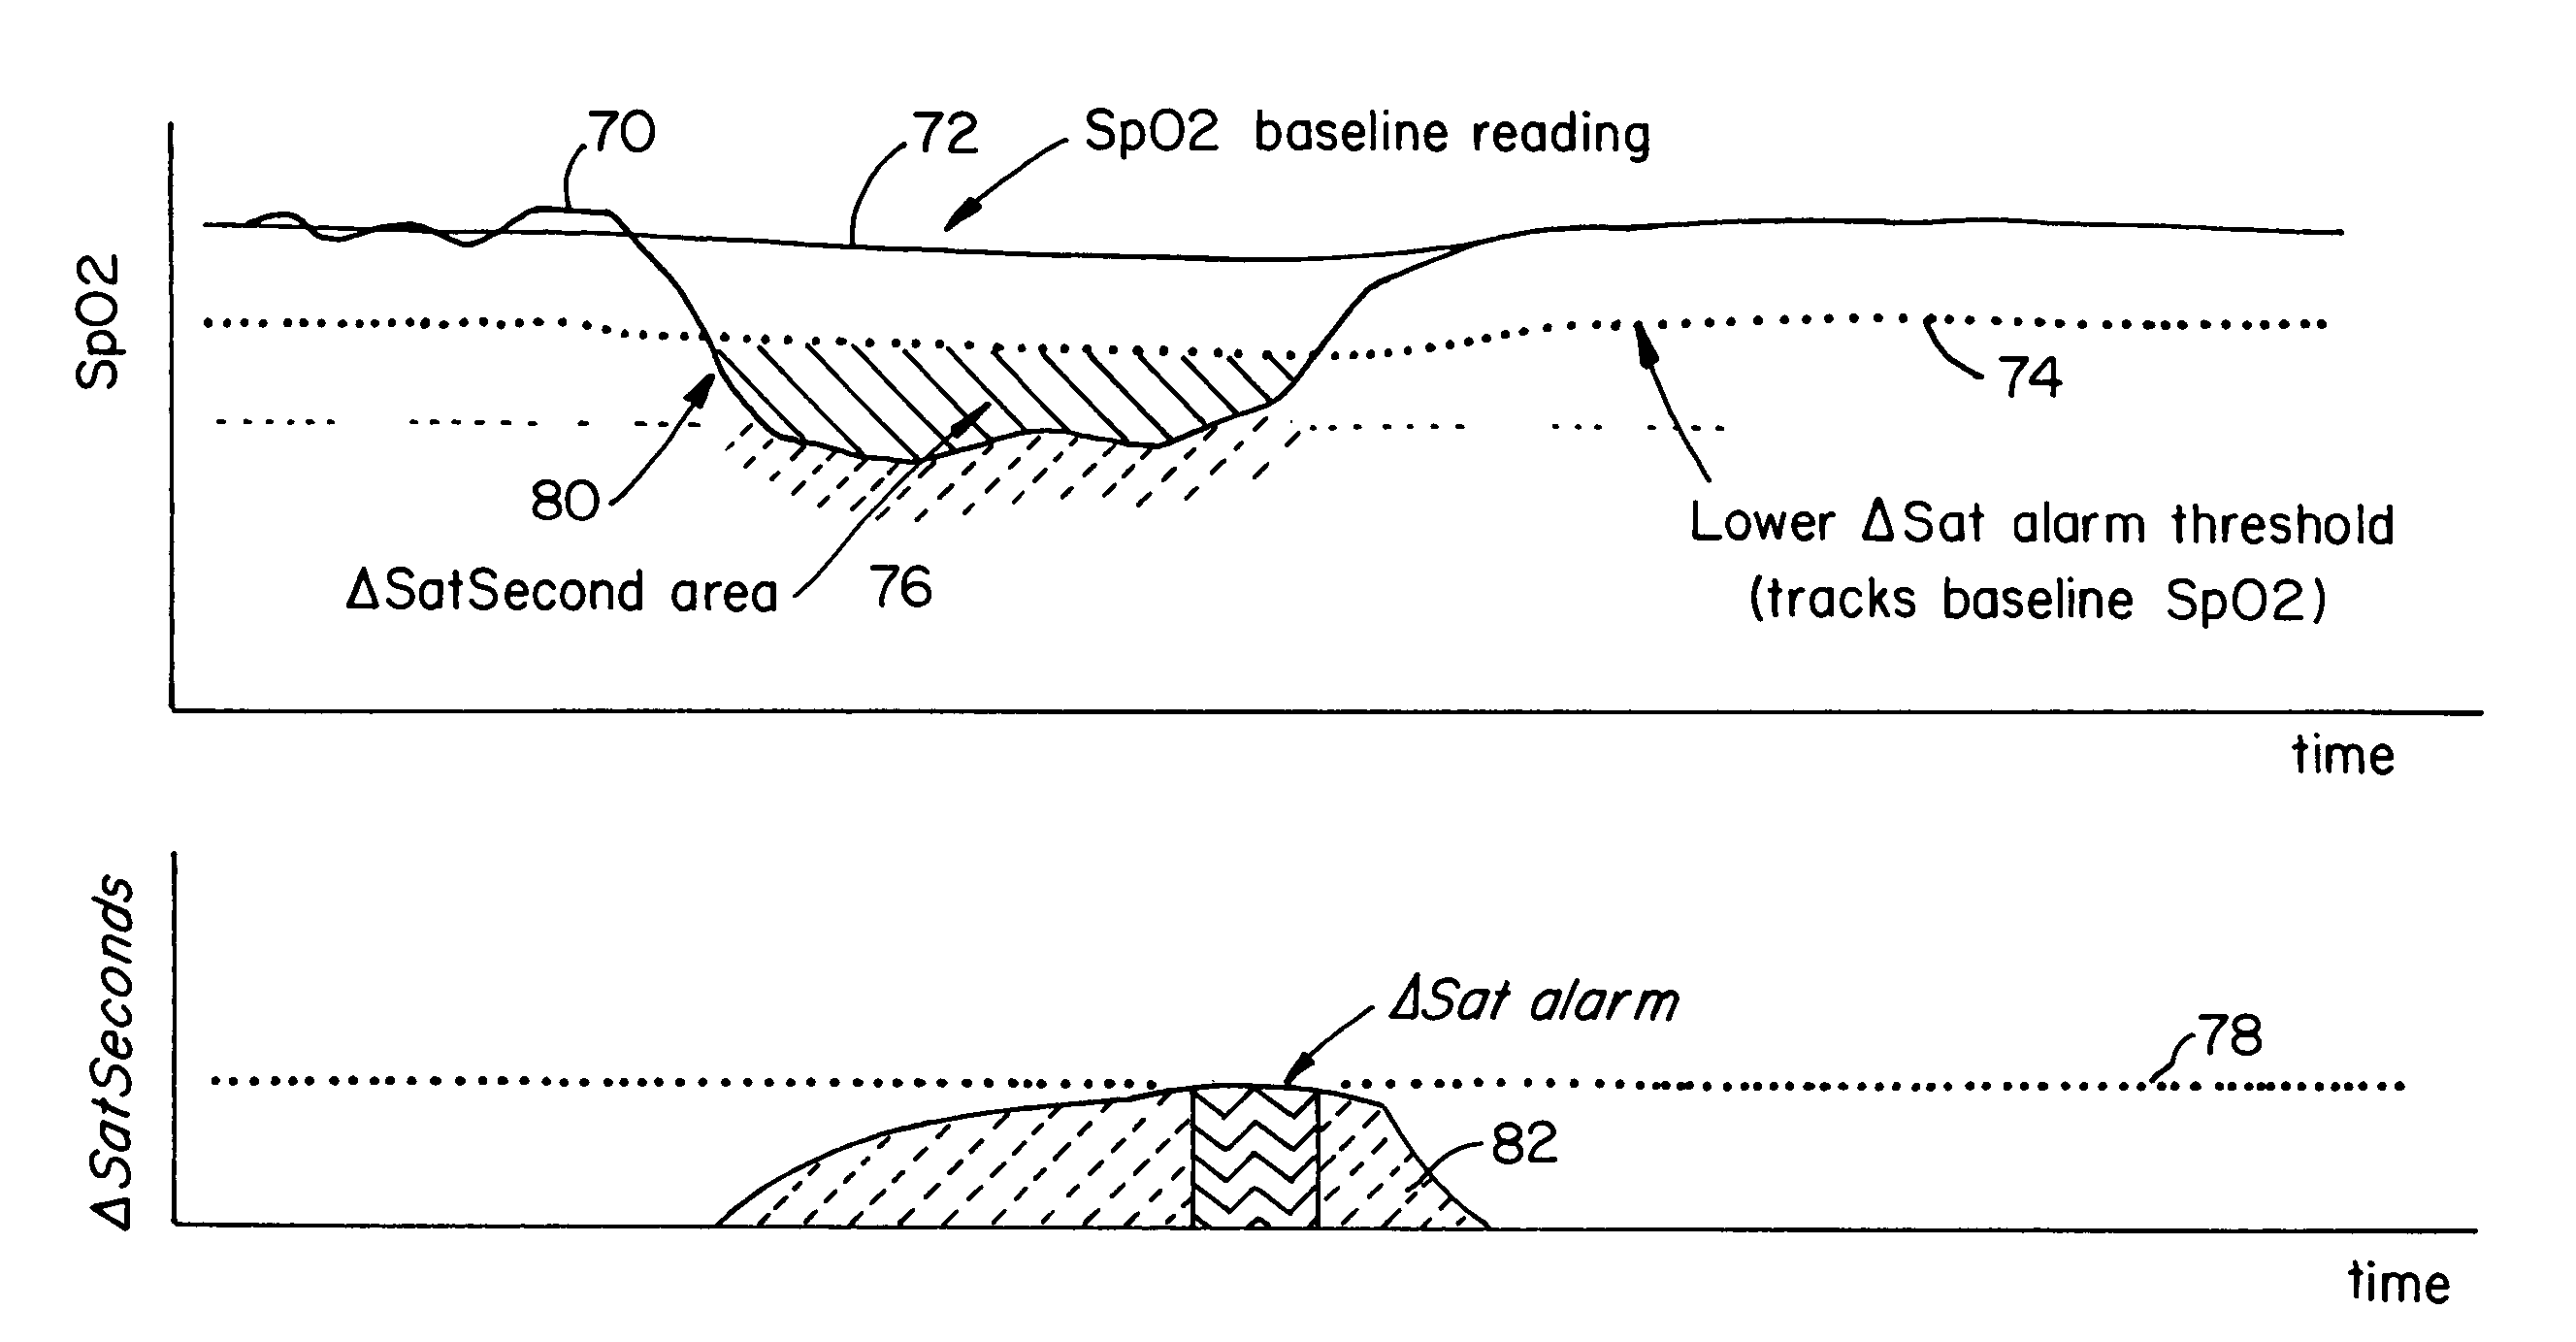
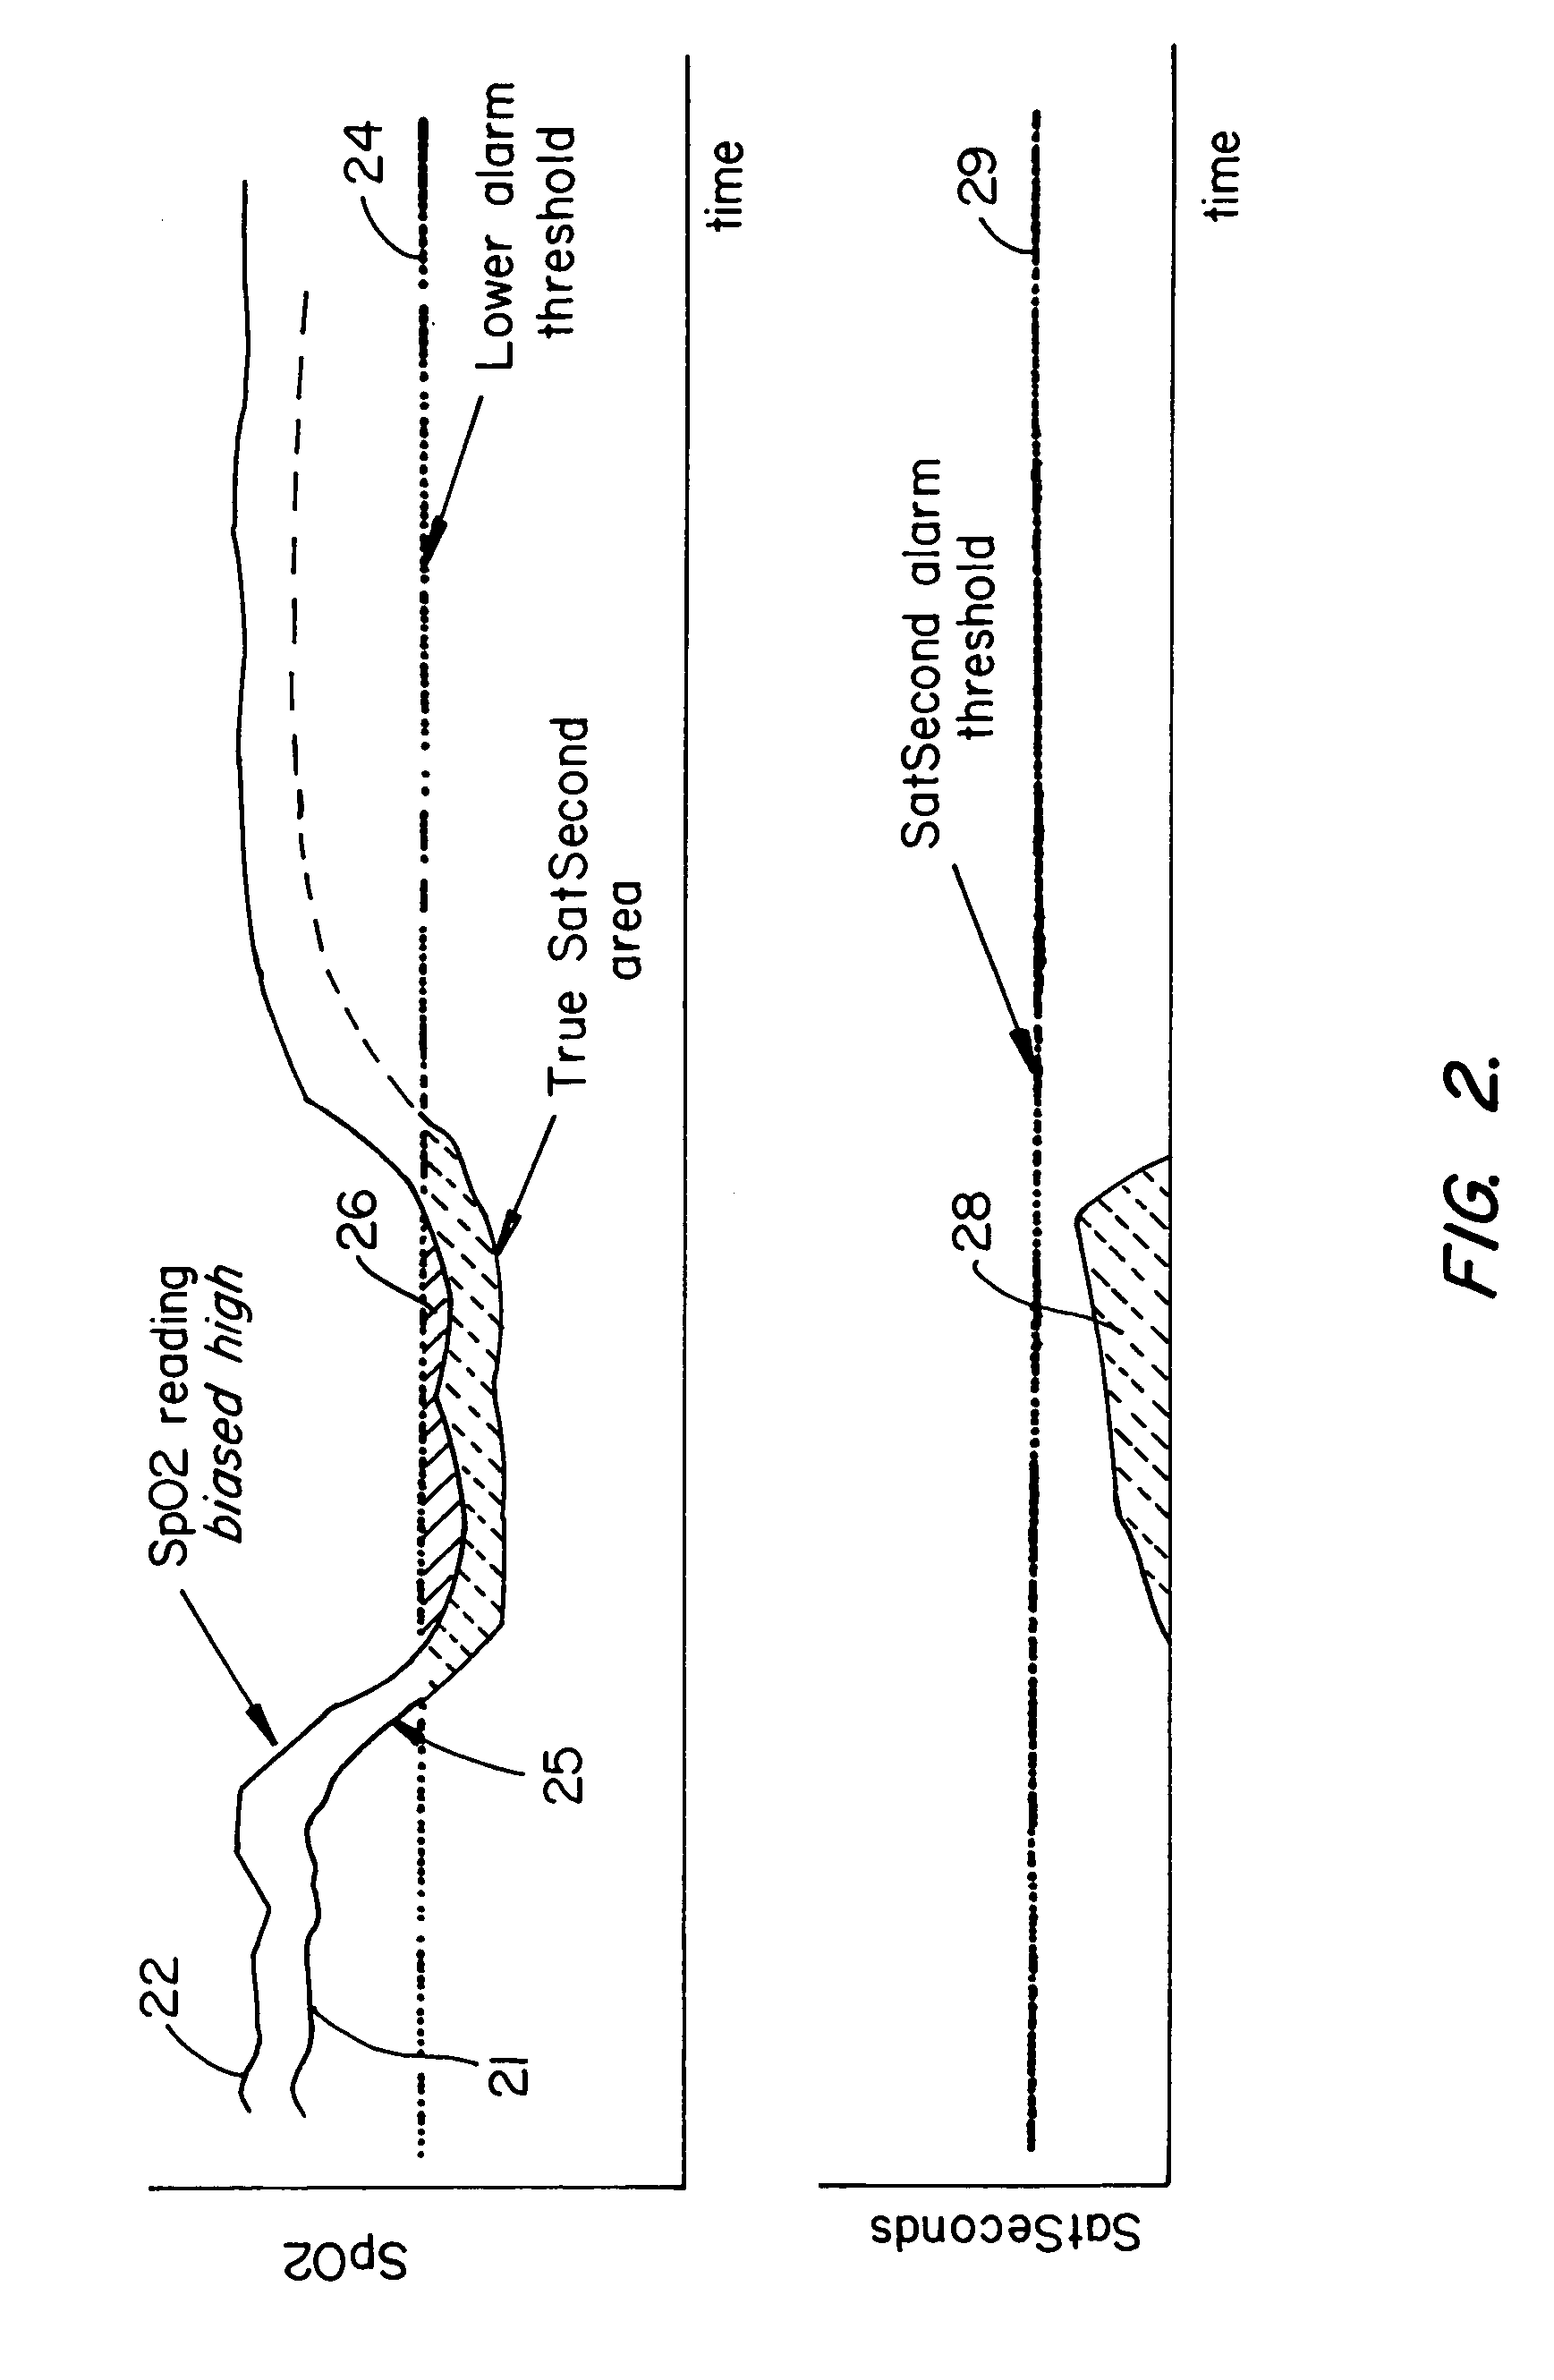
[0046]This example involves a scenario where the SpO2 baseline reads 92%, 3 points low relative to the true SaO2 value due to a negatively biased reading. In this example, if the SaO2 drops 12 points, 2 points below the fixed threshold (83%), with the SpO2 reading 80% due to the negative bias, the SS alarm is triggered after 5 seconds (5 points below threshold* seconds=25 SS). The ΔSS alarm will trigger in 13 seconds (2 points below the 10 point allowable threshold takes 13 seconds to exceed 25 Δsat-seconds). Thus this scenario results in a TP for both alarm methods, though a little sooner than required for the fixed SS alarm.

[0047]If the SaO2 drops 8 points, 2 points above the fixed threshold (87%), the SS alarm should never engage, but it does trigger a FP in 25 seconds due to the 3-point low bias (SpO2=84%). The SpO2 drop from 92% to 84% does not trigger an ΔSS alarm since it does not exceed the 10% necessary threshold drop. Here the advantage of th...


PUM


Abstract

A method and apparatus for controlling alarms in a medical diagnostic apparatus where an alarm is generated when a measured value for a physiological parameter is outside a specified range. The method continuously calculates a baseline value, and establishes dynamic thresholds that are related to and continuously track the baseline value. The method determines the amount of time the measured value is past the dynamic threshold, and the amount by which the threshold is passed. Alarms are triggered based upon a combination of the amount of time and the amount by which the threshold is passed. Preferably, the combination is an integral or some function of an integral.

Description

[0001]This application is a continuation of application Ser. No. 09 / 910,700, filed Jul. 19, 2001, now U.S. Pat. No. 6,754,516.BACKGROUND OF THE INVENTION[0002]The present invention relates to alarms in medical diagnostics apparatus, and in particular to improvements in reducing nuisance alarms for pulse oximeters.[0003]A typical pulse oximeter measures two physiological parameters, percent oxygen saturation of arterial blood hemoglobin (SpO2) and pulse rate. For alarm purposes, low and high thresholds are set for both SpO2 and pulse rate, defining normal ranges within which it is desired to maintain the patient. For example, with a neonate it might be desired that sat should remain between 85 and 95 percent and pulse rate should remain between 120 and 170 beats per minute. From the two measured parameters, typically four alarm types can be generated, low sat, high sat, low rate, and high rate. In some pulse oximeters, an alarm begins immediately when either sat or rate goes outside ...

Claims


Application Information

Patent Timeline
Patent Type & Authority Patents(United States)
IPC IPC(8): A61B5/00A61B5/0245A61B5/145A61B5/1455
CPCA61B5/02455A61B5/14551A61B5/746G08B21/02A61B2560/0276
Inventor MANNHEIMER, PAUL D.
Owner TYCO HEALTHCARE GRP LP
Why Eureka
Try Eureka