System and methods for display of time-series data distribution

a time-series and data technology, applied in the field of system and methods for monitoring a set of metrics, can solve the problems of limiting the number of histograms that can be displayed at the same time, reducing the number of orders and profits, and not always useful for discovering trends

Active Publication Date: 2007-05-15
ATERNITY LLC
View PDF157 Cites 56 Cited by
  • Summary
  • Abstract
  • Description
  • Claims
  • Application Information

AI Technical Summary

Benefits of technology

[0010]In view of the foregoing, there is a need for a system and methods for computing and displaying data distribution information for large sets of tim

Problems solved by technology

Without fast, efficient transactions, orders dwindle and profits diminish.
Unfortunately, there are a number of drawbacks to using conventional histograms to view time series data, such as the complex metrics discussed above.
First, there is often a need to display multiple histograms on a screen when working with time series data, such as metrics.
Each histogram typically requires a large amount of screen space, limiting the number of histograms that can be displayed at the same time.
Additionally, histograms are not always useful for discovering trends in data over time, since it may be difficult to see long-term trends in data by viewing a set of standard histograms side-by-side or stacked vertically.
Unfortunately, even when these steps are taken, it may be difficult to display more than five or six histograms on a single display.
It would be impractical in such sys

Method used


Image

  • System and methods for display of time-series data distribution
  • System and methods for display of time-series data distribution
  • System and methods for display of time-series data distribution

Examples


Embodiment Construction

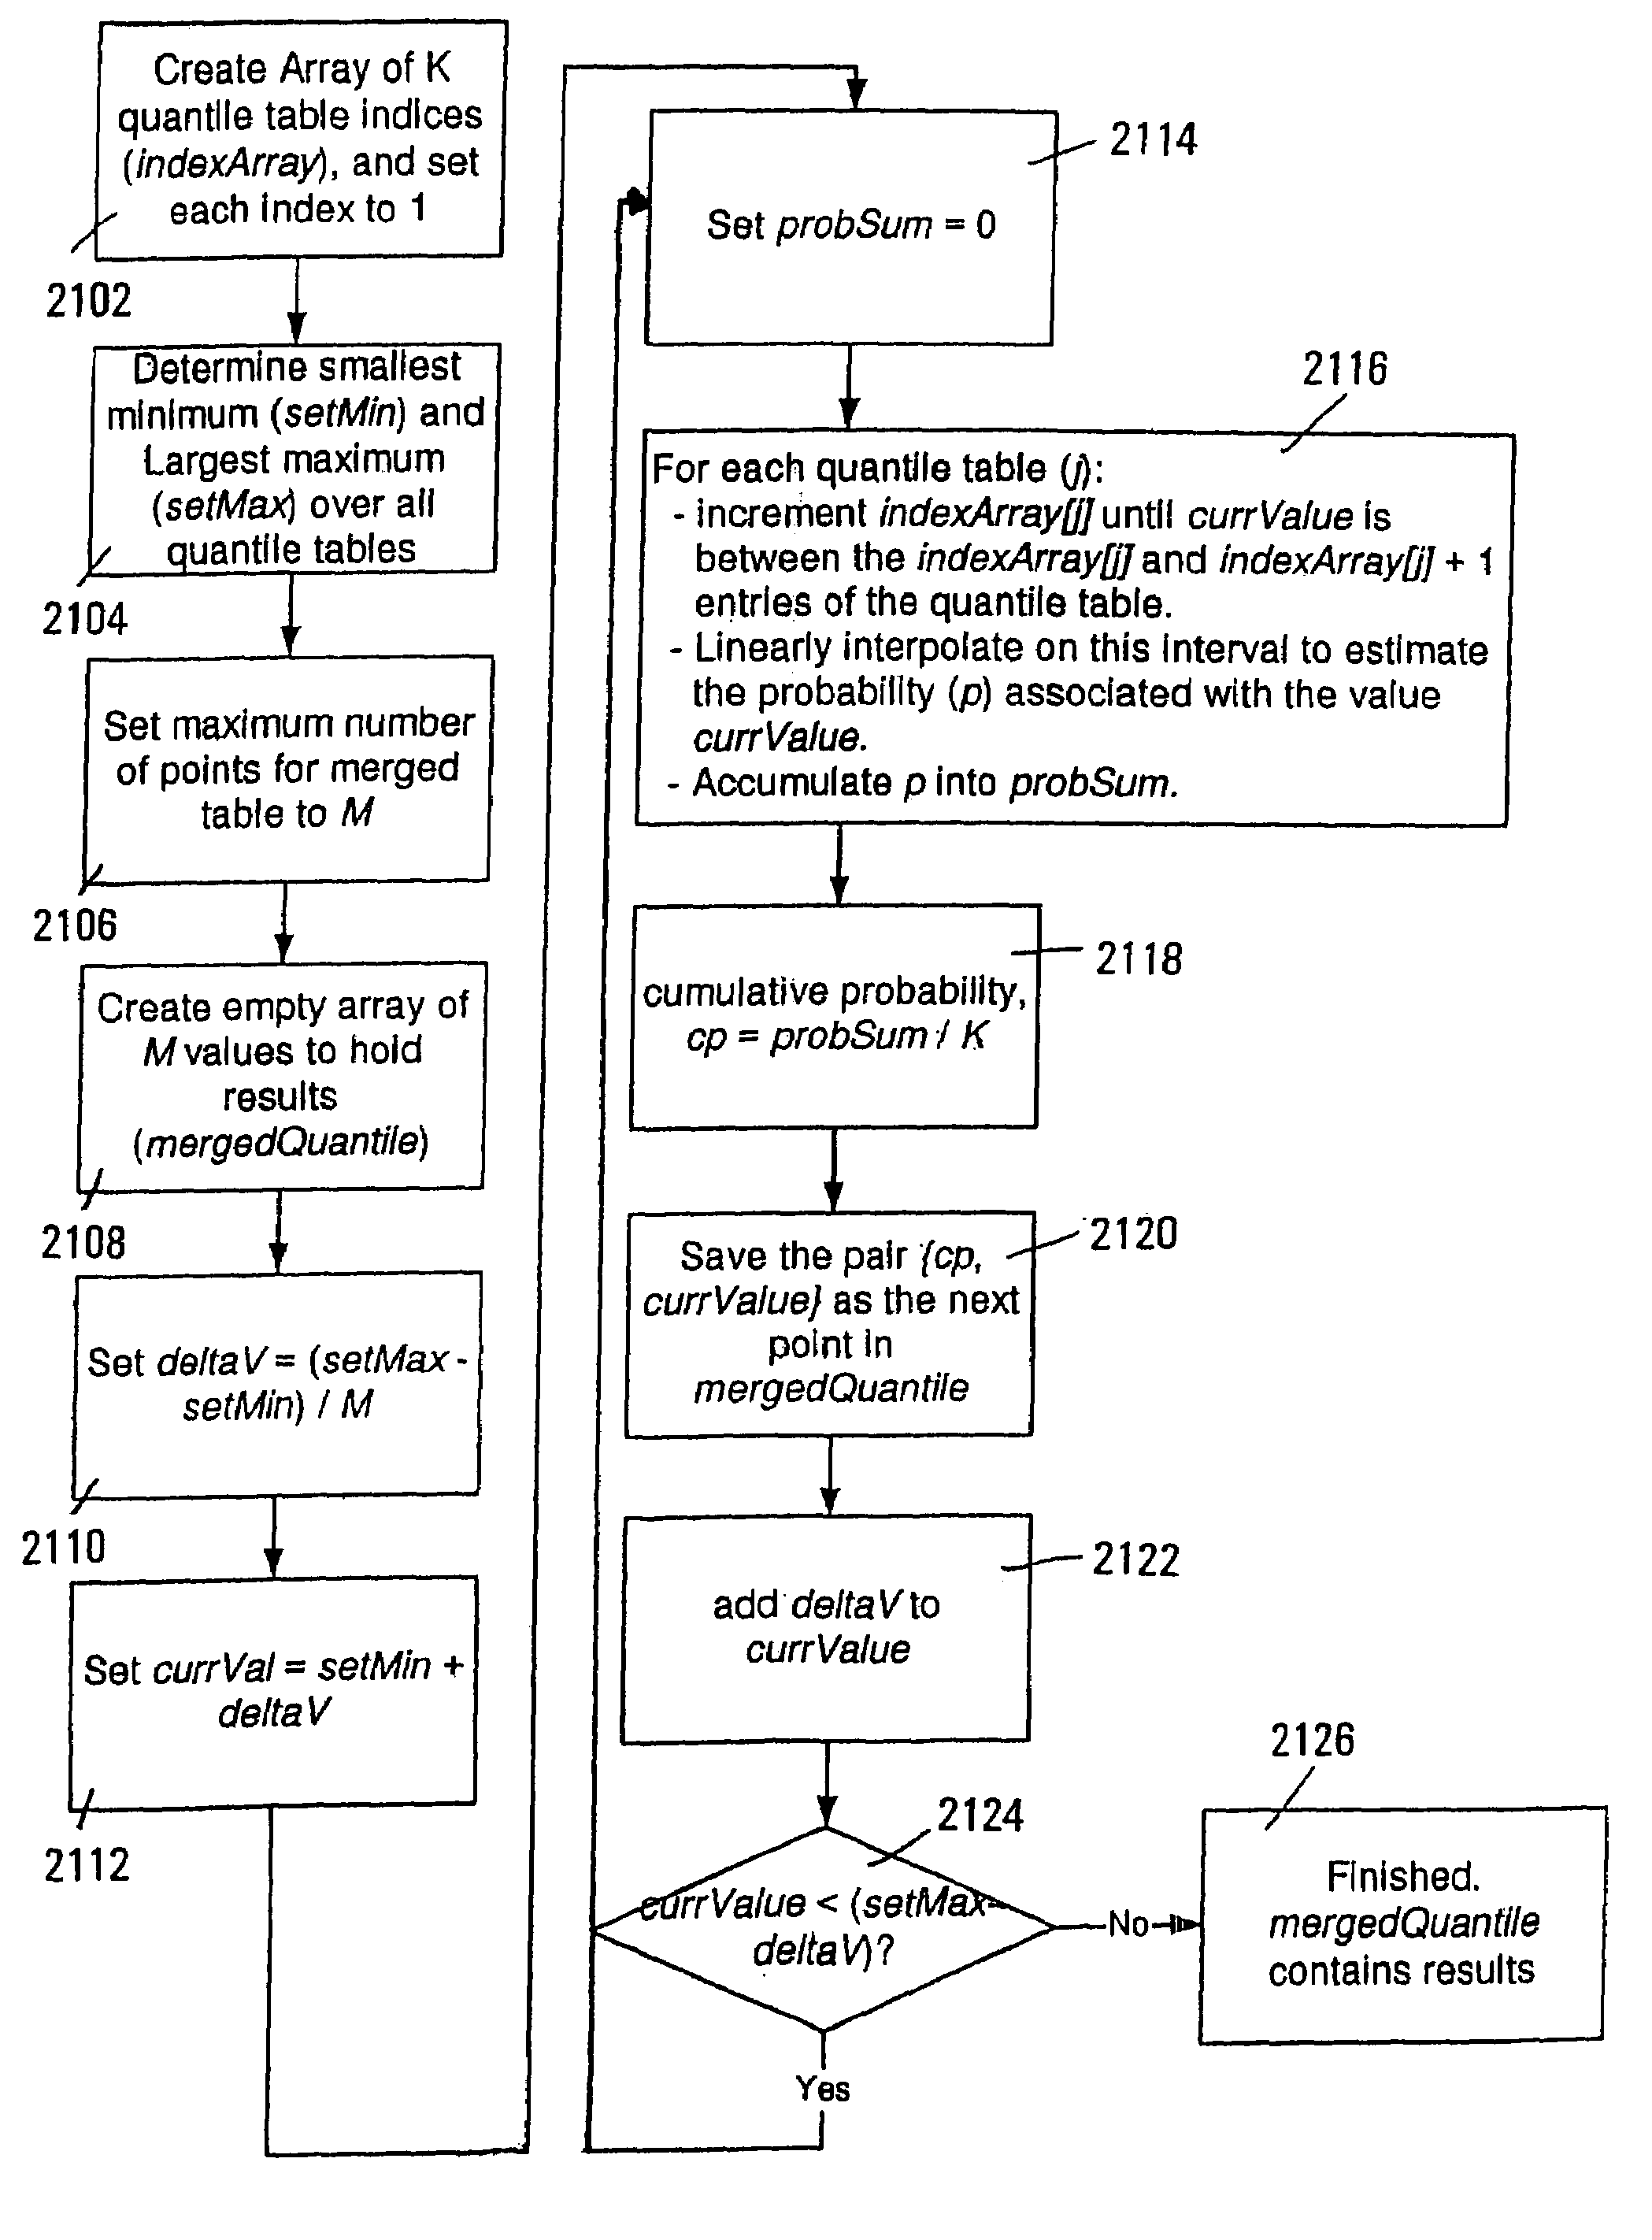
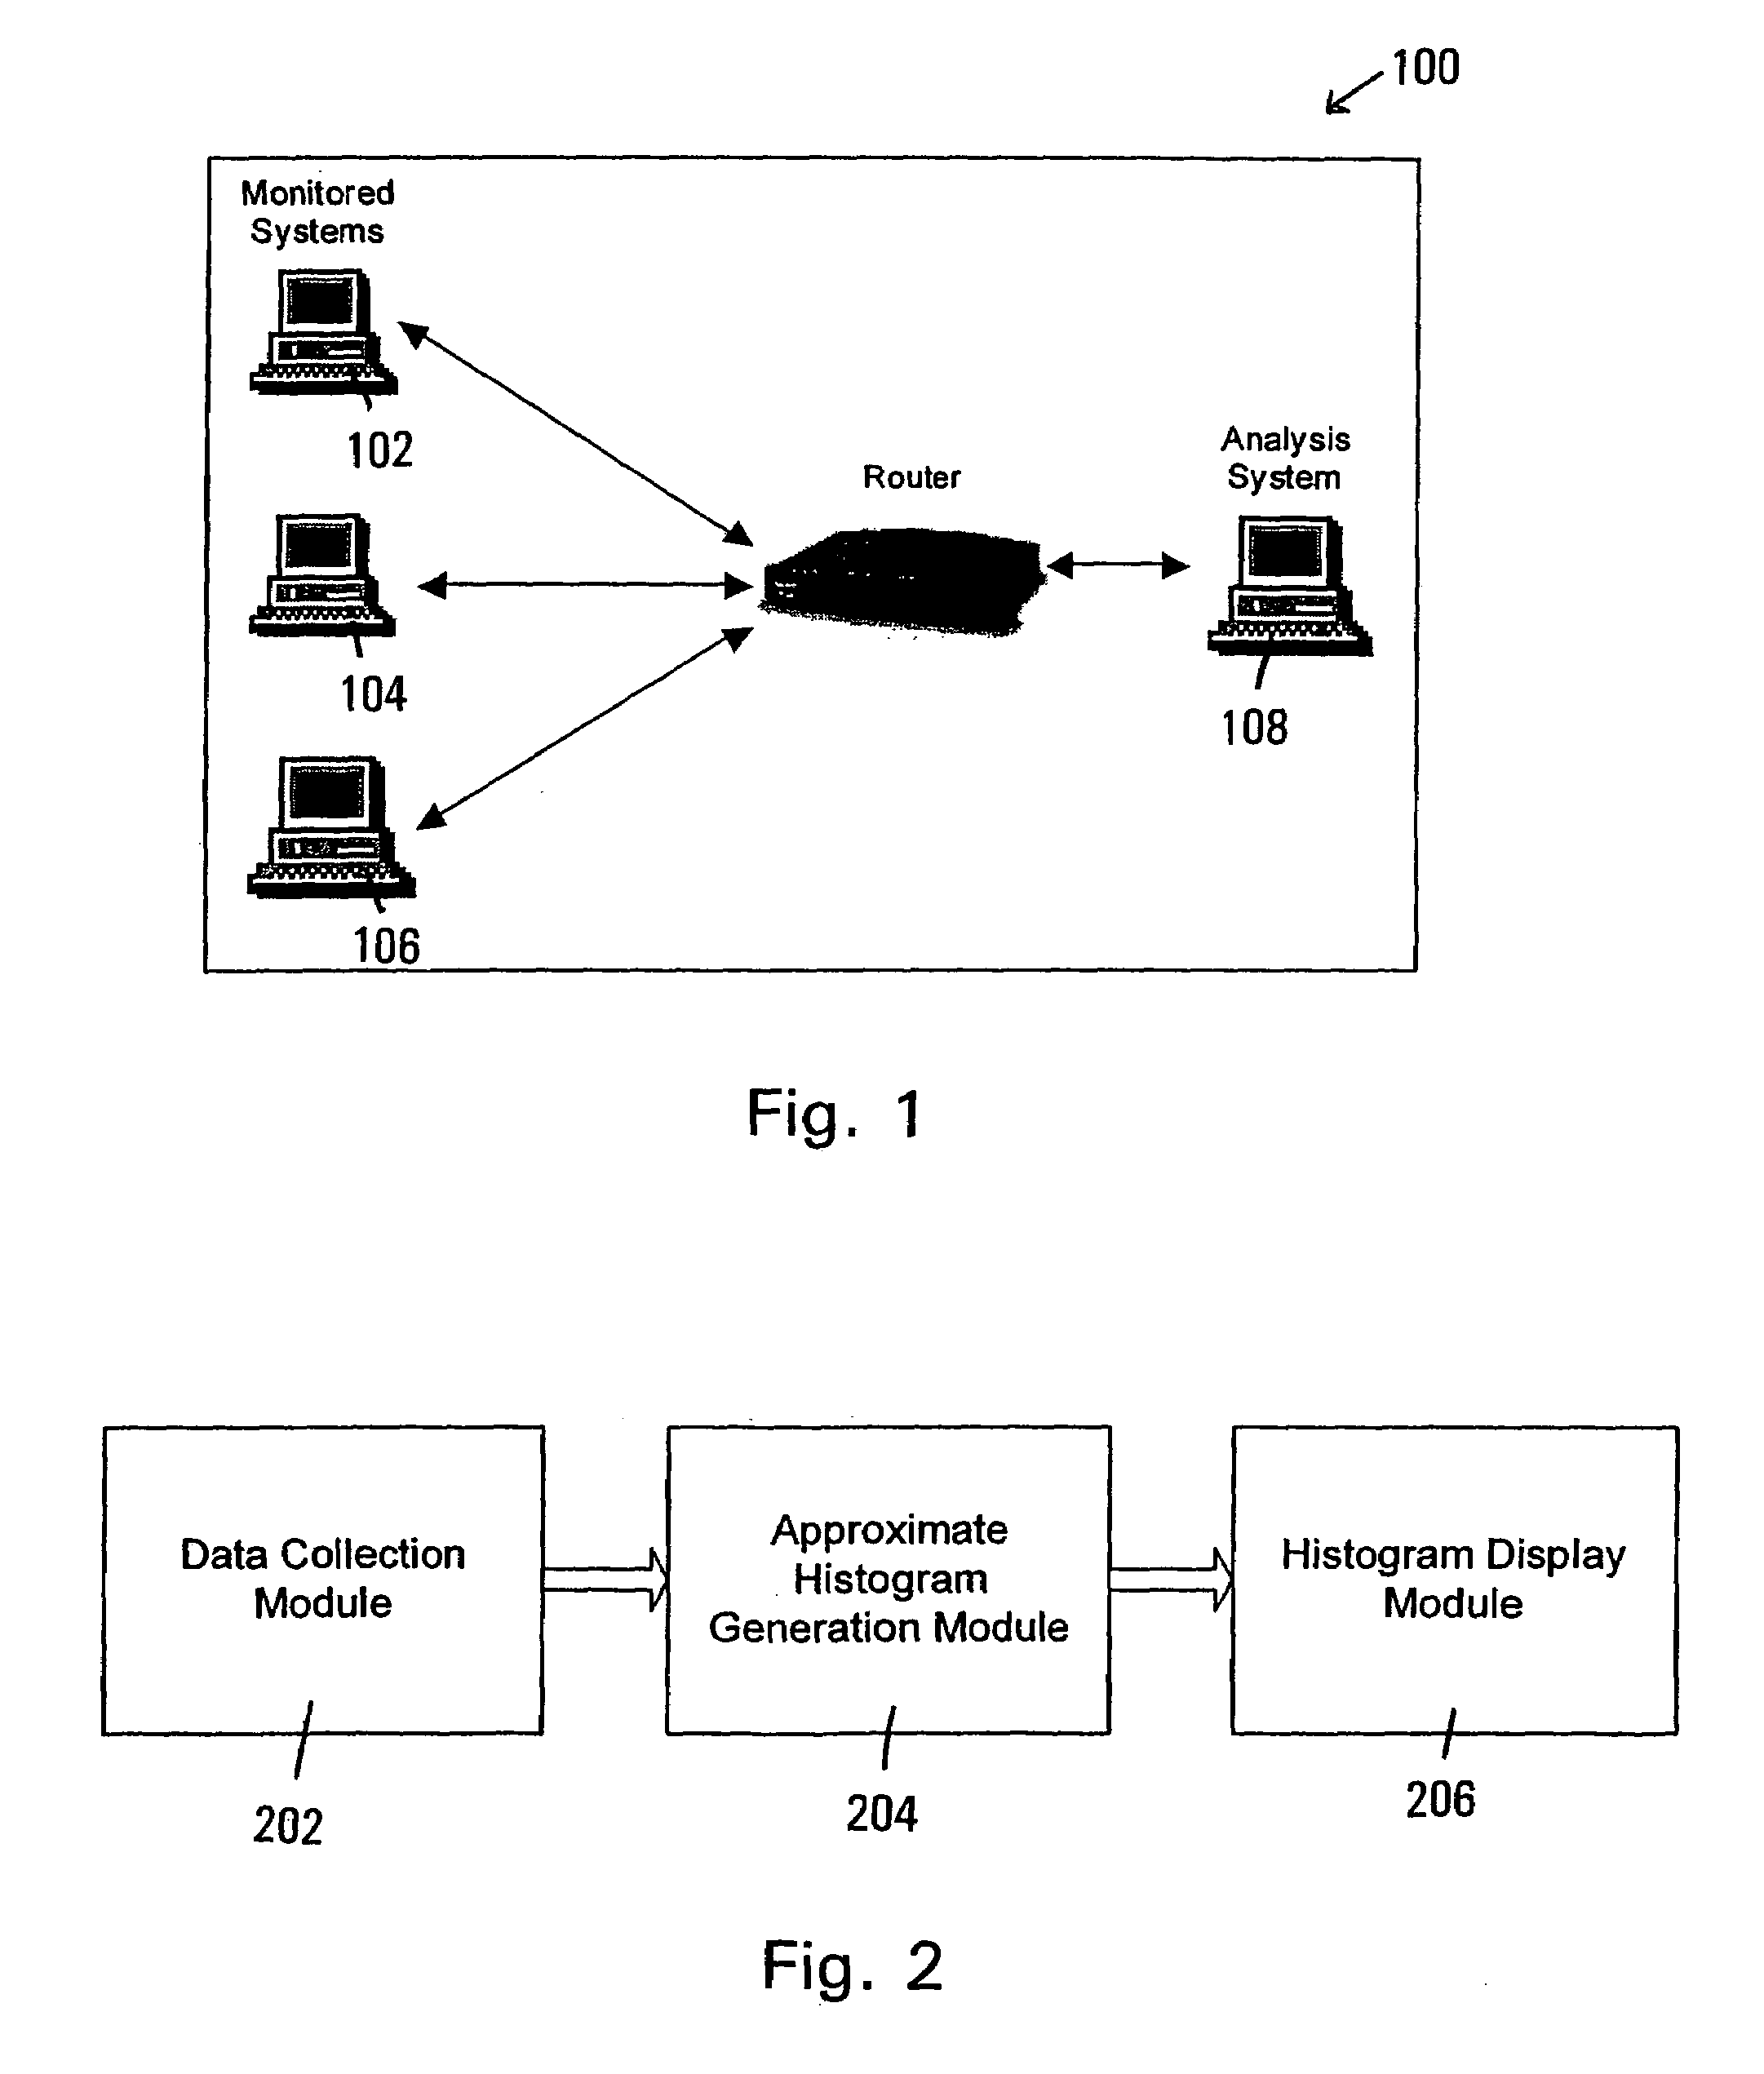
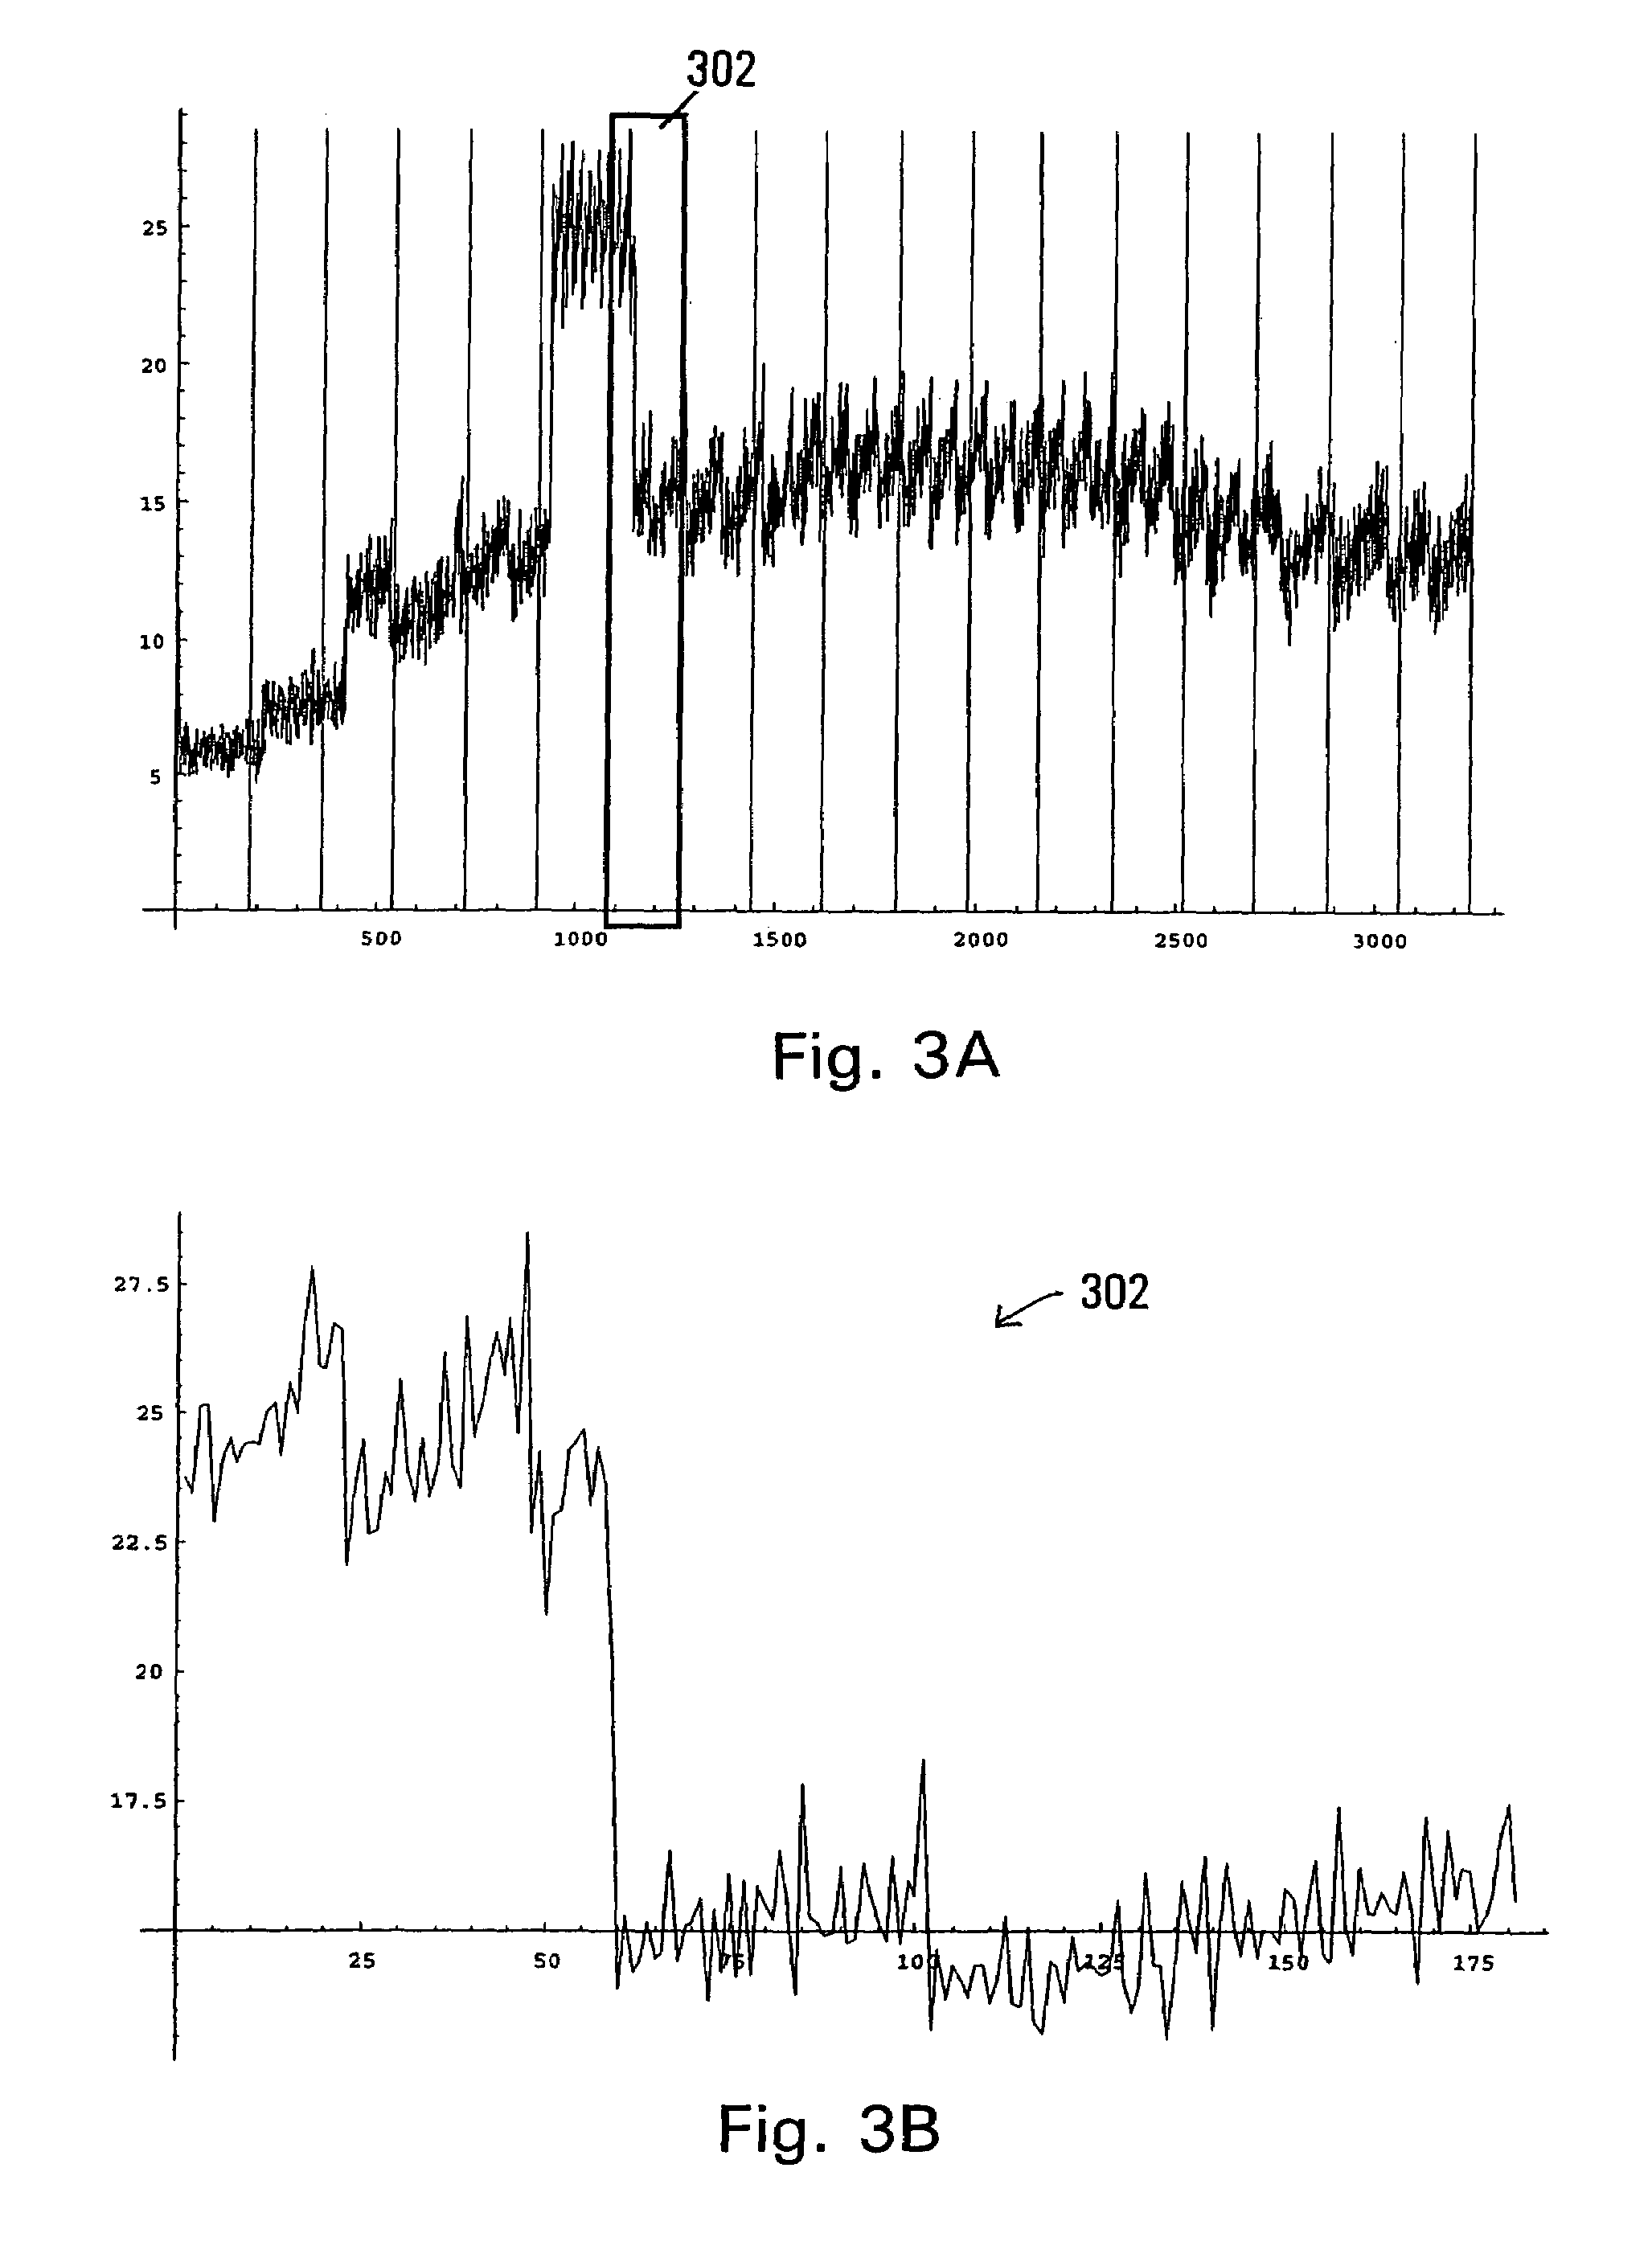
[0045]As shown in the drawings for the purposes of illustration, the invention may be embodied in a system that collects, analyzes, and reports performance metrics for systems such as, for example, complex transaction-based structures typified by (but not limited to) e-commerce systems. In broad overview, the invention relates to the monitoring of a set of system performance metrics, such as transaction response time, throughput, availability, etc. The system receives metric data and generates and displays a set of “approximate histograms” from the quantile function of a time series segment. An approximate histogram is an estimation of the histogram of an original (i.e., complete) data set.

[0046]In addition to generating “approximate histograms,” an embodiment of the invention also displays a set of histograms for successive time intervals using a set of offset stacked bar charts. The resulting display provides a useful visual tool for tracking changes in the central values of a met...


PUM


Abstract

A system and methods for displaying data distribution information for time-series data is described. The methods include computing a condensed quantile function that may be used to generate approximate histograms for the time-series data, while decreasing the data storage requirements for generating a series of histograms for time-series data. The methods further include displaying the data distribution information using stack-bar histograms, many of which may be shown in a single display to permit a user to discern trends in the data distribution information. Methods for merging condensed quantile function tables are also described.

Description

CROSS-REFERENCE TO RELATED CASES[0001]This application claims priority to and the benefit of, and incorporates herein by reference, in its entirety, provisional U.S. patent application Ser. No. 60 / 322,021, filed Sep. 13, 2001. This application also incorporates herein by reference, in their entirety, U.S. patent application Ser. No. 10 / 186,401, filed Jul. 1, 2002, and Ser. No. 10 / 198,689, filed Jul. 18, 2002.FIELD OF THE INVENTION[0002]The invention relates to a system and methods for monitoring a set of metrics. More particularly, the invention provides a system and methods for computing and displaying data distribution information for metrics.BACKGROUND OF THE INVENTION[0003]Transactions are at the heart of e-business. Without fast, efficient transactions, orders dwindle and profits diminish. Today's e-business technology, for example, is providing businesses of all types with the ability to redefine transactions. There is a need, though, to optimize transaction performance and th...

Claims


Application Information

Patent Timeline
IPC IPC(8): G06F17/18G06F11/32G06F11/34
CPCG06F11/323G06F17/18G06F11/3452Y10S707/99936Y10S707/99942Y10S707/99937
Inventor MCGEE, JOHN J.COURTEMANCHE, MICHAEL B.BECK, RALPH L.
Owner ATERNITY LLC
Why Eureka
Try Eureka