
Method and apparatus for time series graph display

a time series graph and display method technology, applied in the field of line graphs, can solve the problems of affecting the aspect ratio of the graph, the device intrinsically limits the amount of graph data displayable, and the graph is too small, too flat, or too jagged, so as to increase the user's speed in determining the graph point value, and preserve the natural aspect ratio

Inactive Publication Date: 2007-11-06
CARETRENDS +1
View PDF51 Cites 31 Cited by
  • Summary
  • Abstract
  • Description
  • Claims
  • Application Information

AI Technical Summary

Benefits of technology

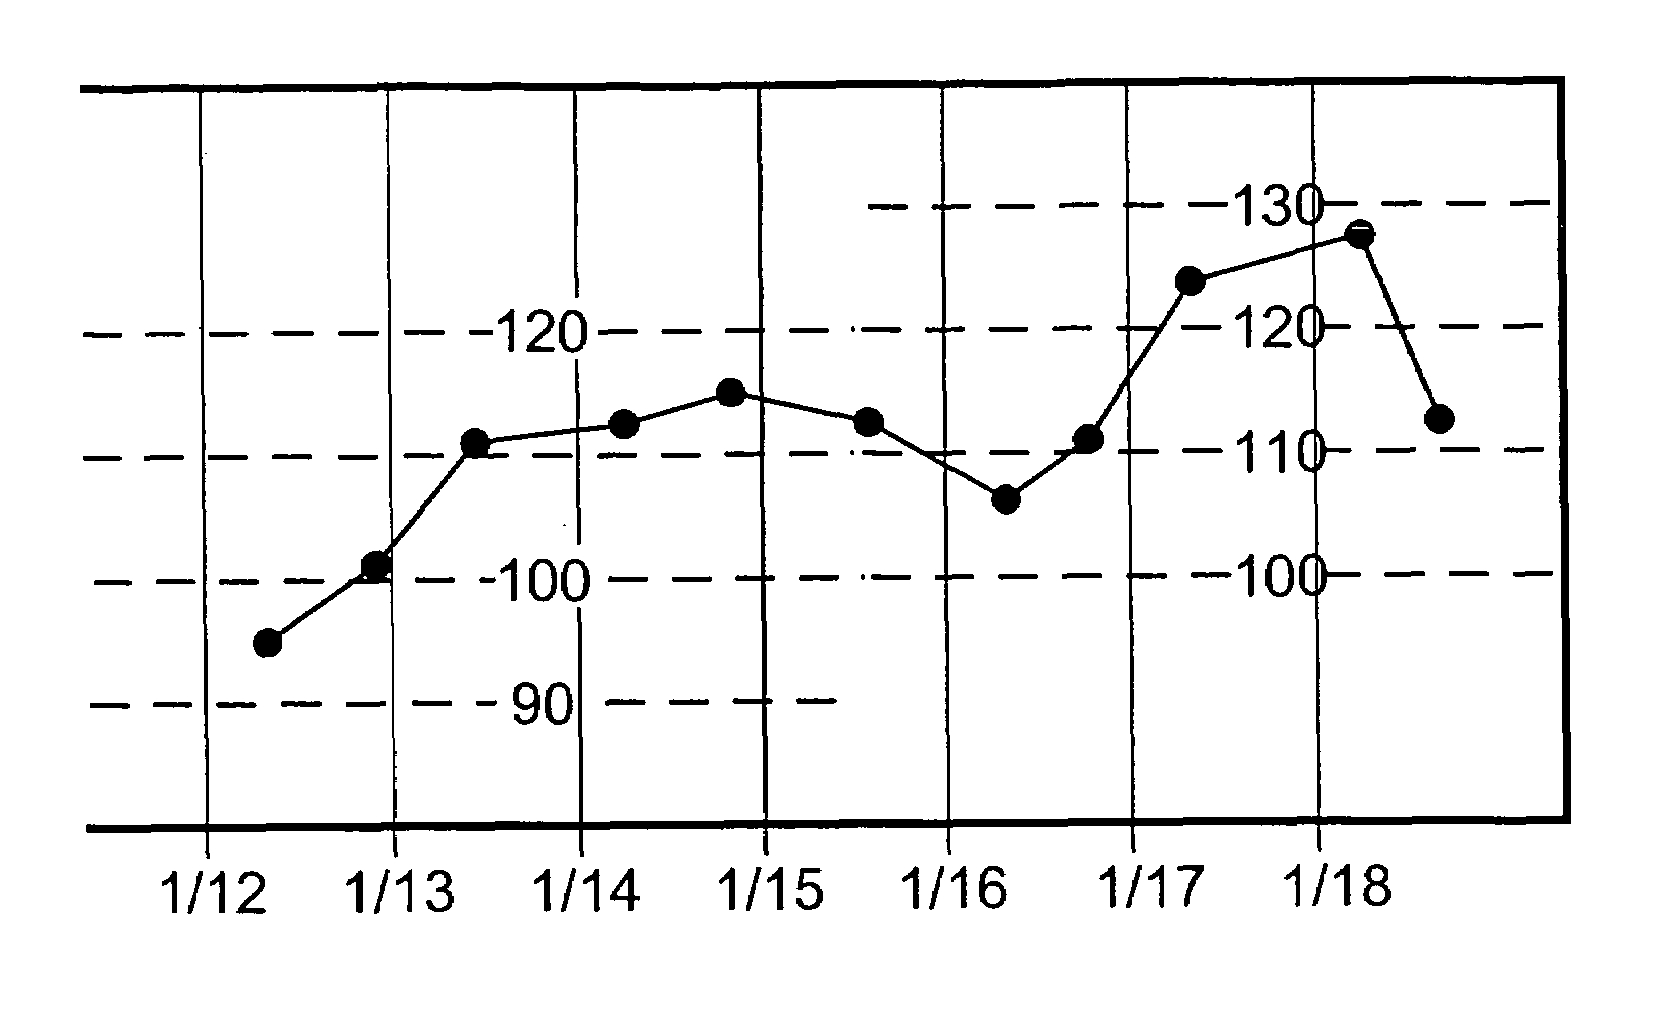
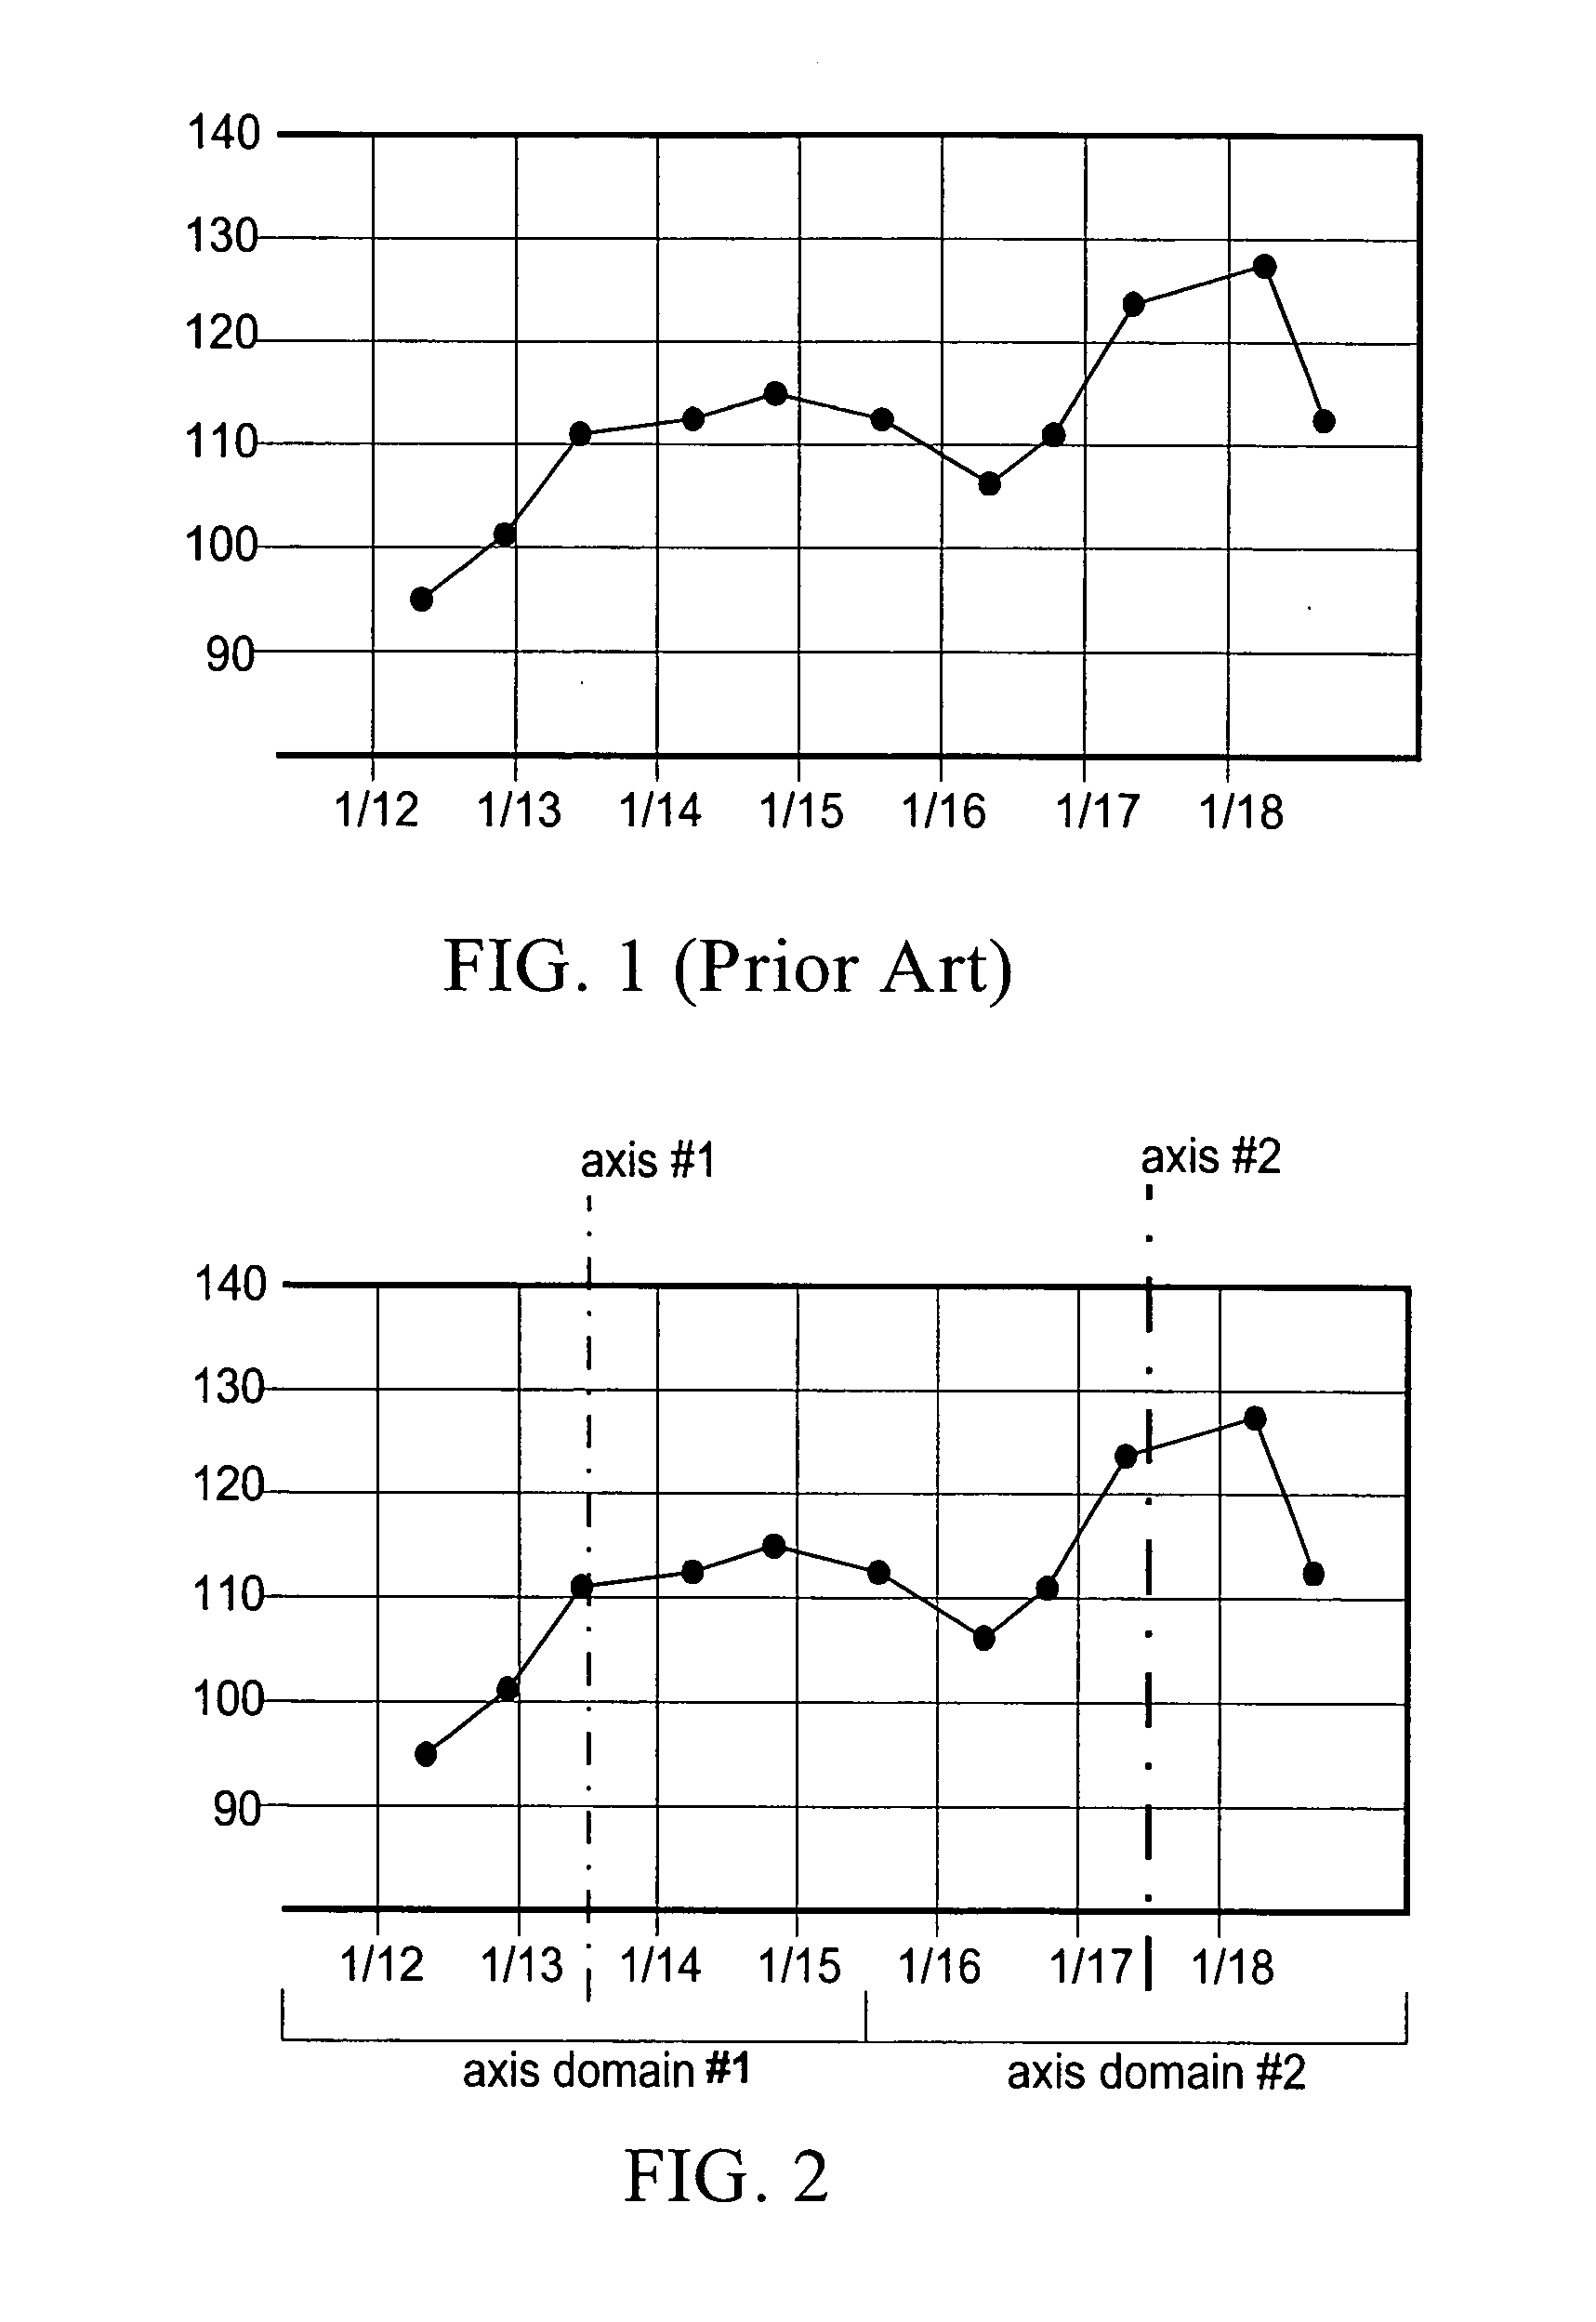
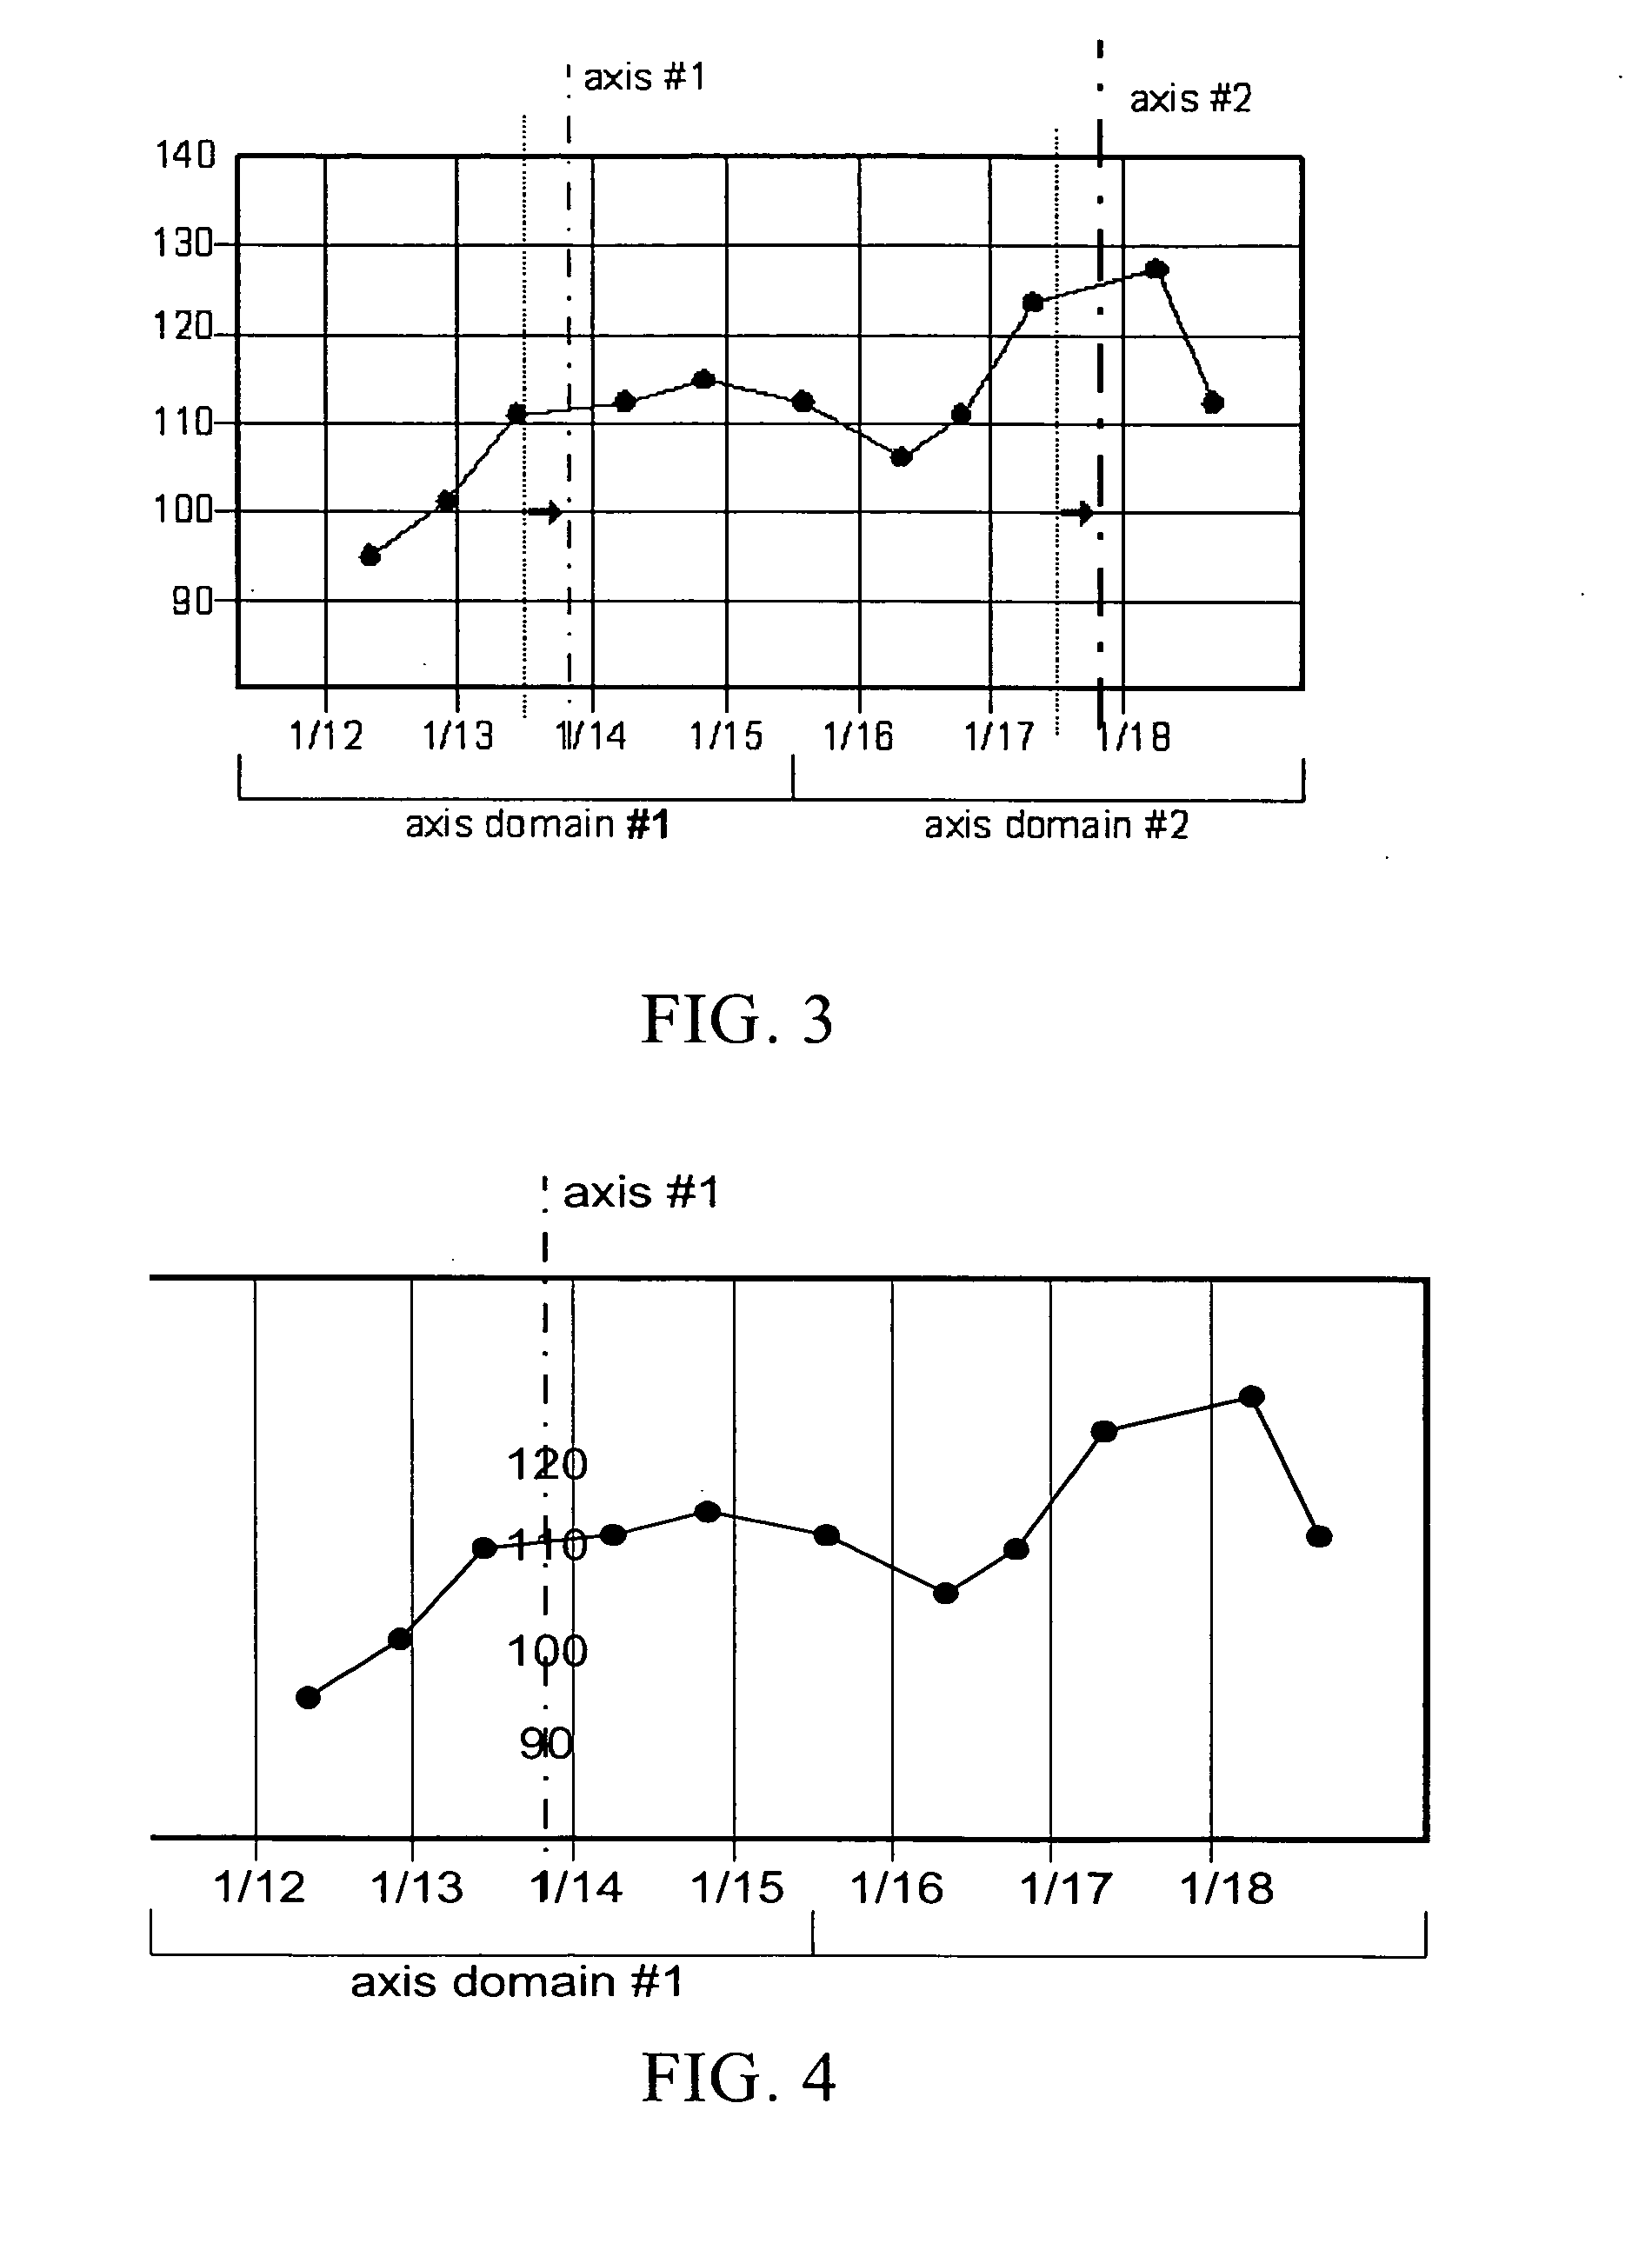
"The patent is about a method for creating line graphs that are long in one direction but narrow in another direction. The method helps to make these graphs more effective by making the tick marks and lines of the graph easier to see and estimate the values of the points. The invention also addresses the limitations of display devices by providing different approaches for displaying the graph. Prior techniques include displaying the tick marks in a frame around the graph, requiring the user to scroll back and forth to see the points of interest. The invention also allows for the user to move the screen cursor to the point of interest and display the exact range value of the point, but this approach requires the user to physically move the screen cursor and can lead to confusion and cluttered appearance when display space is limited or the points are intrinsically spaced closely."

Problems solved by technology

Moreover, when such graphs are displayed on computer display units, the size and resolution of the display device intrinsically limit the amount of graph data displayable.
Both of these approaches suffer from the problem that the tick marks remain far from the points under inspection and may require the user to scroll back and forth around the graph using the affordances of the interface to be able to see both the tick marks and the points of interest.
While removing the need to scroll, this approach causes the graph's aspect ratio to be altered and may produce a graph that is too small, too flat, or too jagged relative to the natural presentation aspect ratio of the graph.
A zoom function is often provided to magnify a section of the graph, but at the cost of hiding surrounding portions of the graph.
This works well when the points are spaced nicely, but can lead to confusion and a cluttered appearance when display space is limited or the points are intrinsically spaced closely, or when the spacing of the points is irregular and a region of the graph contains a much higher than average concentration of points.

Method used


Image

  • Method and apparatus for time series graph display
  • Method and apparatus for time series graph display
  • Method and apparatus for time series graph display

Examples


Embodiment Construction

[0049]The description that follows is presented to enable one skilled in the art to make and use the present invention, and is provided in the context of a particular application and its requirements. Various modifications to the disclosed embodiments will be apparent to those skilled in the art, and the general principals discussed below may be applied to other embodiments and applications without departing from the scope and spirit of the invention. Therefore, the invention is not intended to be limited to the embodiments disclosed, but the invention is to be given the largest possible scope which is consistent with the principals and features described herein.

[0050]It will be understood that in the event parts of different embodiments have similar functions or uses, they may have been given similar or identical reference numerals and descriptions. It will be understood that such duplication of reference numerals is intended solely for efficiency and ease of understanding the pres...


PUM


Abstract

A novel technique for annotating a time series graph with embedded tick marks and grid lines and method for selecting and placing such tick marks and lines within such graph. This method allows for the creation of large time series graphs that allow simultaneous perception of graph trends and features as well as the visual estimation of the values of graph point(s). Graphs produced by this method do not require the excessive user effort, time, or manipulation of graphical user interface affordances that are entailed in these two perceptual tasks with graphs annotated using prior art methods. Additionally, this method allows for minimal visual clutter of the graph.

Description

RELATED APPLICATION[0001]This application claims priority of, and includes by reference, U.S. provisional application Ser. No. 60 / 537,004 having a filing date of Jan. 20, 2004.FIELD OF THE INVENTION[0002]This invention relates generally to the creation of line graphs depicting time series, specifically the creation of line graphs when the natural layout of the graph would result in a graph that is extremely wide in the X dimension compared to its height in the Y dimension.BACKGROUND OF THE INVENTION[0003]Line graphs consist of a series of points, connected by lines and drawn on a 2 or 3 dimensional Cartesian grid. A point represents a (domain, range) pair, in which the domain is often (but not necessarily) time. The points in this set are connected with lines such that a pair of points representing (d1,r1) and (d2,r2) are connected if and only if no point exists having a domain value >=d1 and <=d2.[0004]In the ordinary Cartesian grid, the domain and range values for a given po...

Claims


Application Information

Patent Timeline
Patent Type & Authority Patents(United States)
IPC IPC(8): G06T11/20
CPCG06T11/206
Inventor GOGGIN, DAVID E.
Owner CARETRENDS
Learn More