Methods for propagating a non sinusoidal signal without distortion in dispersive lossy media

a lossy medium and non-sinusoidal technology, applied in the field of signal transmission, can solve the problems of poor lossy tof measurement accuracy, delay and distortion of typical signals used to generate inputs to transmission lines, and the general delay or propagation time of typical signals that cannot be easily determined, so as to reduce interconnect delays, reduce delay, and reduce the effect of delay

Inactive Publication Date: 2008-05-20
BOARD OF RGT THE UNIV OF TEXAS SYST
View PDF25 Cites 9 Cited by
  • Summary
  • Abstract
  • Description
  • Claims
  • Application Information

AI Technical Summary

Benefits of technology

[0272]The invention provides a method and / or apparatus for utilizing truncated SD clock waveforms to reduce the clock skew. An advantage of the invention is that the delay per unit length can be adjusted with the exponential coefficient, α, chosen in the clock line driver design. This controllable delay per unit length has been demonstrated for a 100-ft coaxial cable in the initial patent application. The minimum coaxial cable delay measured was increased by a factor of 1.8.
[0273]The large increases in the clock signal delay per unit length achieved by varying the exponential coefficient a allows lines to the pins close to the clock driver to be shortened to more closely approximate the minimum physical distance between the driver and pin while maintaining a path delay equal to the delay of the longest clock lines on the chip. The shorter clock distribution lines may utilize less physical space on the chip and reduce the total clock line capacitance. This reduction in clock line capacitance reduces the total power consumption required by the chip for a given clock frequency. In one embodiment, an SD waveform driver may also be made to create an SD clock signal with adjustable delay by including a mechanism for adjusting the exponential coefficient a in the clock generator. This adjustable delay of the SD clock signal may provide a larger delay adjustment range than the delayed-locked loops utilized in the current technology.Example 9 Signal Propagation without Distortion in a Dispersive Lossy Media
[0274]The propagation of signals in a no-loss non-dispersive media is ideal because there is no distortion.[9] However, pulse shapes that propagate along lossy, dispersive transmission lines are commonly dispersive, i.e., change shape[10]. This property can lead to inaccuracy of measurements and mischaracterizations of propagation behaviors.
[0275]As noted in Example 4 and Example 5 and illustrated in FIG. 17, the propagated waveform (e.g., a speedy delivery waveform) maintains an essentially constant shape during transmission in a dispersive lossy media. In particular, a speedy delivery (SD) waveform can be shown to be an exact closed form solution in the time domain of the four-parameter Telegrapher's equation that can be expressed as F(vt−x). The telegrapher's equation for the voltage on a transmission line is[11]
[0276]LC⁢∂2⁢v∂t2+(LG+RC)⁢∂v∂t+RGv=∂2⁢v∂x2Eq.⁢1where L, C, R, and G are the transmission line parameters[12].
[0277]The SD solution of Eq. 1 in the time domain with boundary conditions v(x=0,t)=Deαt and v(x→∞,t)=0 isvSD(x,t)=Deαte−xγ(α)  Eq. 2which, when rewritten in the form F(vt−x) yields,vSD(x,t)=Deγ(α)[(v<sub2>SD< / sub2>(α))t−x]  Eq. 3where

Problems solved by technology

Transmission lines, with their characteristic loss of signal as well as inherent time delay, may create problems in designing systems that employ a plurality of signals, which may be subject to delay and distortion.
Typical signals used to generate inputs to transmission lines generally exhibit delay or propagation times that are not easily determinable.
A fundamental limitation in TDR technology is the poor accuracy of TOF measurements in lossy, dispersive transmission lines.

Method used


Image

  • Methods for propagating a non sinusoidal signal without distortion in dispersive lossy media
  • Methods for propagating a non sinusoidal signal without distortion in dispersive lossy media
  • Methods for propagating a non sinusoidal signal without distortion in dispersive lossy media

Examples


example 1

Method for Determining SD Waveform Parameters, ASD and vSD

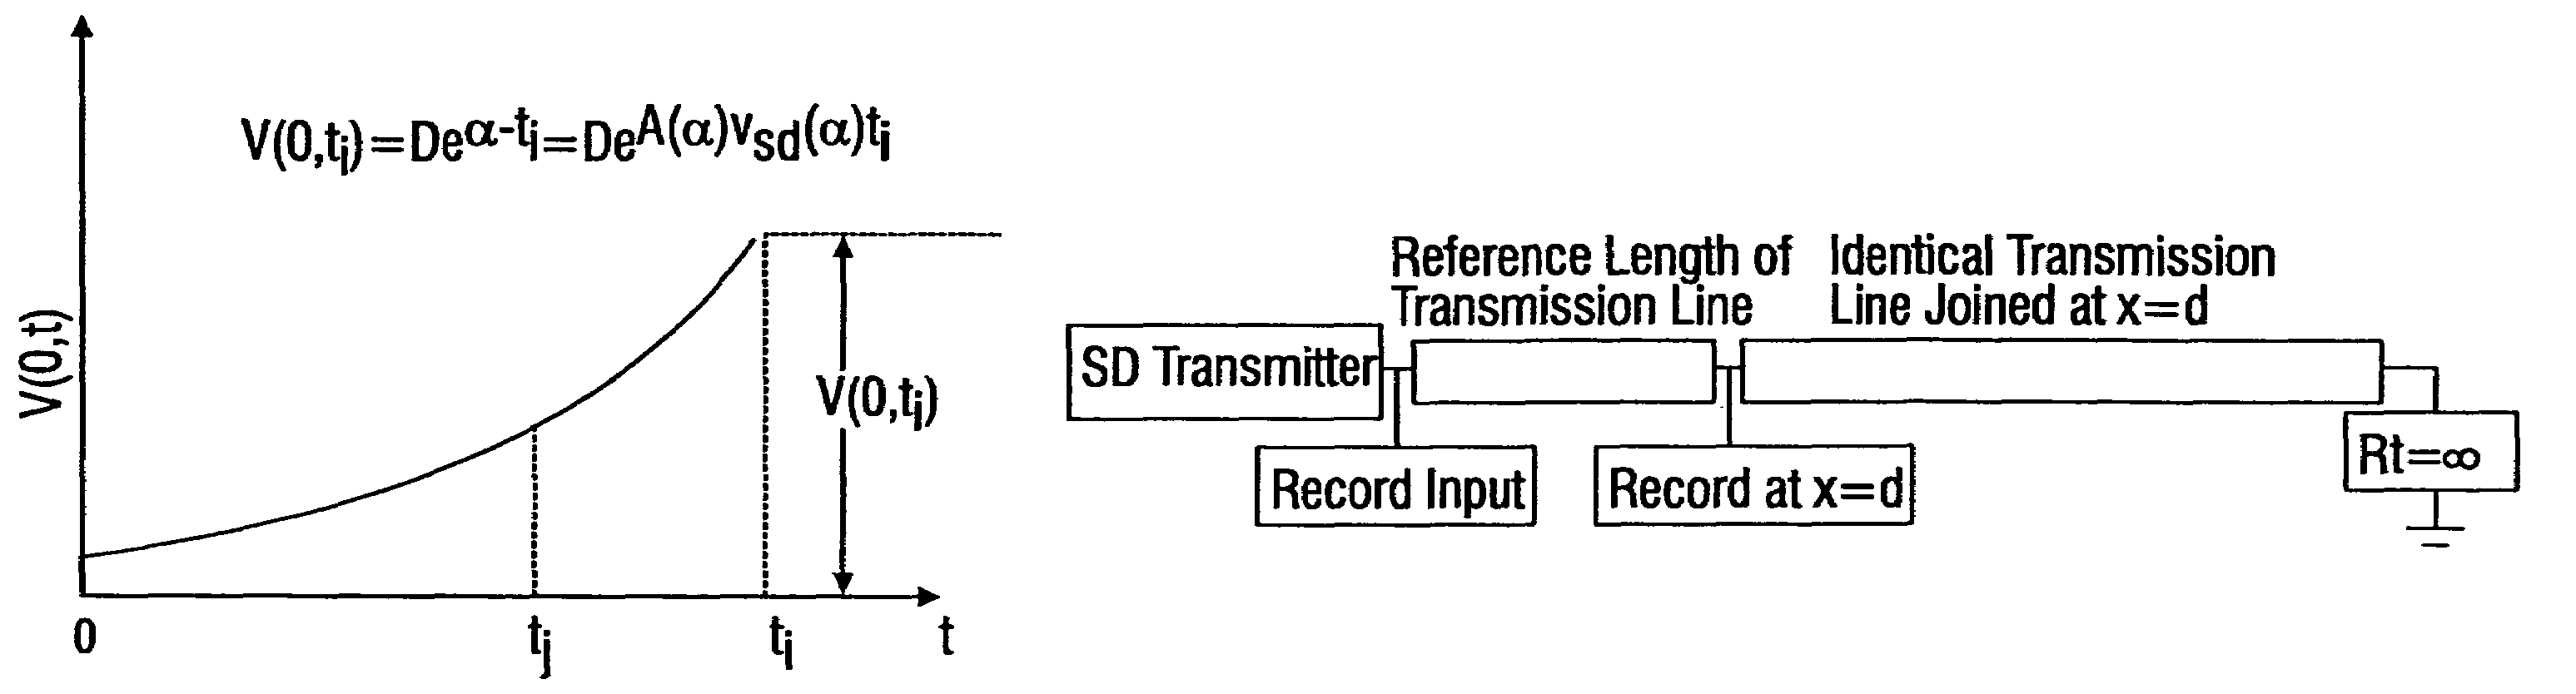
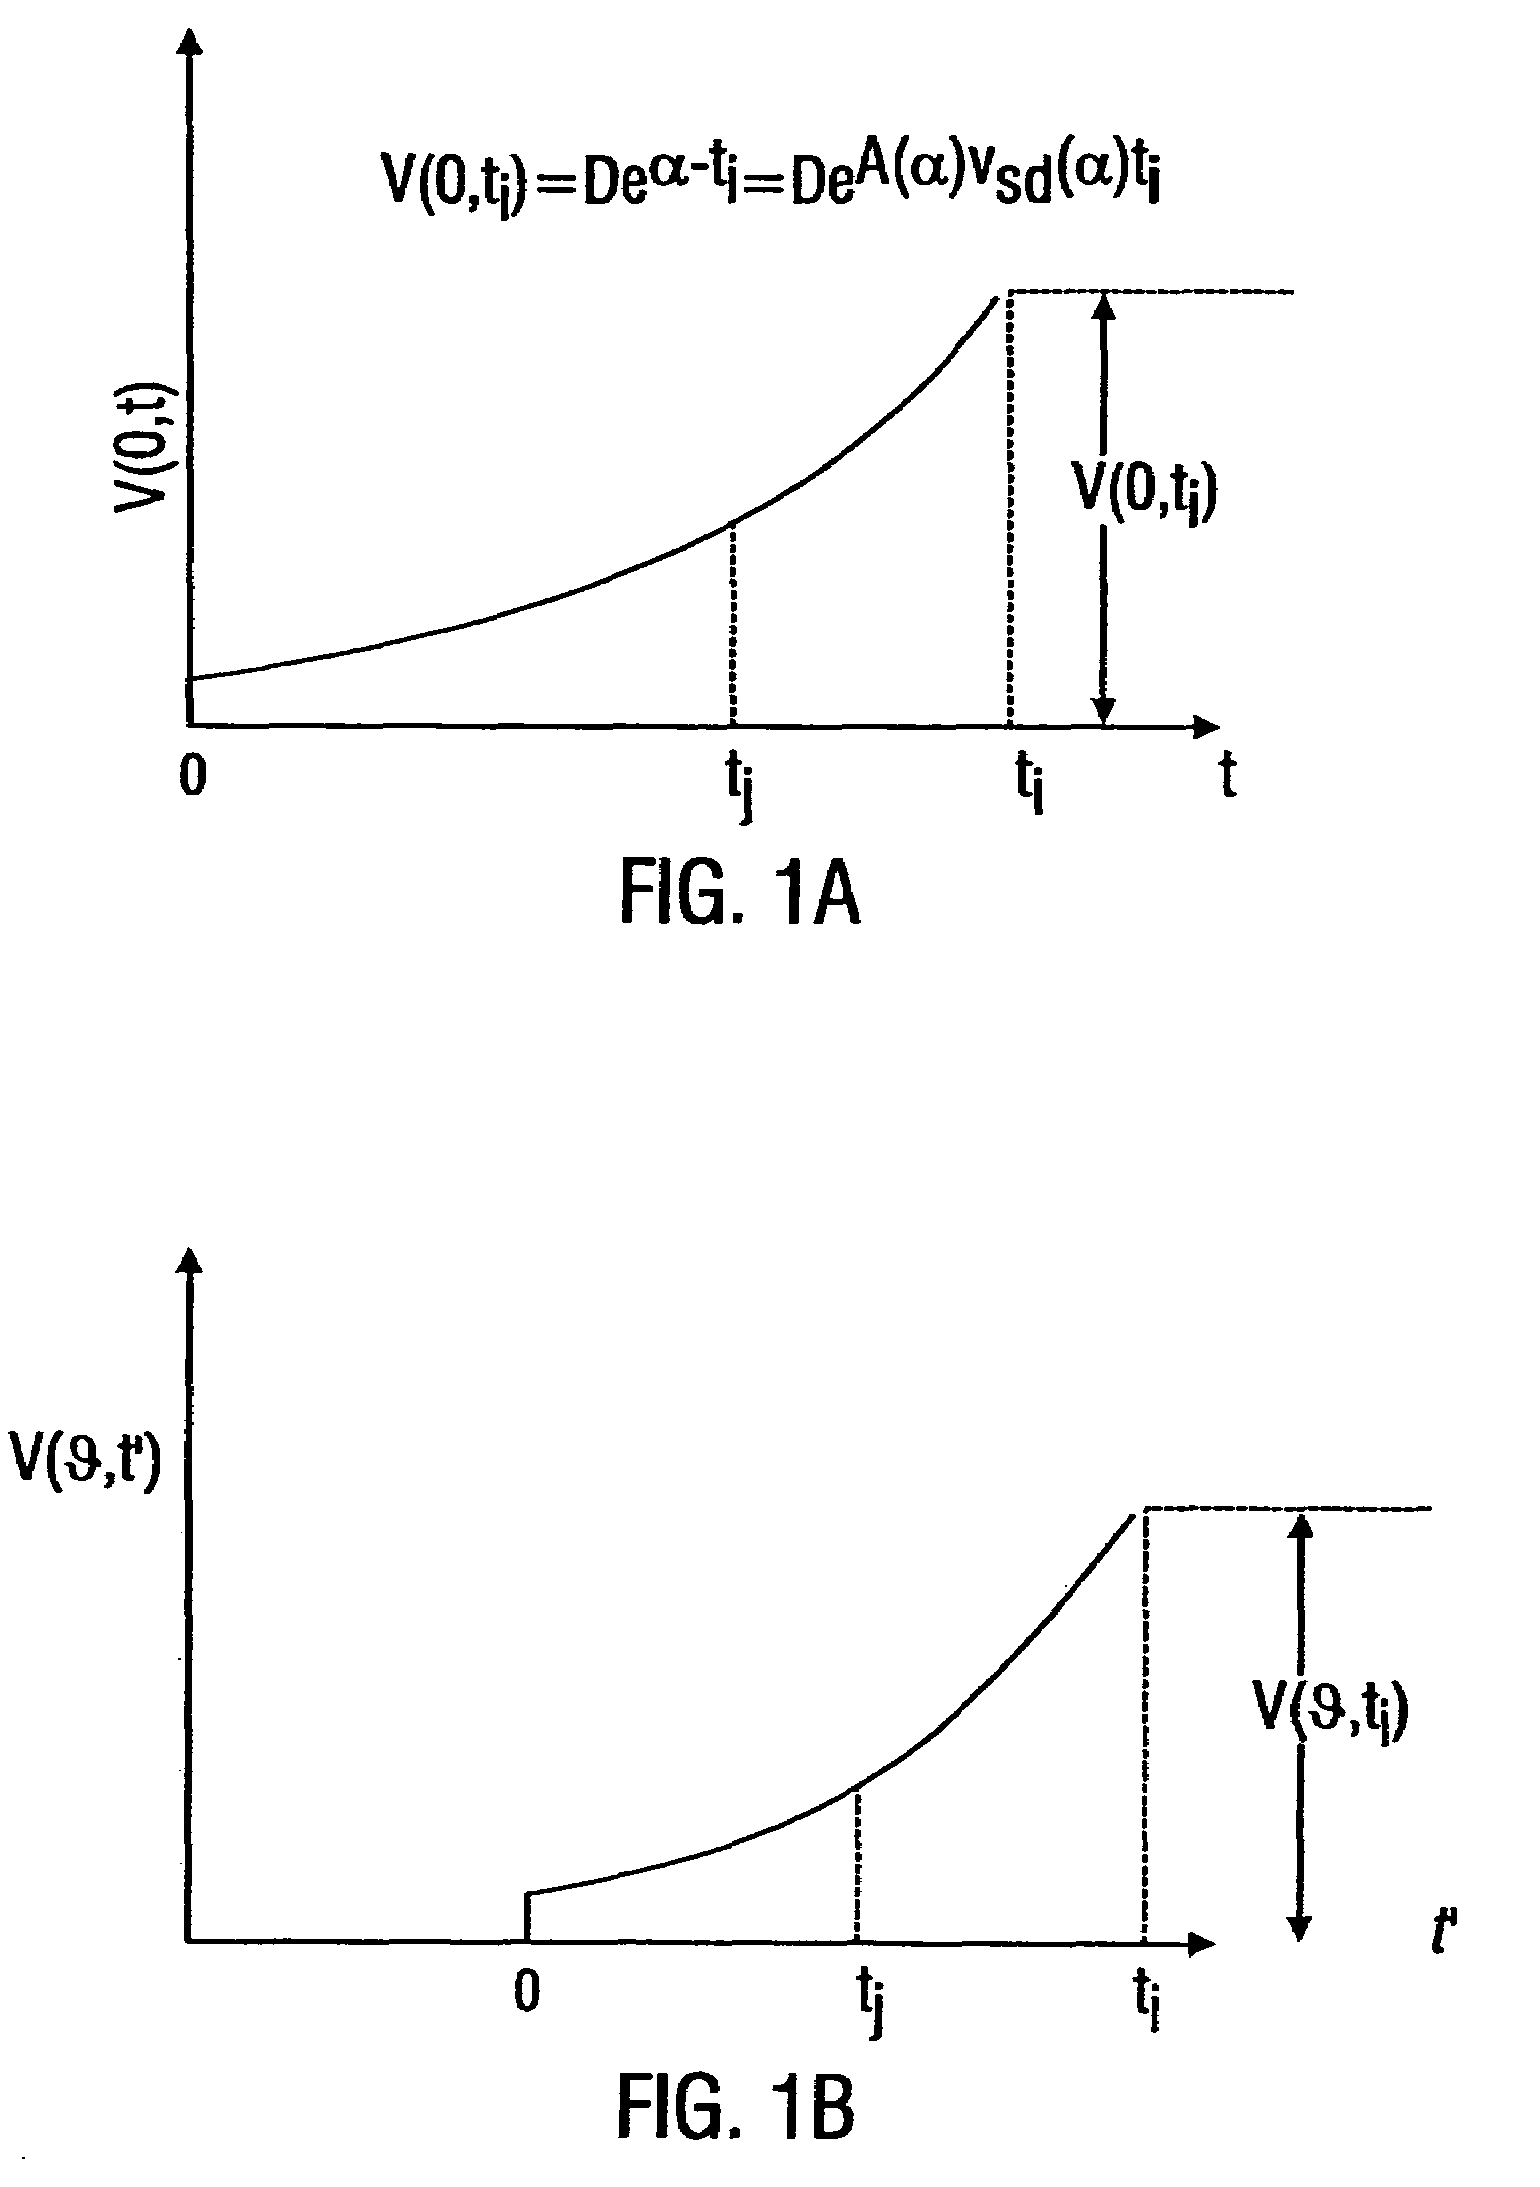
[0192]This example teaches how SD test pulses may be used to obtain empirical estimates of the transmission line parameters, ASD and vSD, that describe the propagation of SD waveforms in lossy, dispersive lines, including those with frequency dependent parameters. The numerical values of ASD and vSD as a function of α can be determined empirically.

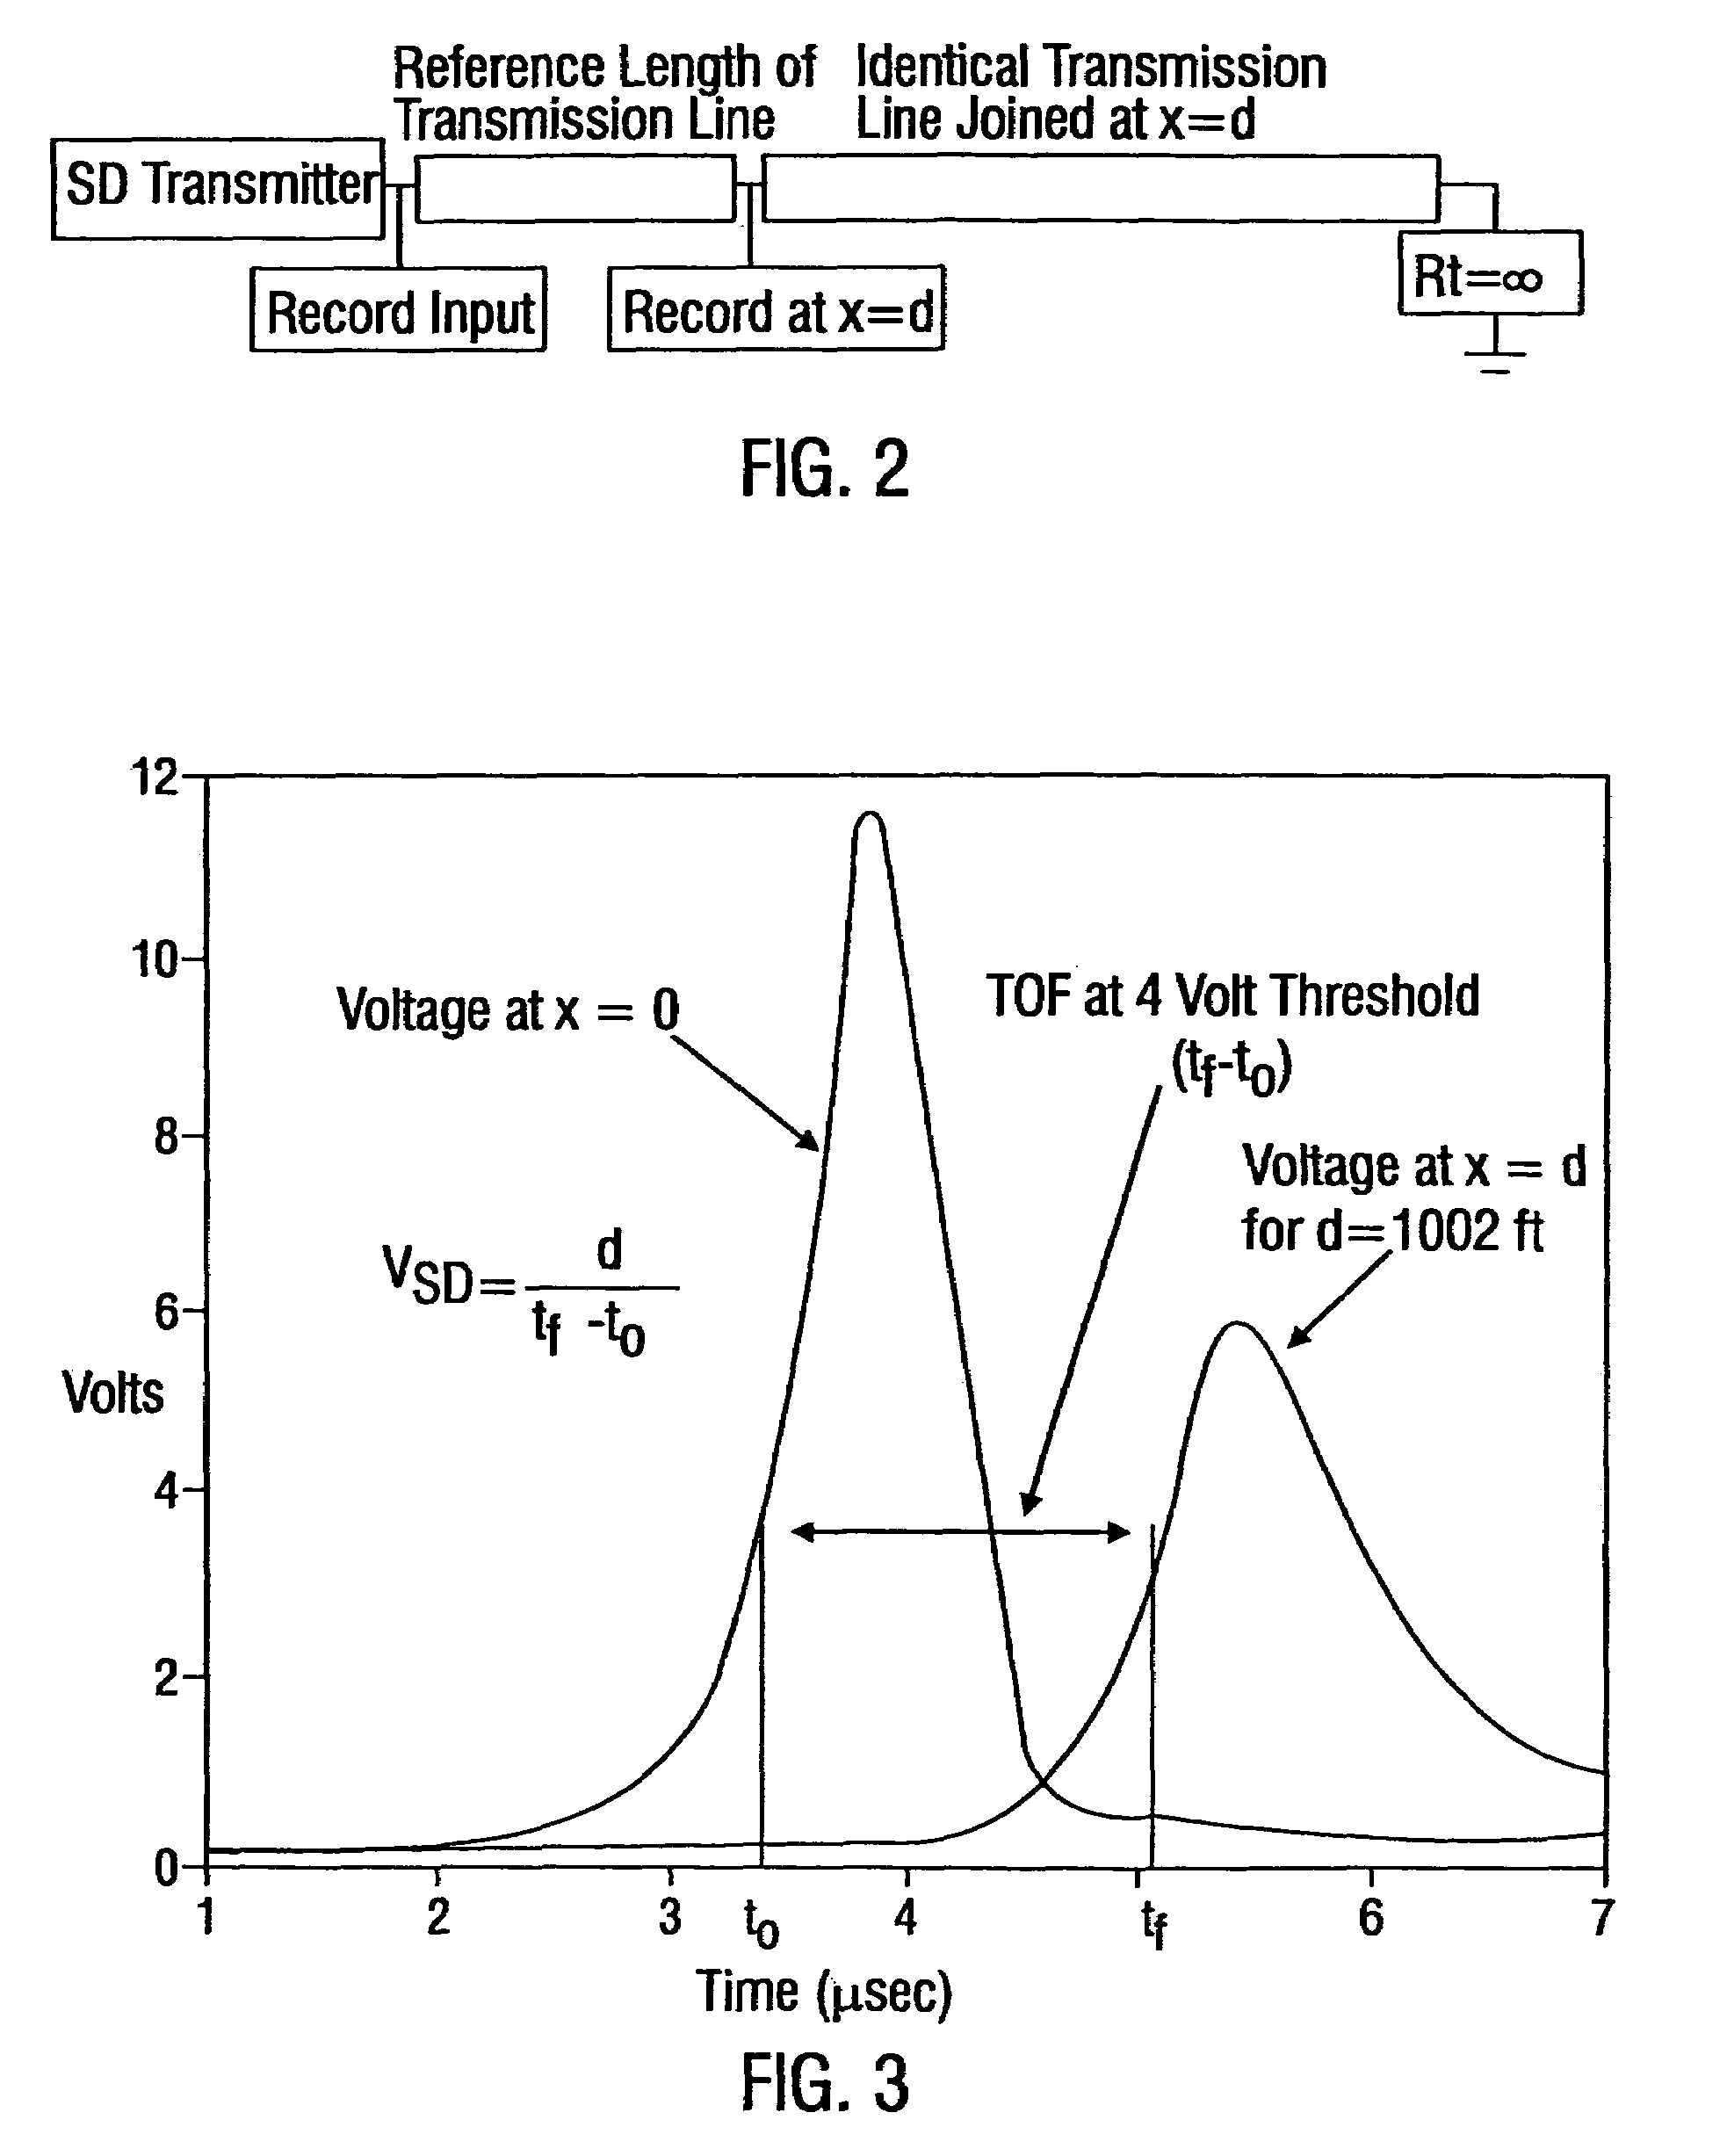
[0193]Referring to FIG. 2, an experimental set up that may be used to determine these parameters for a copper, twisted wire pair transmission line is depicted. The test length of the transmission line, d, and the value of a for the applied SD input signal are measured. An additional length of transmission line that is identical to the line under test is attached as shown and terminated with an open circuit. In this example the cables are two 24 AWG, individually shielded, twisted wire pairs in a 1002 ft coil of T1 cable.

[0194]The values of D, α and the duration of the SD signal wer...

example 2

Extracting SD Parameters from Empirical Transfer Function

[0203]The method described in example 1 can be limiting in that it should be experimentally repeated for each exponential coefficient α. This may require a lengthy laboratory calibration time for each cable type. Simulation can be included in the calibration process to significantly reduce the experimental measurements needed to determine the values of ASD and VSD. The use of simulation in this process requires a transfer function that describes the response of the specific type of cable. The α's analyzed for the T1 cable range from 1×10⁵ sec−1 to 1×10⁷ sec−1. This range of α's corresponds to the frequency band of 16 kHz to 1.6 MHz, so the transfer function must be accurate for this range. The transfer function of the cable may available from the manufacturer or can be determined empirically by applying a known pulse and measuring the applied cable input waveform and the response waveform at a known (calibration) distance alon...

example 3

Measurement of SD Transmission Line Impedance

[0209]The SD line impedance, ZSD(α), is a real number which may be determined for the α's of interest. If the Laplace transform of the frequency dependent transmission line parameters R(s), L(s), C(s), and G(s), are known, then ZSD(α) may be computed from,

[0210]ZSD=α⁢L_⁡(α)+R_⁡(α)α⁢C_⁡(α)+G_⁡(α).

[0211]The SD line impedance, ZSD(α), may also be experimentally determined for a test transmission line by measuring the SD portion of the voltage waveform across various known termination impedances and computing the value ZSD(α) from the measurements. The measured SD waveform at a termination, VSD(Rt), consists of the sum of the incident SD waveform, VSD+, and a reflected SD wave. The reflected wave is the product of the SD reflection coefficient, Γ, and the incident wave. The measured SD signal at the termination will be

[0212]VSD⁡(Rt)=(1+Γt)·VSD+=2·RtRt+ZSD·VSD+.

Note that all lumped and distributed impedance values are real for SD signals.

[0213...


PUM

PropertyMeasurementUnit
distanceaaaaaaaaaa
total distanceaaaaaaaaaa

Abstract

Systems and methods are described for transmitting a waveform having a controllable attenuation and propagation velocity. An exemplary method comprises: generating an exponential waveform, the exponential waveform (a) being characterized by the equation Vin=De−A<sub2>SD< / sub2>[x−v<sub2>SD< / sub2>t], where D is a magnitude, Vin is a voltage, t is time, ASD is an attenuation coefficient, and vSD is a propagation velocity; and (b) being truncated at a maximum value. An exemplary apparatus comprises: an exponential waveform generator; an input recorder coupled to an output of the exponential waveform generator; a transmission line under test coupled to the output of the exponential waveform generator; an output recorder coupled to the transmission line under test; an additional transmission line coupled to the transmission line under test; and a termination impedance coupled to the additional transmission line and to a ground.

Description

CROSS-REFERENCES TO RELATED APPLICATIONS[0001]This application is a continuation-in-part of, and claims priority to, U.S. patent application Ser. No. 10 / 224,541 filed Aug. 20, 2002, now U.S. Pat. No. 6,847,267, which is a continuation-in-part of U.S. patent application Ser. No. 09 / 519,922, filed Mar. 7, 2000, now U.S. Pat. No. 6,441,695. The entire text of each of the above related applications is incorporated by reference in its entirety.BACKGROUND OF THE INVENTION[0002]1. Field of the Invention[0003]The invention relates generally to the field of signal transmission. More particularly, a representative embodiment of the invention relates to transmission line testing and communication.[0004]2. Discussion of the Related Art[0005]Transmission lines, with their characteristic loss of signal as well as inherent time delay, may create problems in designing systems that employ a plurality of signals, which may be subject to delay and distortion. Typical signals used to generate inputs to...

Claims


Application Information

Patent Timeline
Patent Type & Authority Patents(United States)
IPC IPC(8): H04B3/04G01K17/00G01R31/11H04L25/02H04B3/00H04B3/46H04B13/00H04L1/24H04L25/03H04L25/12
CPCG01R31/088H04B3/462H04B3/466H04L1/24H04L25/03834H04L25/12G01R31/11
Inventor FLAKE, ROBERT H.BISKUP, JOHN F.LIAO, SU-LIANG
Owner BOARD OF RGT THE UNIV OF TEXAS SYST
Why Eureka
Try Eureka