
Method and apparatus for the topographical mapping of investment risk, safety and efficiency

a topographical mapping and investment risk technology, applied in the field of investment risk evaluation, can solve the problems of exceptionally high negative returns (losses), virtually no uncertainty, and highlighting of exceptionally high negative returns, so as to enhance investment decision making and maximize information content

Inactive Publication Date: 2008-08-19
ELISA FINANCIERE
View PDF13 Cites 12 Cited by
  • Summary
  • Abstract
  • Description
  • Claims
  • Application Information

AI Technical Summary

Benefits of technology

Enhances investment decision-making by providing a comprehensive and coherent evaluation of risk and efficiency, promoting diversified portfolios by visualizing the structural properties of probability densities and their impact on investment outcomes.

Problems solved by technology

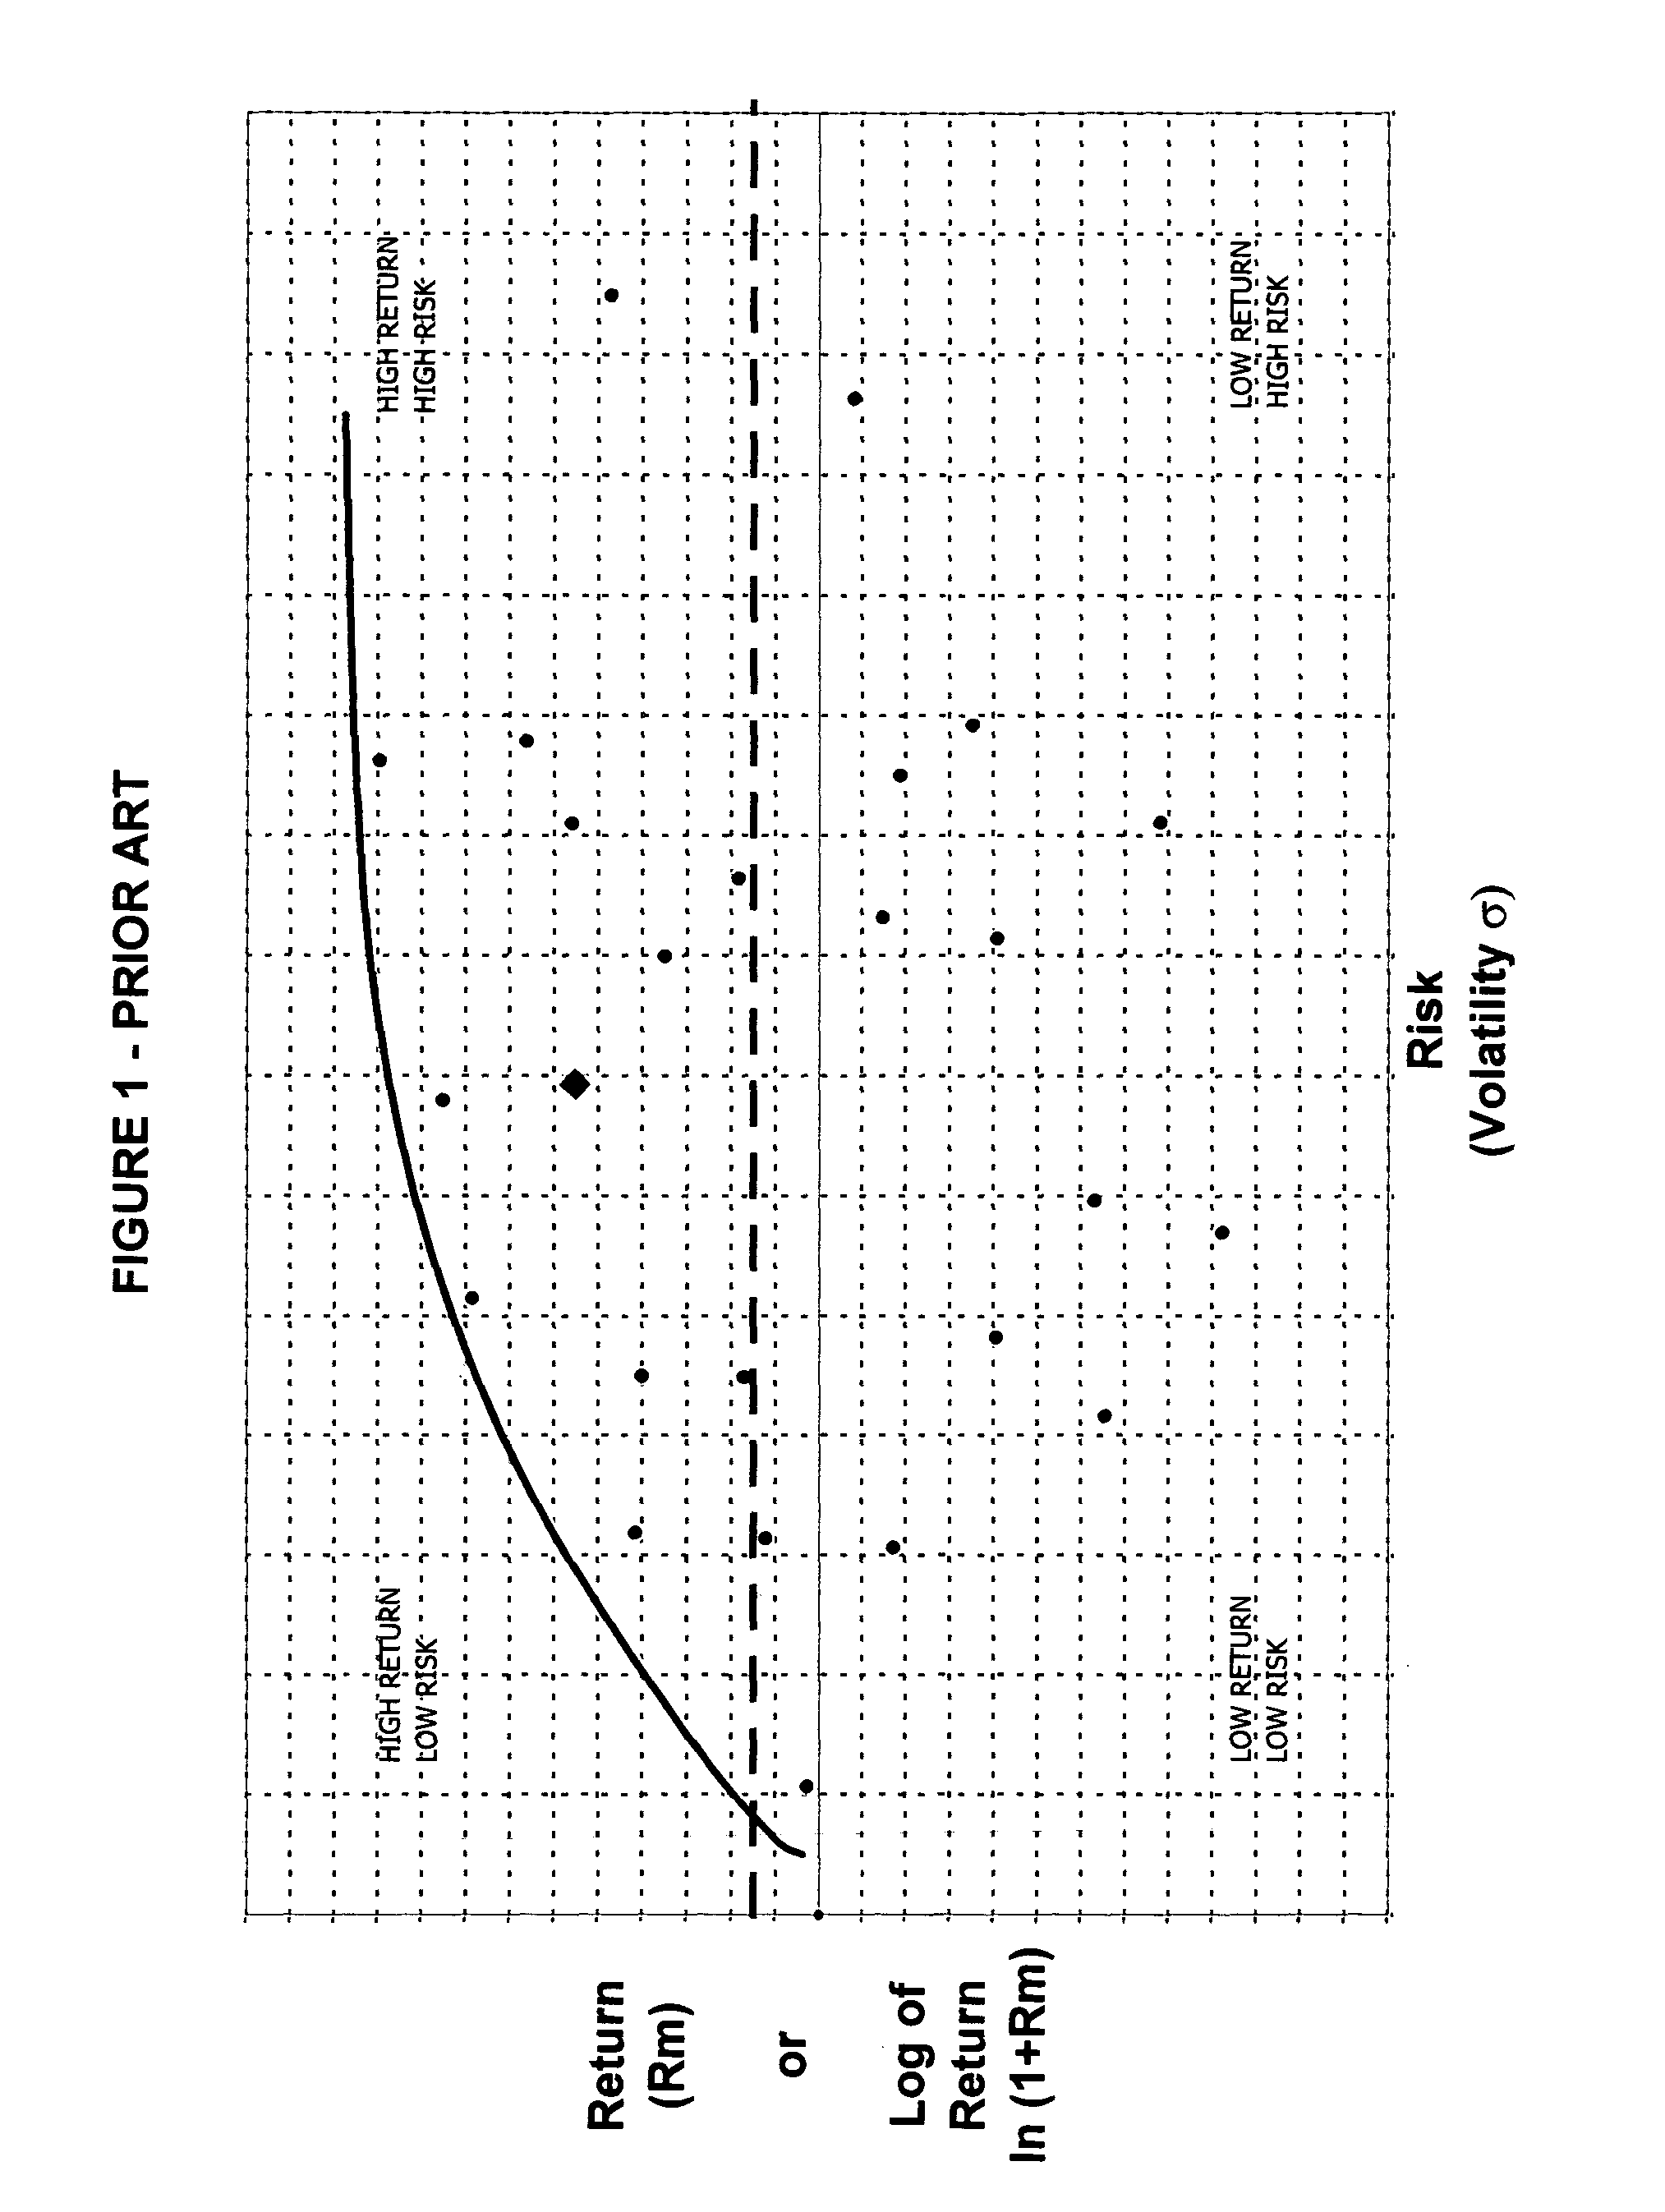
Risk refers to the uncertainty of the financial outcome of an investment portfolio following a given investment period.
The uncertainty is practically nil, however, for certain offerings of assets such as short-term (30 days) treasury bills, yields of which are guaranteed by the taxation powers of government and their ability to expand the monetary float.
Application of V@Rα to typical portfolios generally results in the highlighting of exceptionally high negative returns (losses).
However, in the case of exceptional portfolios of such good expected return and low volatility that provide positive V@Rα measures, what exactly is at risk is no longer clear.
Diversification seemingly leads to an increase in risk, which is incoherent.
Various combinations of frequency and severity of investment losses can arise affecting the overall portrayal and classification of risk.

Method used


Image

  • Method and apparatus for the topographical mapping of investment risk, safety and efficiency
  • Method and apparatus for the topographical mapping of investment risk, safety and efficiency
  • Method and apparatus for the topographical mapping of investment risk, safety and efficiency

Examples


Embodiment Construction

[0051]In controlling risk, it is important to distinguish between risk prevention and reduction. Risk prevention is attained by restricting the probability of loss, and translates into satisfying an allowable frequency of loss criteria. In turn, risk reduction refers to restricting the severity of loss, and similarly entails satisfying an allowable severity of loss criteria. The concept of insurance combines these notions in the form of a product:

[0052]Insurance=(probability⁢⁢of⁢⁢loss⁢⁢or⁢⁢shortfall)×(expected⁢⁢loss⁢⁢in⁢⁢the⁢⁢event⁢⁢of⁢⁢a⁢⁢loss⁢⁢or⁢⁢shortfall)=(probability⁢⁢of⁢⁢loss⁢⁢or⁢⁢shortfall)×(conditional⁢⁢expected⁢⁢loss⁢⁢or⁢⁢shortfall)(1)

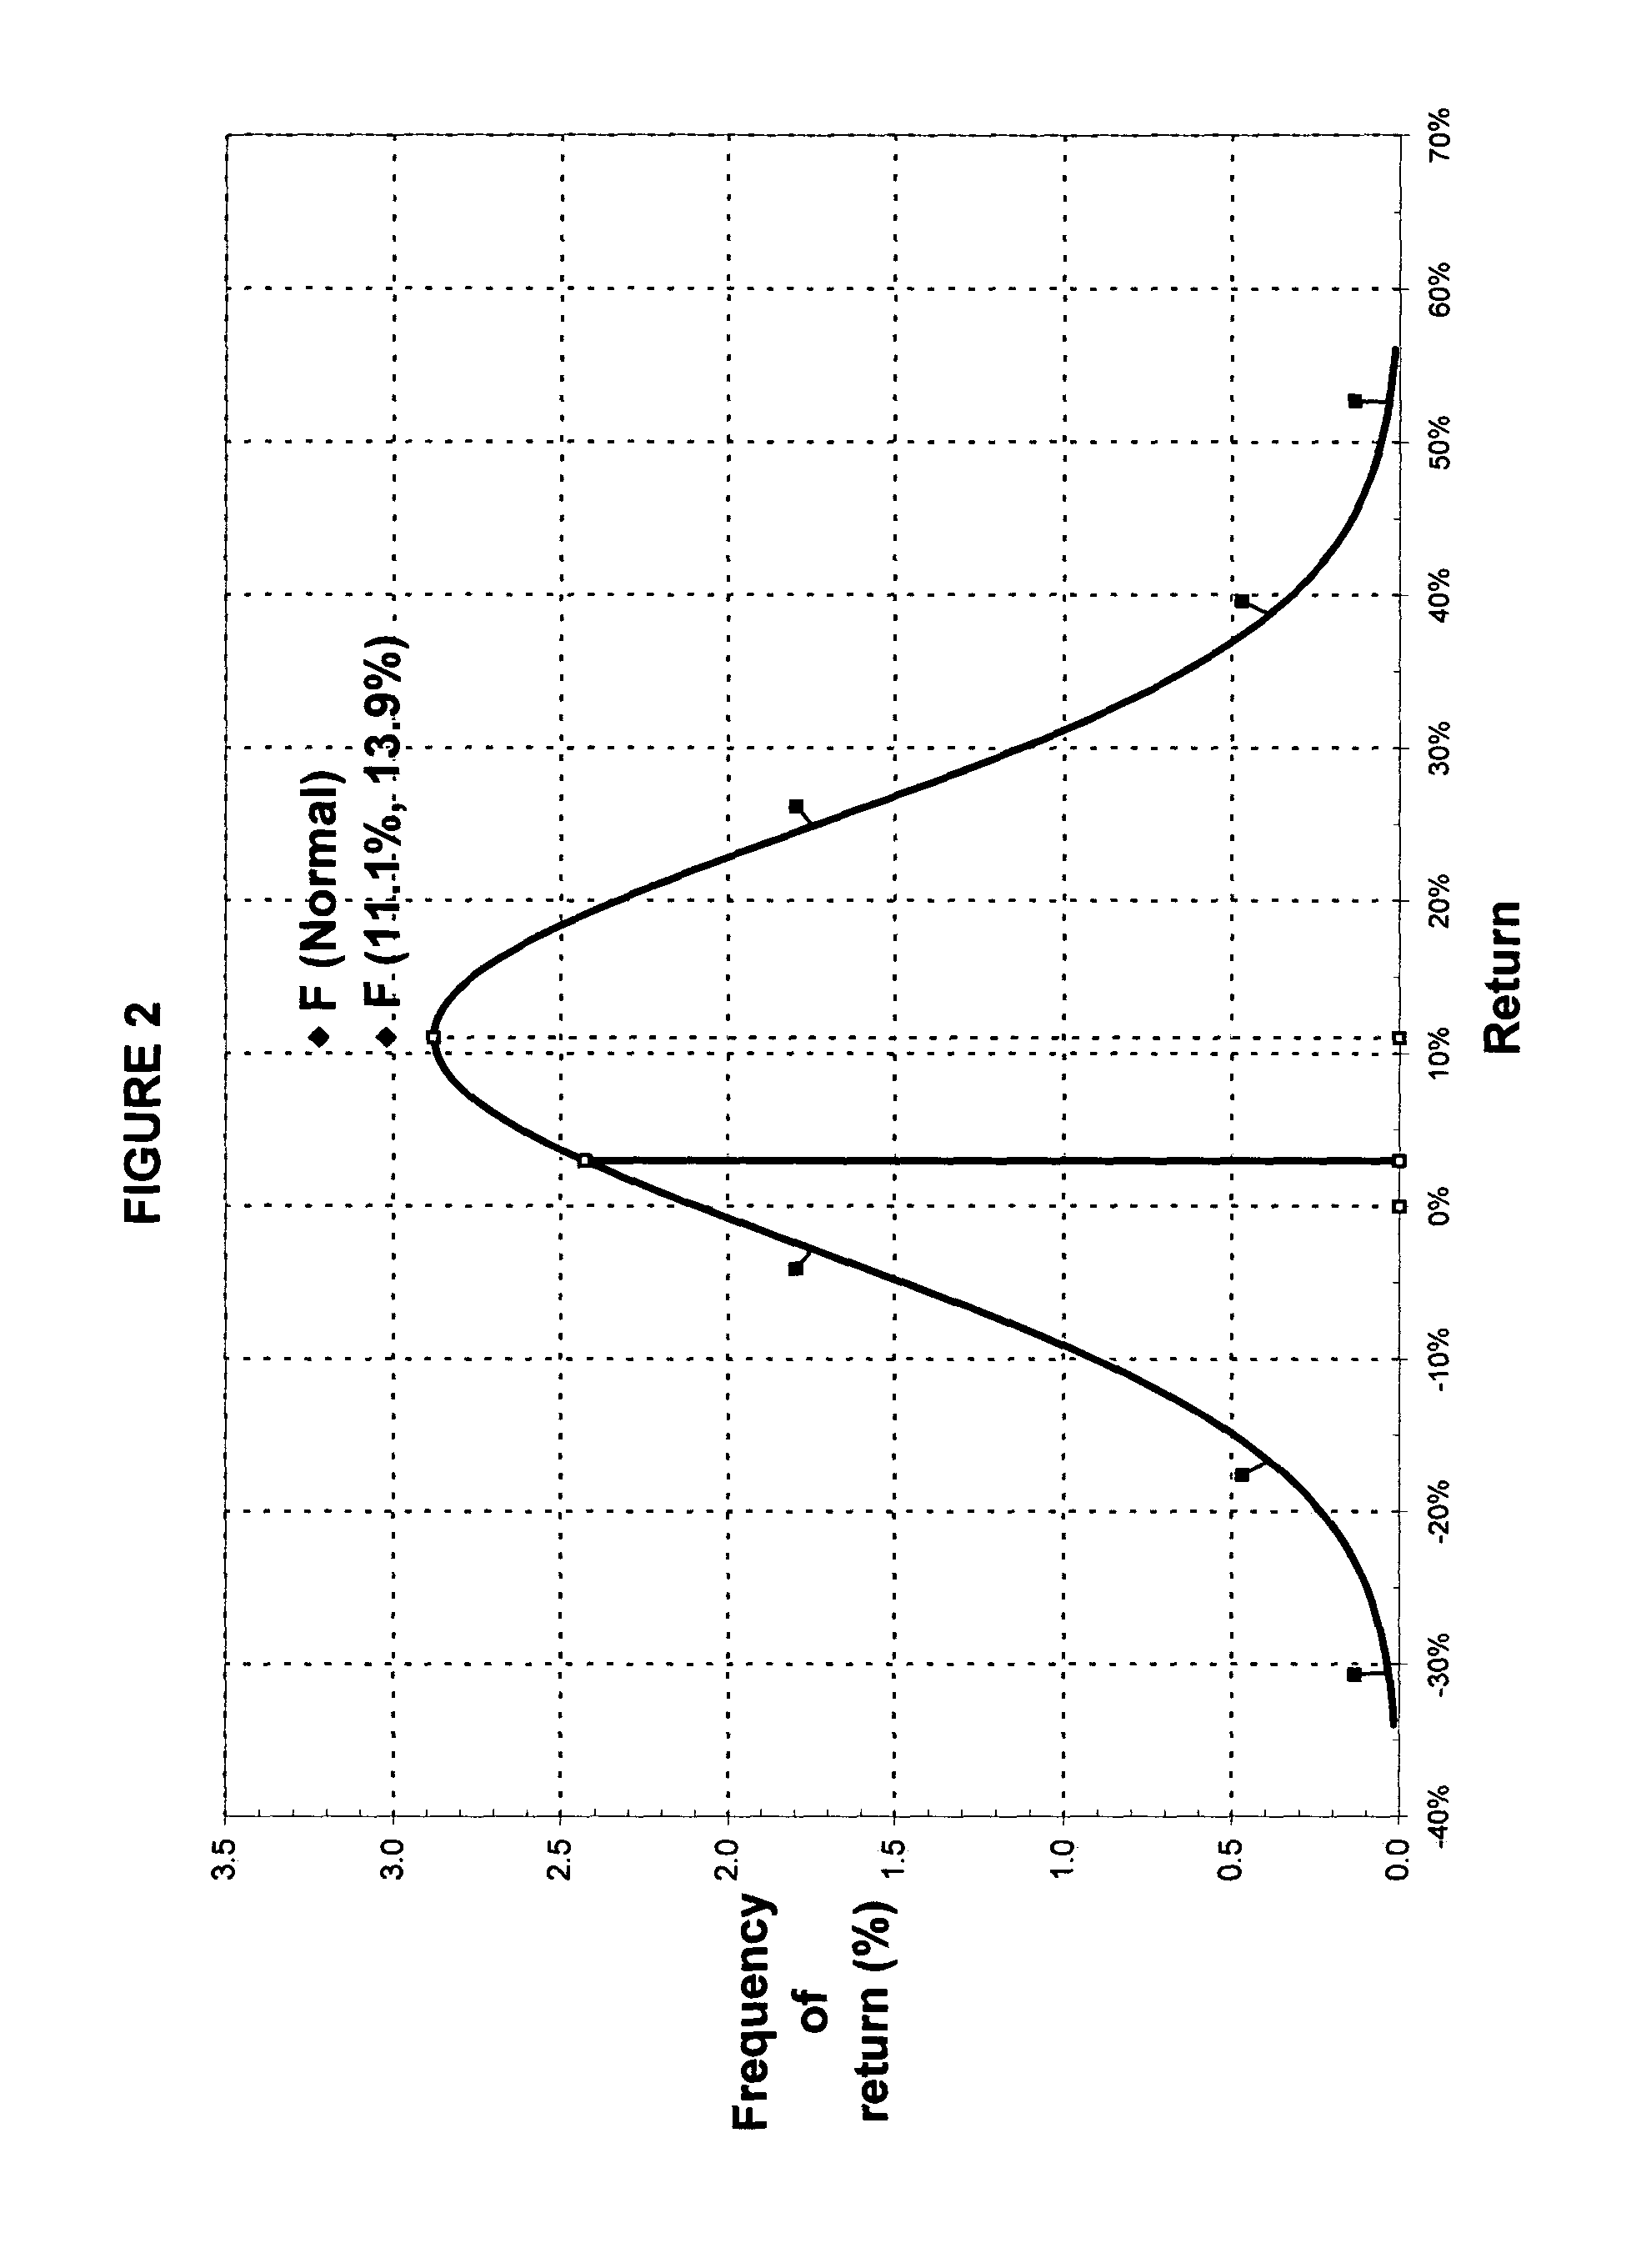
[0053]The term “shortfall” also naturally conjures up a reference to an implicit benchmark, that defining the threshold between profit and loss. By applying a profit and loss threshold to a continuous probability density function that has been drawn out graphically for convenience, the density function can be separated into two distinct profi...


PUM


Abstract

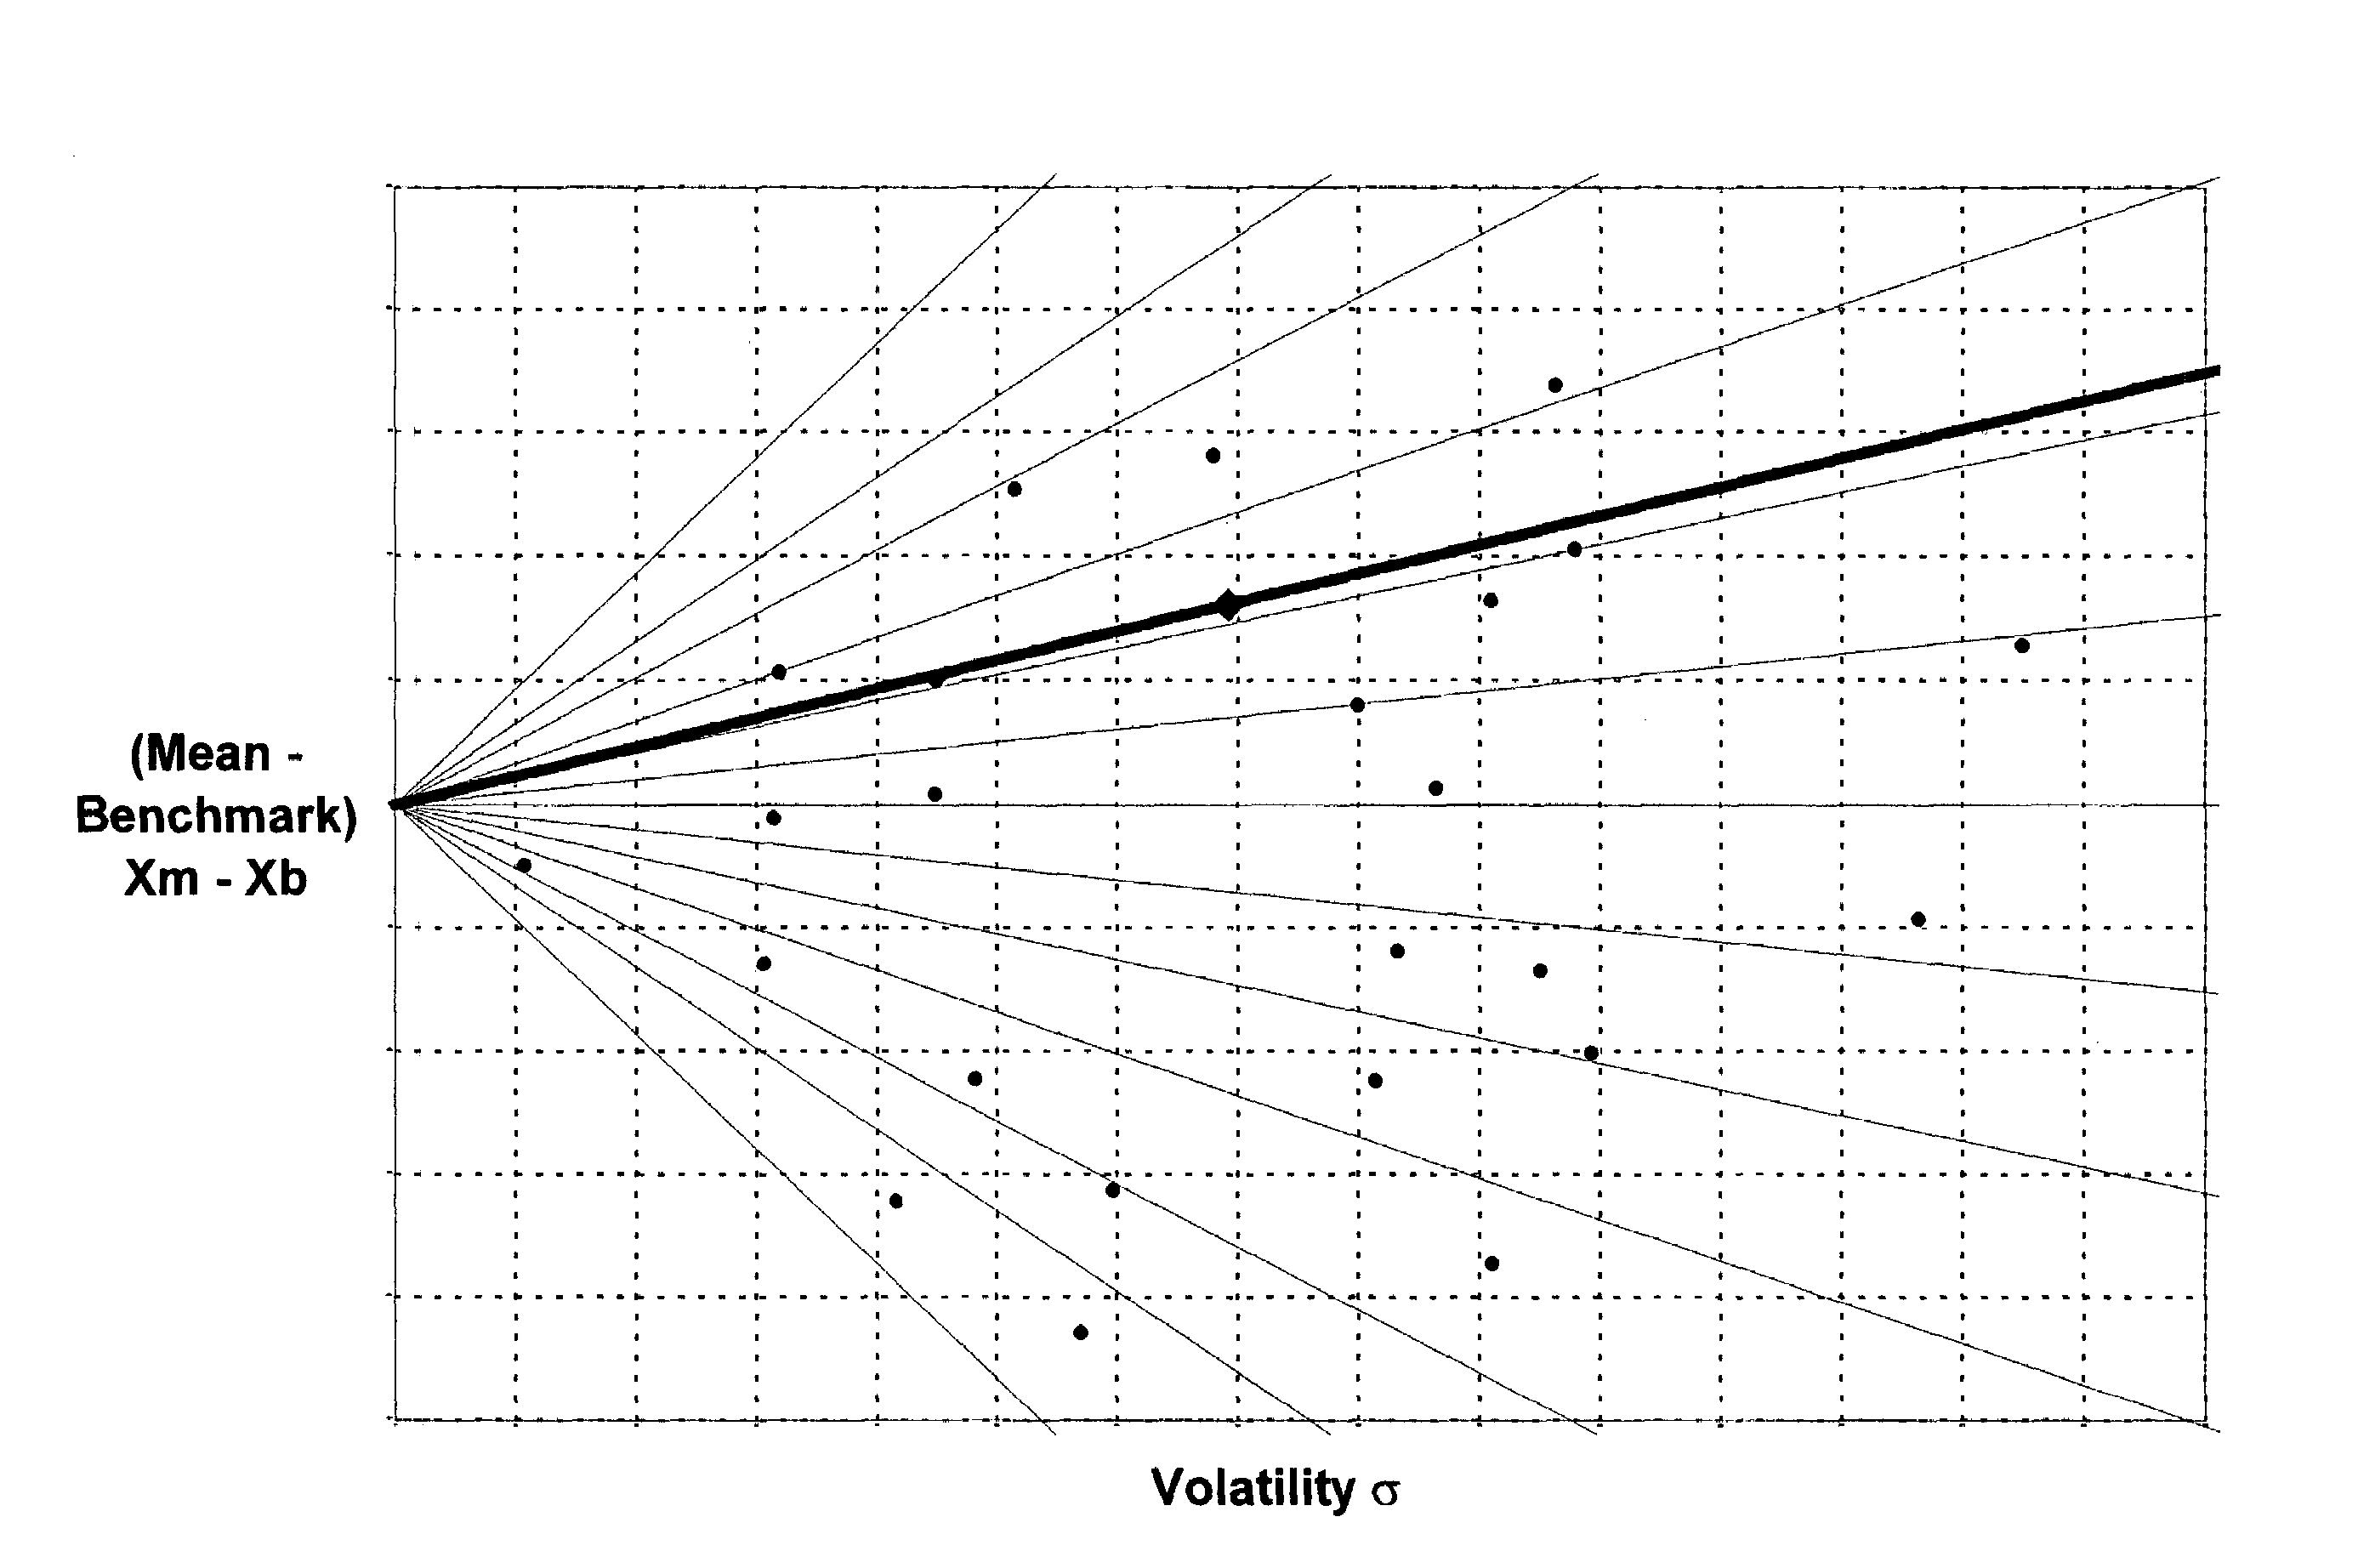
A method and a system for evaluating at least one of a risk, safety and efficiency property of a portfolio belonging to a class of one of a probability density and a probability distribution, for a given time frame are provided. The method comprises: obtaining portfolio pricing data over said given time frame; obtaining at least one benchmark Xb; with respect to investment returns, fitting one of a stochastic investment class over said given time frame in relation to said benchmark Xb by obtaining a location parameter a, a scale parameter b and other corresponding shape parameters; and an empirical investment class over said given time frame in relation to said benchmark Xb; determining a mean return value Xm and a standard deviation σx using said class; graphically illustrating said portfolio in relation to said benchmark Xb using said return value Xm and said standard deviation σx on an investment chart; determining for said portfolio by using properties of said class a solution to (Xm−Xb)=[(ES−Xb)·α]+[(EP−Xb)·γ]=I′S+I′P; graphically illustrating at least one said component of said expression (Xm−Xb), in the form of a topographical map on said investment chart using said benchmark Xb.

Description

FIELD OF THE INVENTION[0001]The invention relates to investment risk evaluation. More specifically, it relates to mapping and illustrating investment risk, safety and efficiency.BACKGROUND OF THE INVENTION[0002]Much of the modern art of investing relates to the evaluation of the appropriate trade-off of risk against return in the constitution of portfolios for investors. The problem is not simple. The investor provides unique combinations of investment goals and objectives, as well as risk perceptions that all naturally fluctuate over time based on past experiences and future expectations. Portfolios are typically baskets of instruments chosen from a universally diversified supermarket of investments. And, whereas return is easily quantified, much of the number crunching of modern portfolio theory now deals with the quantification of risk.[0003]Risk refers to the uncertainty of the financial outcome of an investment portfolio following a given investment period. The value of the por...

Claims


Application Information

Patent Timeline
Patent Type & Authority Patents(United States)
IPC IPC(8): G06Q40/00
CPCG06Q40/08G06Q40/06
Inventor HUNEAULT, PAUL
Owner ELISA FINANCIERE
Learn More