

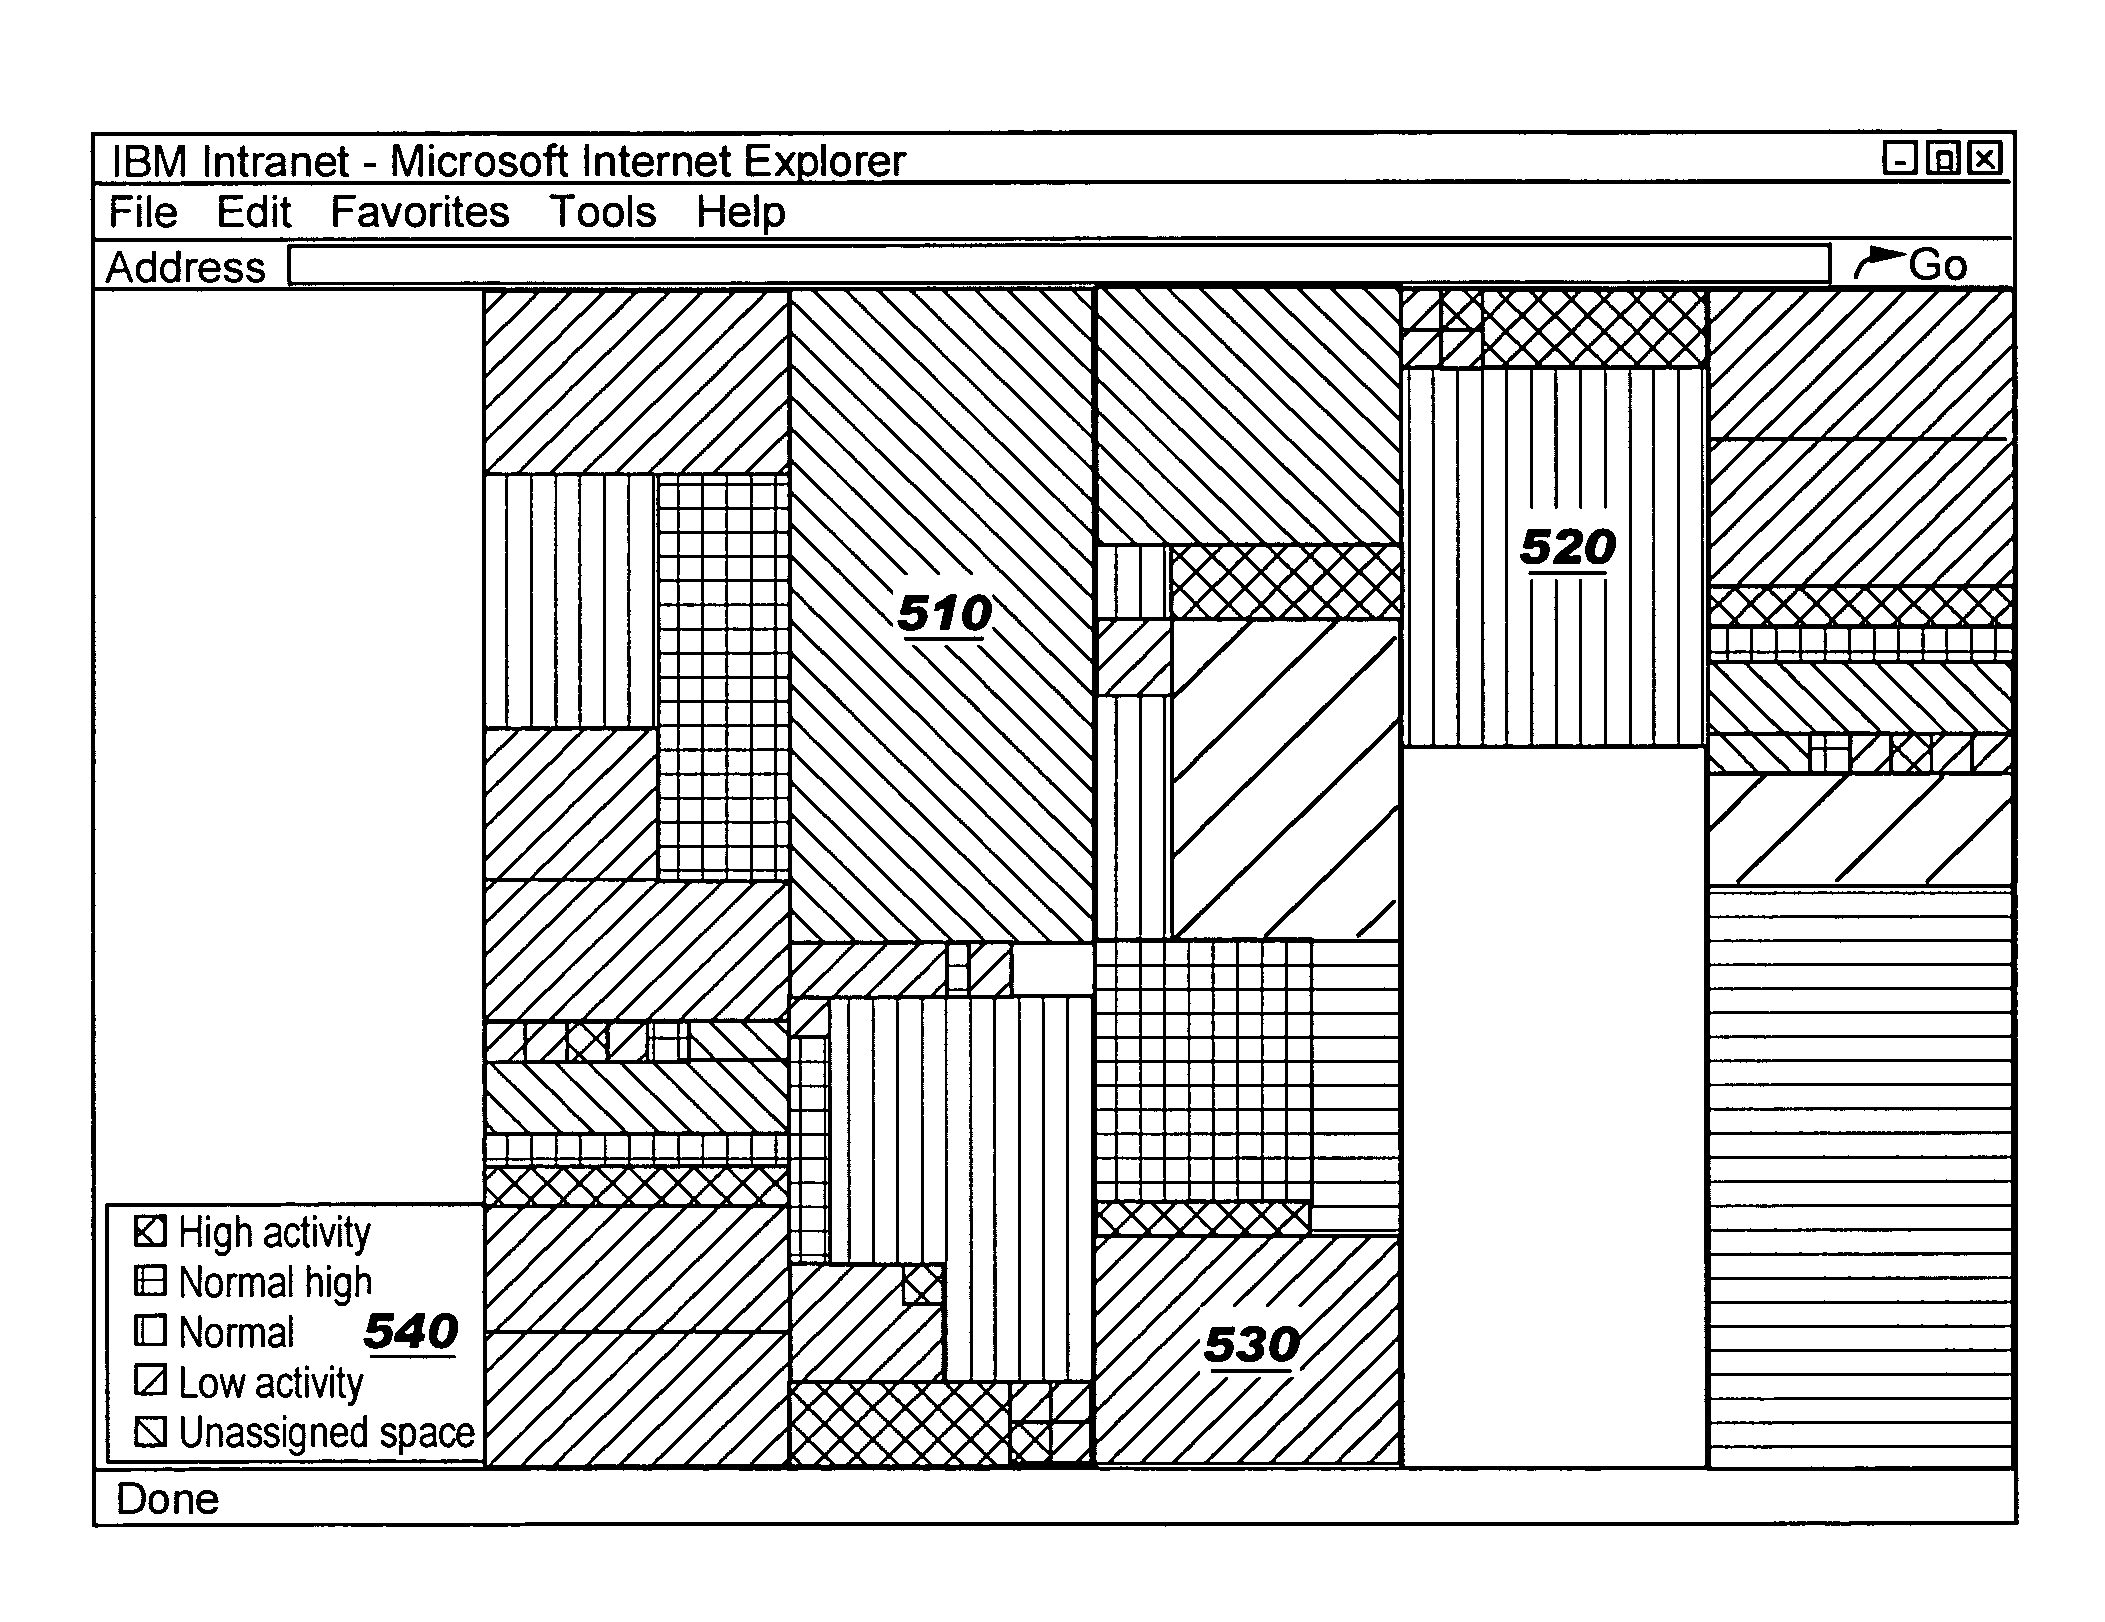
System and method for visually rendering resource policy usage information
a resource policy and resource information technology, applied in the field of data processing systems, can solve the problems of not providing the output of current infrastructure management and performance monitoring systems, affecting the performance of one information technology infrastructure resource relative to other information technology infrastructure resources, and unable to provide a completely clear and intuitive representation of the operation and usage of that particular system resource relative to other resources
- Summary
- Abstract
- Description
- Claims
- Application Information
AI Technical Summary
Benefits of technology
Problems solved by technology
Method used
Image

Examples
Embodiment Construction
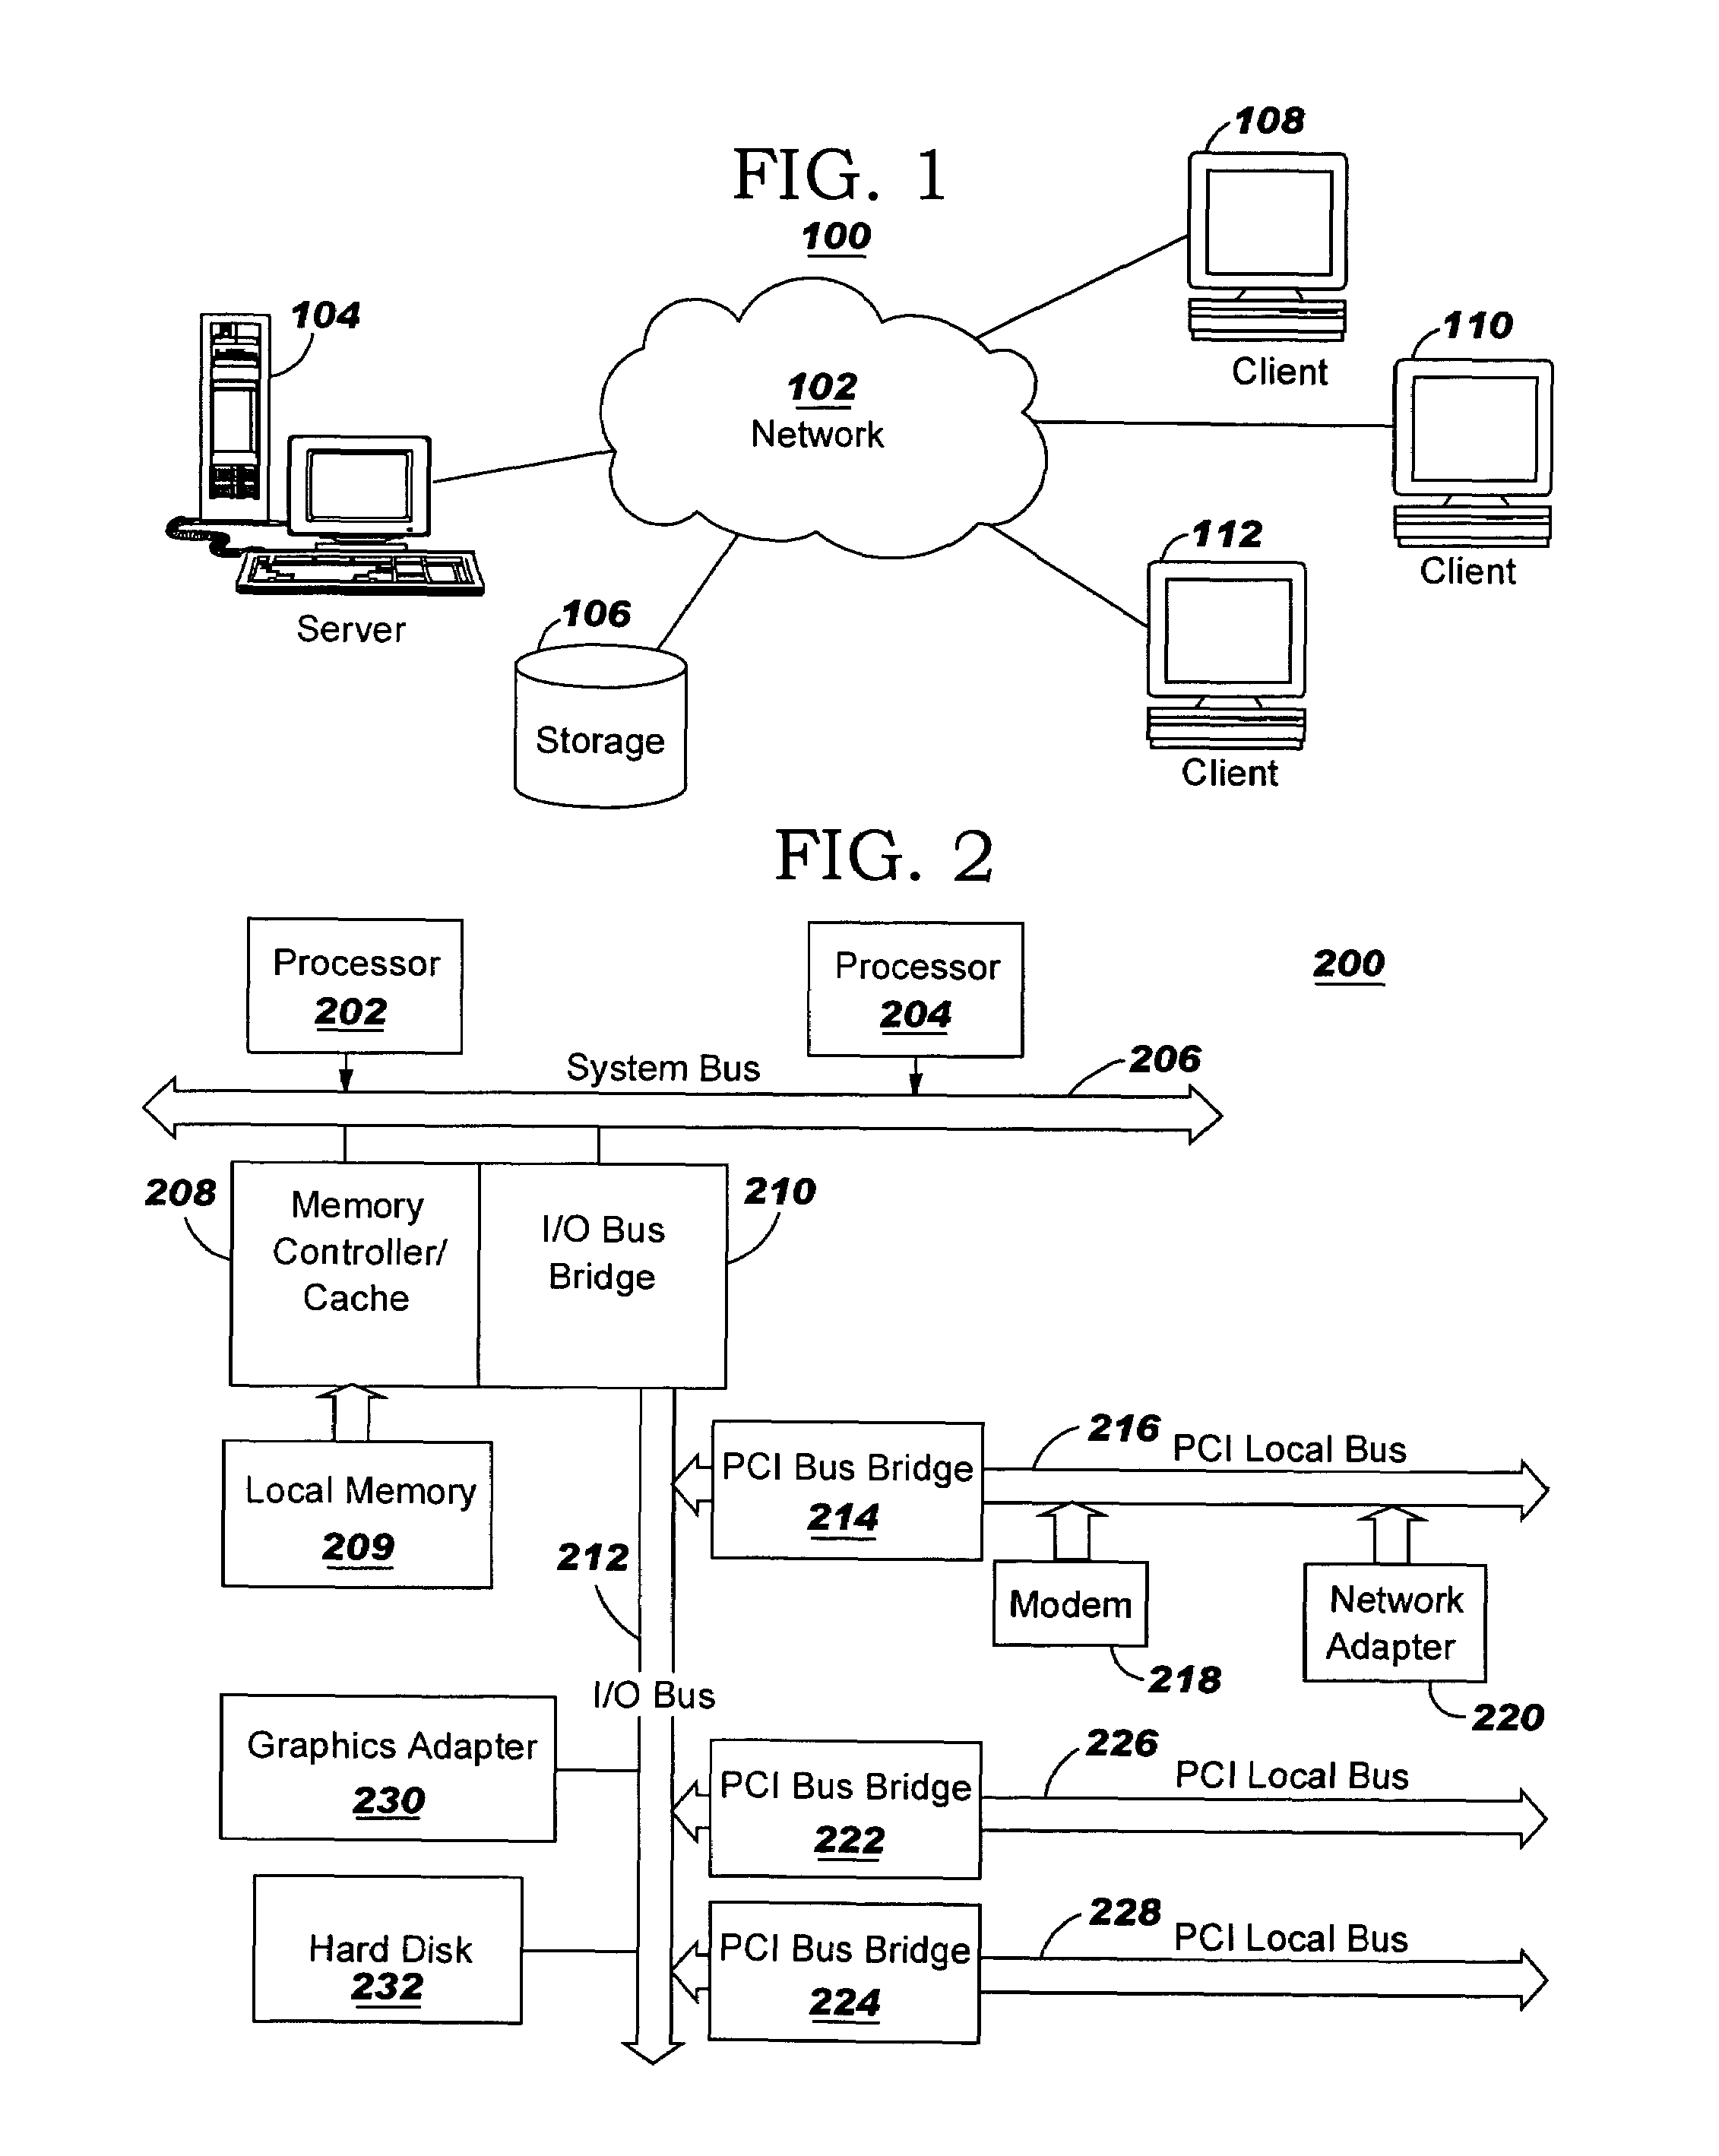
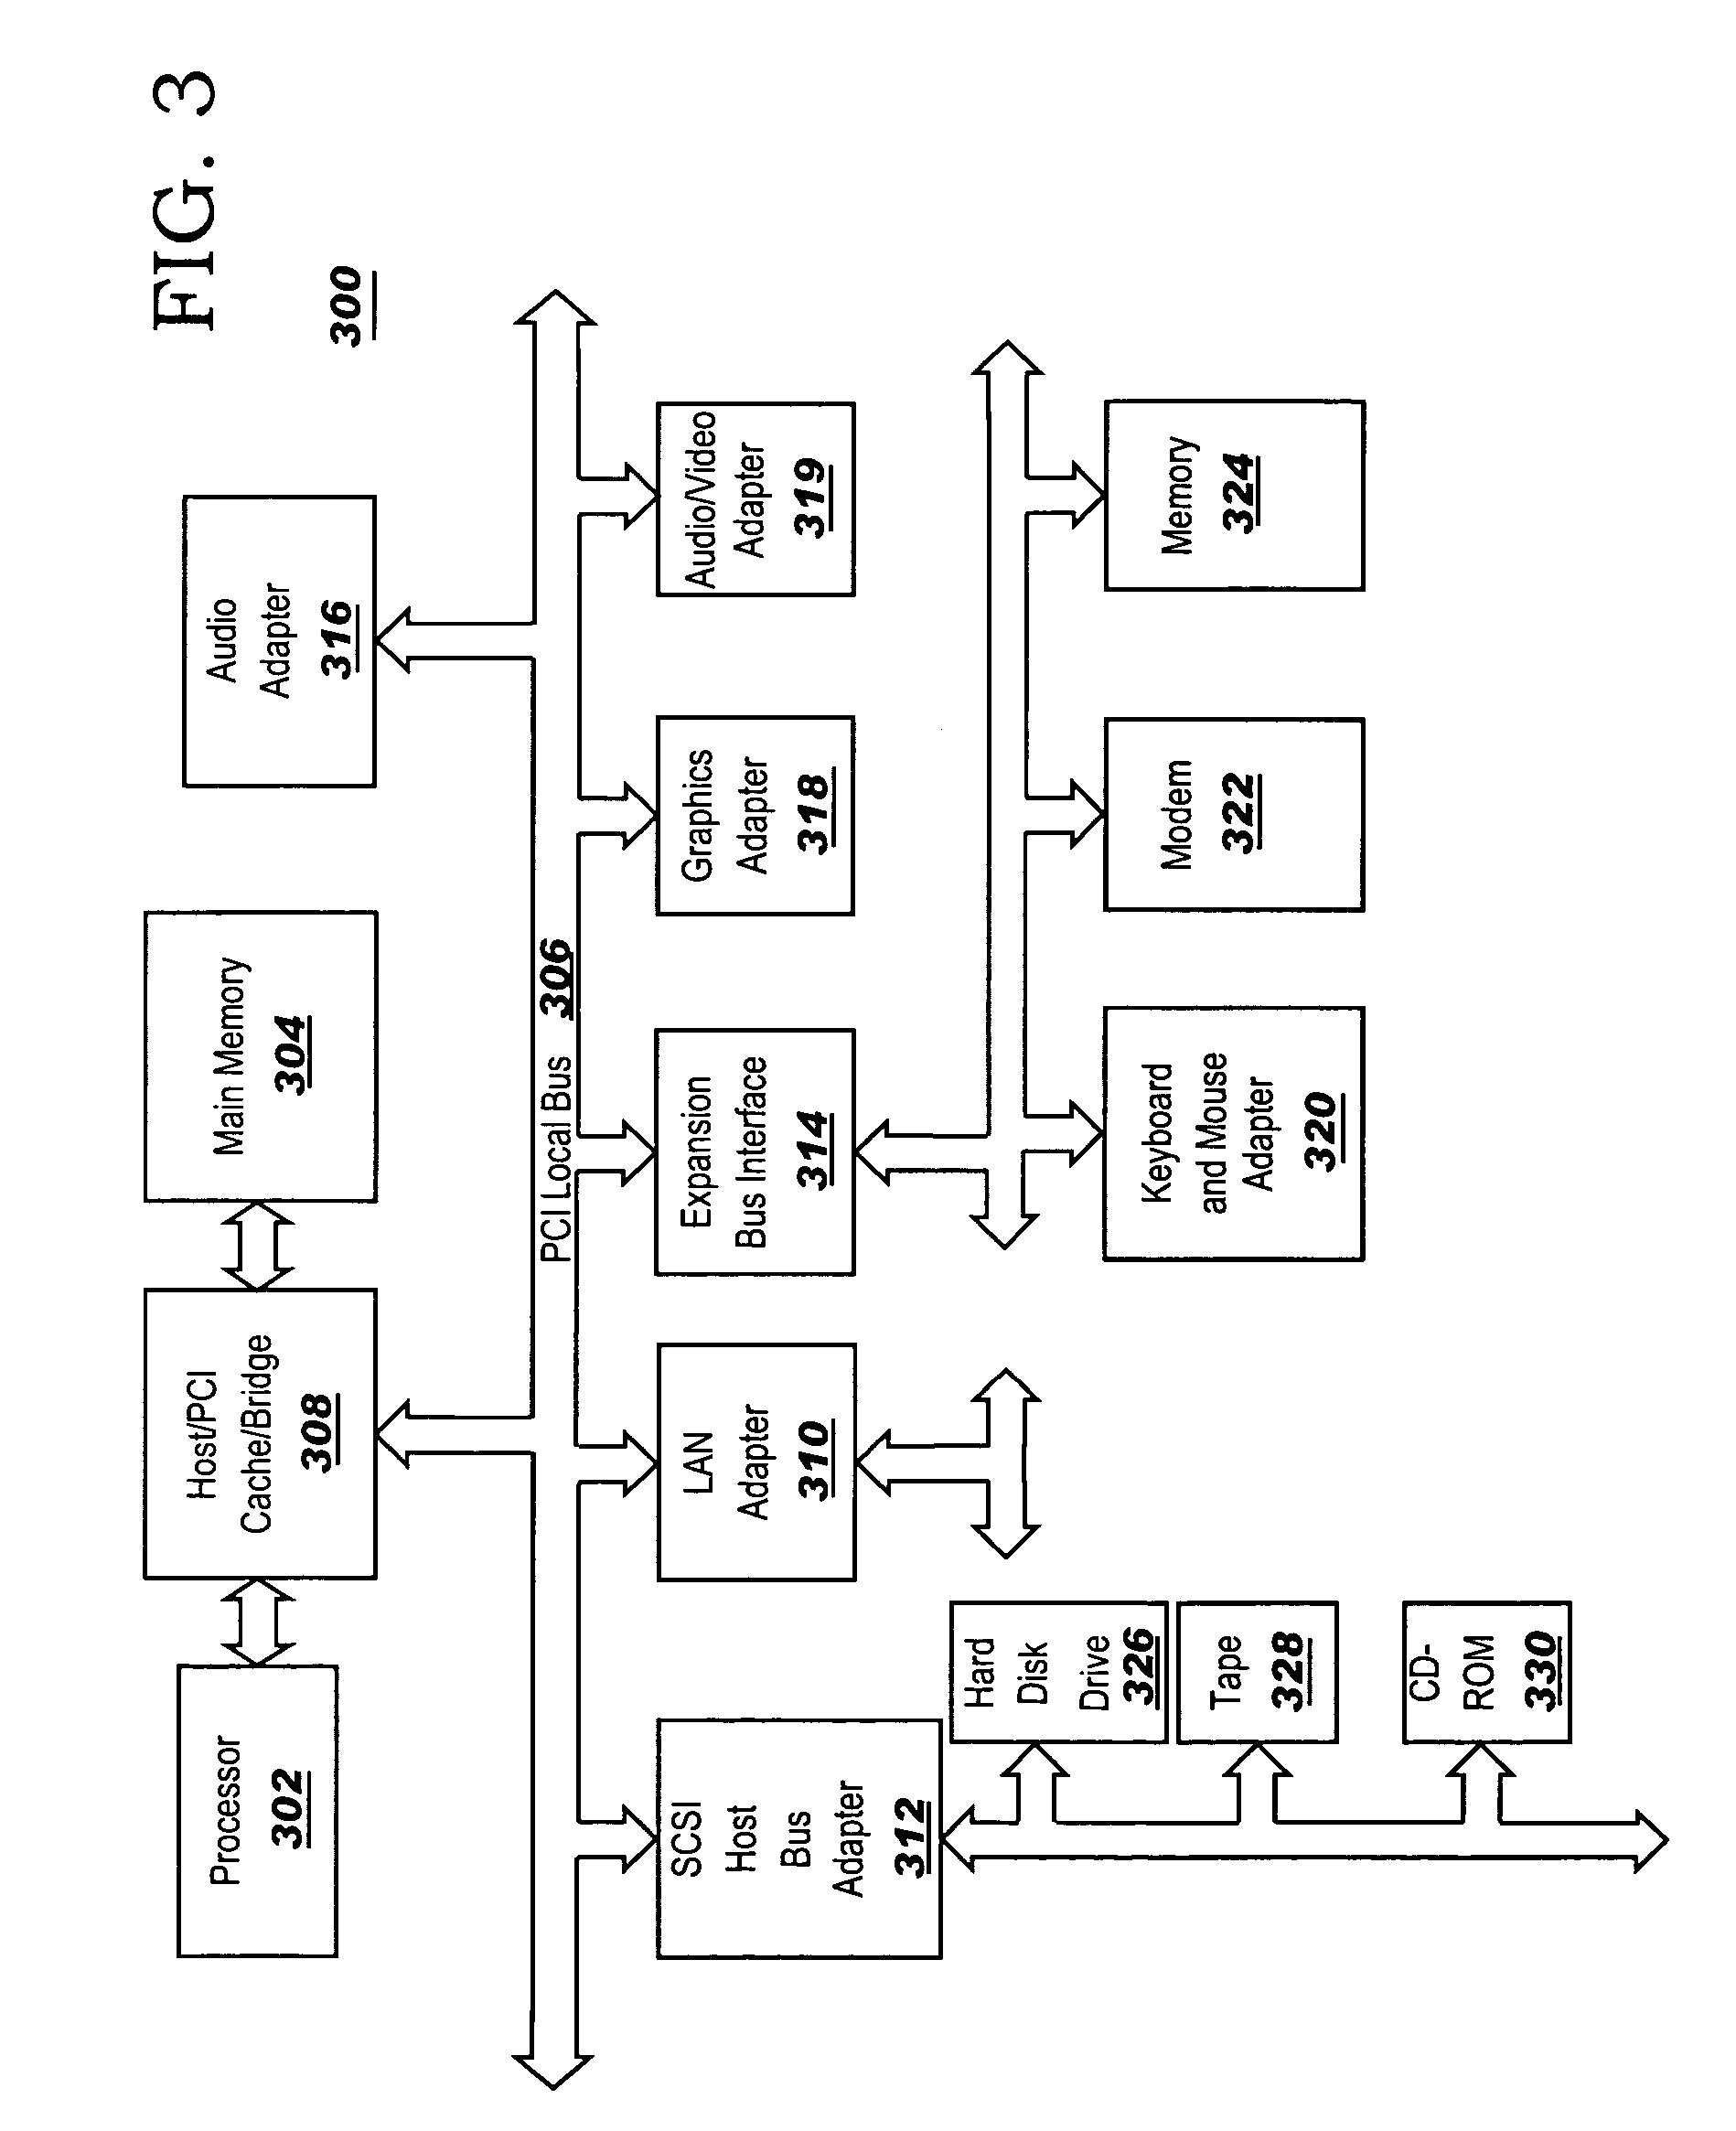
[0019]The present invention provides a system and method for visually rendering the affect of policies on the behavior of information technology (IT) infrastructure resources taking into account the relative importance of the policies in the policy-based IT infrastructure. The present invention is especially well suited for implementation in a distributed data processing system such as a local area network (LAN), wide area network (WAN), the Internet, or the like. As such, FIGS. 1-3 are provided as exemplary computing environments and computing devices in which aspects of the present invention may be implemented. It should be appreciated that FIGS. 1-3 are only exemplary and no limitation on the particular environments or computing devices that may be used to implement the present invention is intended to be stated or implied by the depictions in these figures.
[0020]With reference now to the figures, FIG. 1 depicts a pictorial representation of a network of data processing systems i...
PUM
 Abstract
Description
Claims
Application Information