Automatic root cause analysis of performance problems using auto-baselining on aggregated performance metrics

a technology of performance problems and root causes, applied in the field of automatic root cause analysis of performance problems, can solve problems such as difficult diagnosis of the root cause of a performance problem, and difficulty in identifying which subsystem or subsystem is responsible for a performance problem

Inactive Publication Date: 2010-10-19
CA TECH INC
View PDF8 Cites 20 Cited by
  • Summary
  • Abstract
  • Description
  • Claims
  • Application Information

AI Technical Summary

Problems solved by technology

However, in complex distributed systems, it is often difficult to diagnose the root cause of a performance problem.
Accordingly, identifying which subsystem or subsystems are responsible for a performance problem can be difficult, requiring manual analysis by an administrator.

Method used


Image

  • Automatic root cause analysis of performance problems using auto-baselining on aggregated performance metrics
  • Automatic root cause analysis of performance problems using auto-baselining on aggregated performance metrics
  • Automatic root cause analysis of performance problems using auto-baselining on aggregated performance metrics

Examples


Embodiment Construction

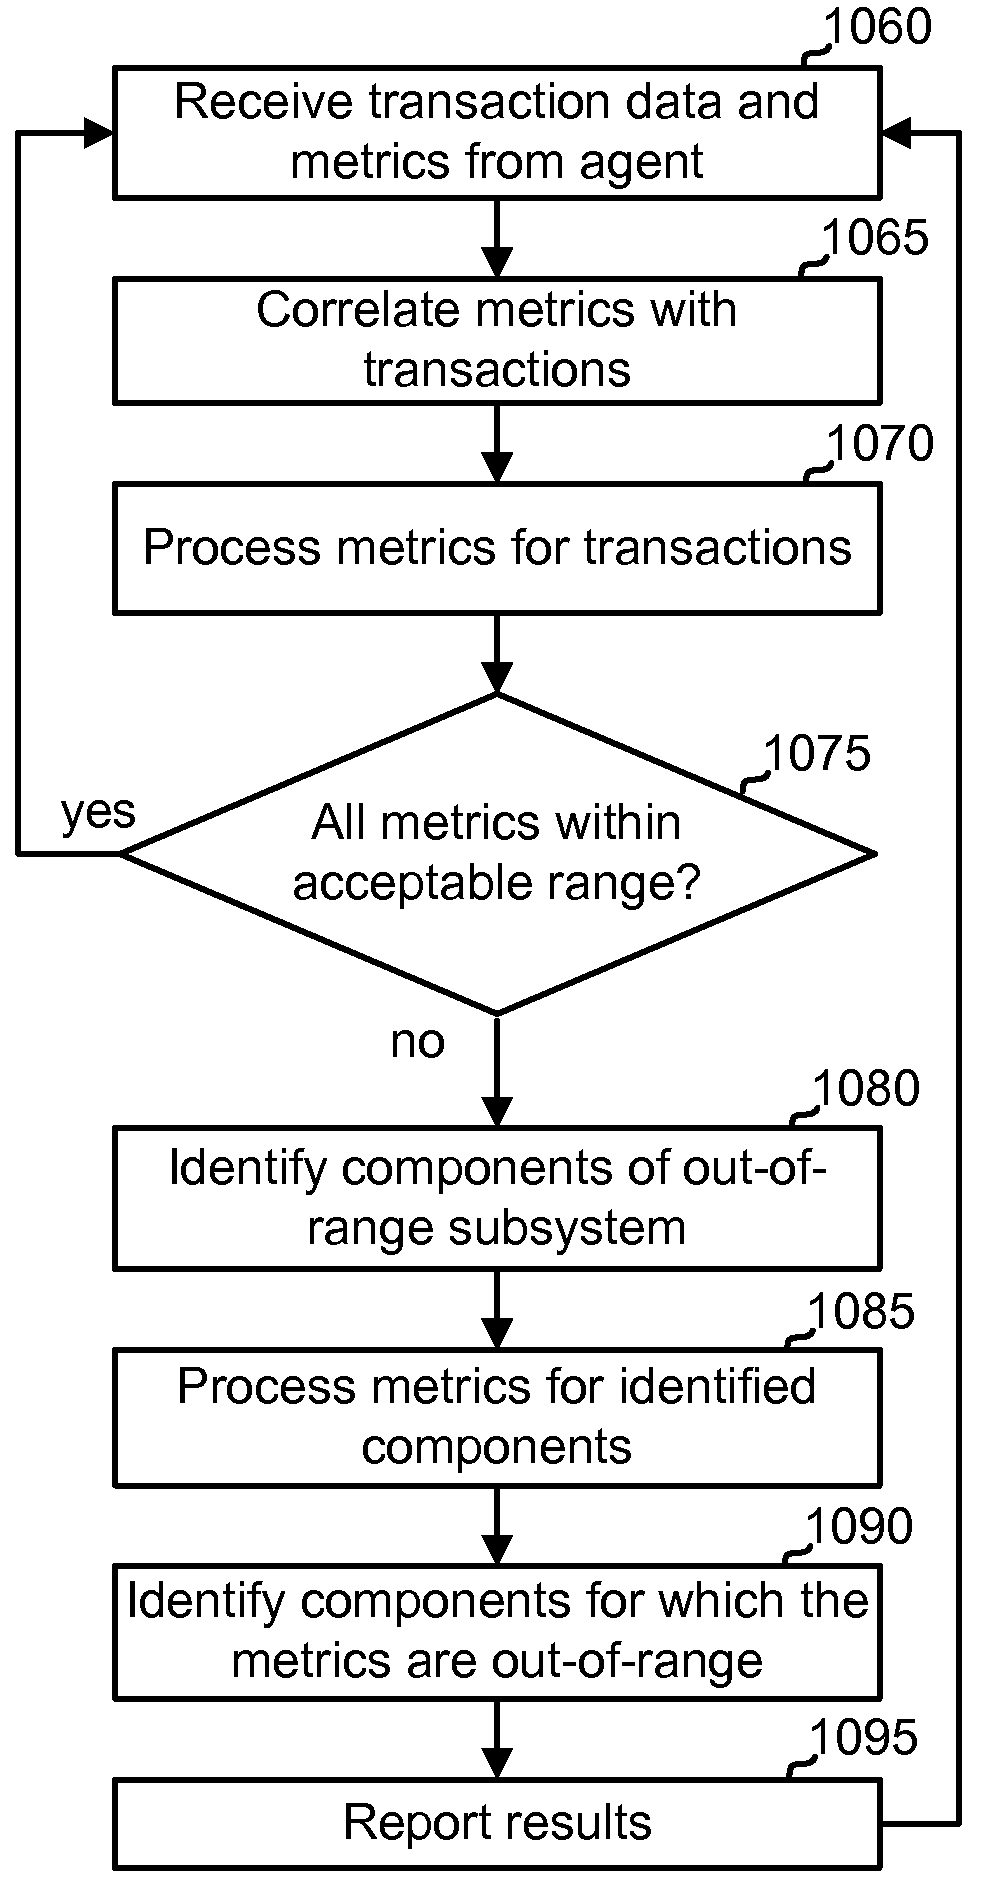
[0039]The present invention provides a system and method for automatically detecting anomalous behavior in a distributed system.

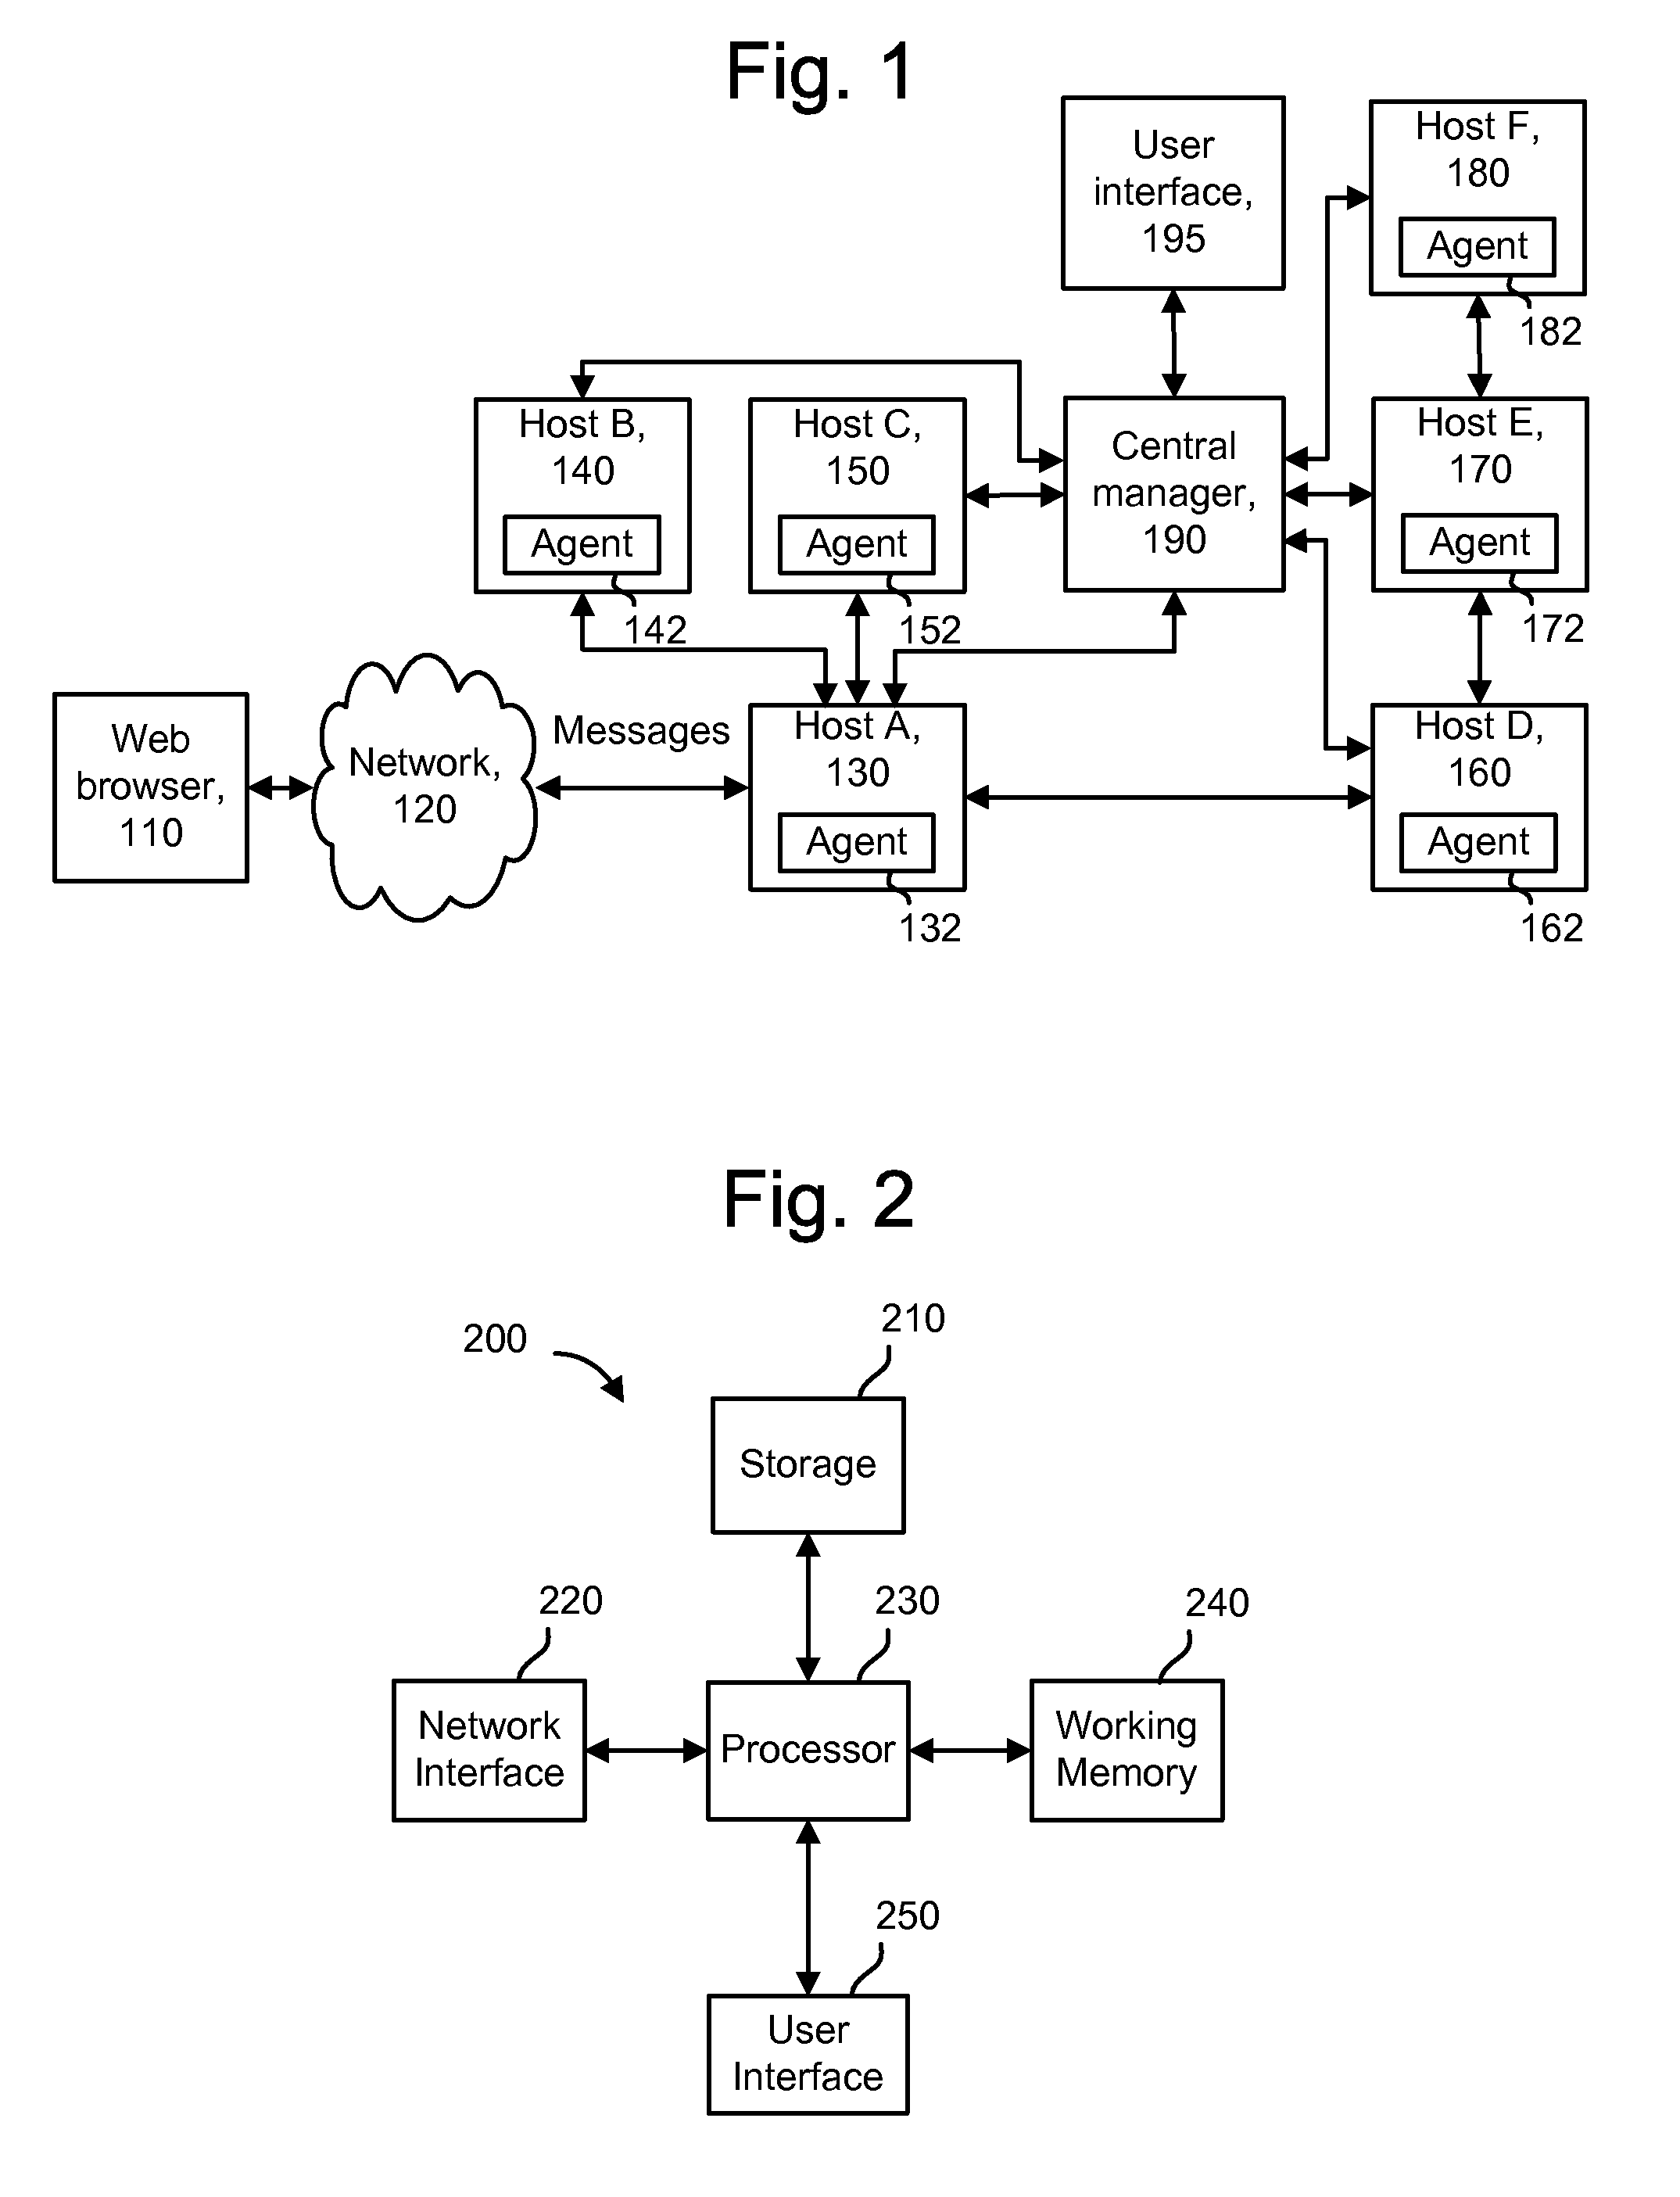
[0040]FIG. 1 depicts a system in which a number of hosts process requests from a client. The system is an example of a distributed system which includes subsystems such as host computers. A client such as a web browser 110, in response to user commands, exchanges messages with a host A 130, such as an application server, via a network 120 such as the Internet. The web browser 110 typically accesses the network 120 via an Internet Service Provider, not shown. While a single web browser is depicted, it is also possible for multiple web browsers or other clients, including automated clients such as other servers, to communicate messages to / from the host A 130 as well as other hosts. In the example, host A 130 communicates with a number of other hosts. For example, host A 130 can communicate with host B 140, host C 150 and / or host D 160. Host D 160, in turn, ca...


PUM


Abstract

Anomalous behavior in a distributed system is automatically detected. Metrics are gathered for transactions, subsystems and / or components of the subsystems. The metrics can identify response times, error counts and / or CPU loads, for instance. Baseline metrics and associated deviation ranges are automatically determined and can be periodically updated. Metrics from specific transactions are compared to the baseline metrics to determine if an anomaly has occurred. A drill down approach can be used so that metrics for a subsystem are not examined unless the metrics for an associated transaction indicate an anomaly. Further, metrics for a component, application which includes one or more components, or process which includes one or more applications, are not examined unless the metrics for an associated subsystem indicate an anomaly. Multiple subsystems can report the metrics to a central manager, which can correlate the metrics to transactions using transaction identifiers or other transaction context data.

Description

CROSS-REFERENCE TO RELATED APPLICATIONS[0001]This application is related to commonly assigned U.S. pat. application Ser. No. 11 / 559,755, filed Nov. 14, 2006 (published as US2008 / 0126413 on May 29, 2008), titled “Baselining Backend Component Error Rate To Determine Application Performance,” and U.S. pat. application Ser. No. 11 / 559,750, filed Nov. 14, 2006 (published as US2008 / 0109684 on May 8, 2008), titled “Baselining Backend Component Response Time To Determine Application Performance,” each of which is incorporated herein by reference, and to U.S. pat. application Ser. No. 11 / 758,232, filed Jun. 5, 2007 (published as US2008 / 0306711 on Dec. 11, 2008) titled “Programmatic Root Cause Analysis For Application Performance Management,”.BACKGROUND OF THE INVENTIONDescription of the Related Art[0002]The growing presence of the Internet as well as other computer networks such as intranets and extranets has brought many new applications in e-commerce, education and other areas. Organizatio...

Claims


Application Information

Patent Timeline
Patent Type & Authority Patents(United States)
IPC IPC(8): G06F15/173
CPCH04L43/06H04L43/0852H04L43/16
Inventor BANSAL, JYOTI KUMARSEIDMAN, DAVID ISAIAH
Owner CA TECH INC
Why Eureka
Try Eureka