Method for determining house prices indices

a technology of house price and index, applied in the direction of data processing applications, buying/selling/lease transactions, marketing, etc., can solve the problems of negative dispersion prediction, unusable and inaccurate estimation of dispersion, and likely decrease in the dispersion of residual values predicted by quadratic models

Active Publication Date: 2010-10-26
MAE FANNIE
View PDF16 Cites 28 Cited by
  • Summary
  • Abstract
  • Description
  • Claims
  • Application Information

AI Technical Summary

Benefits of technology

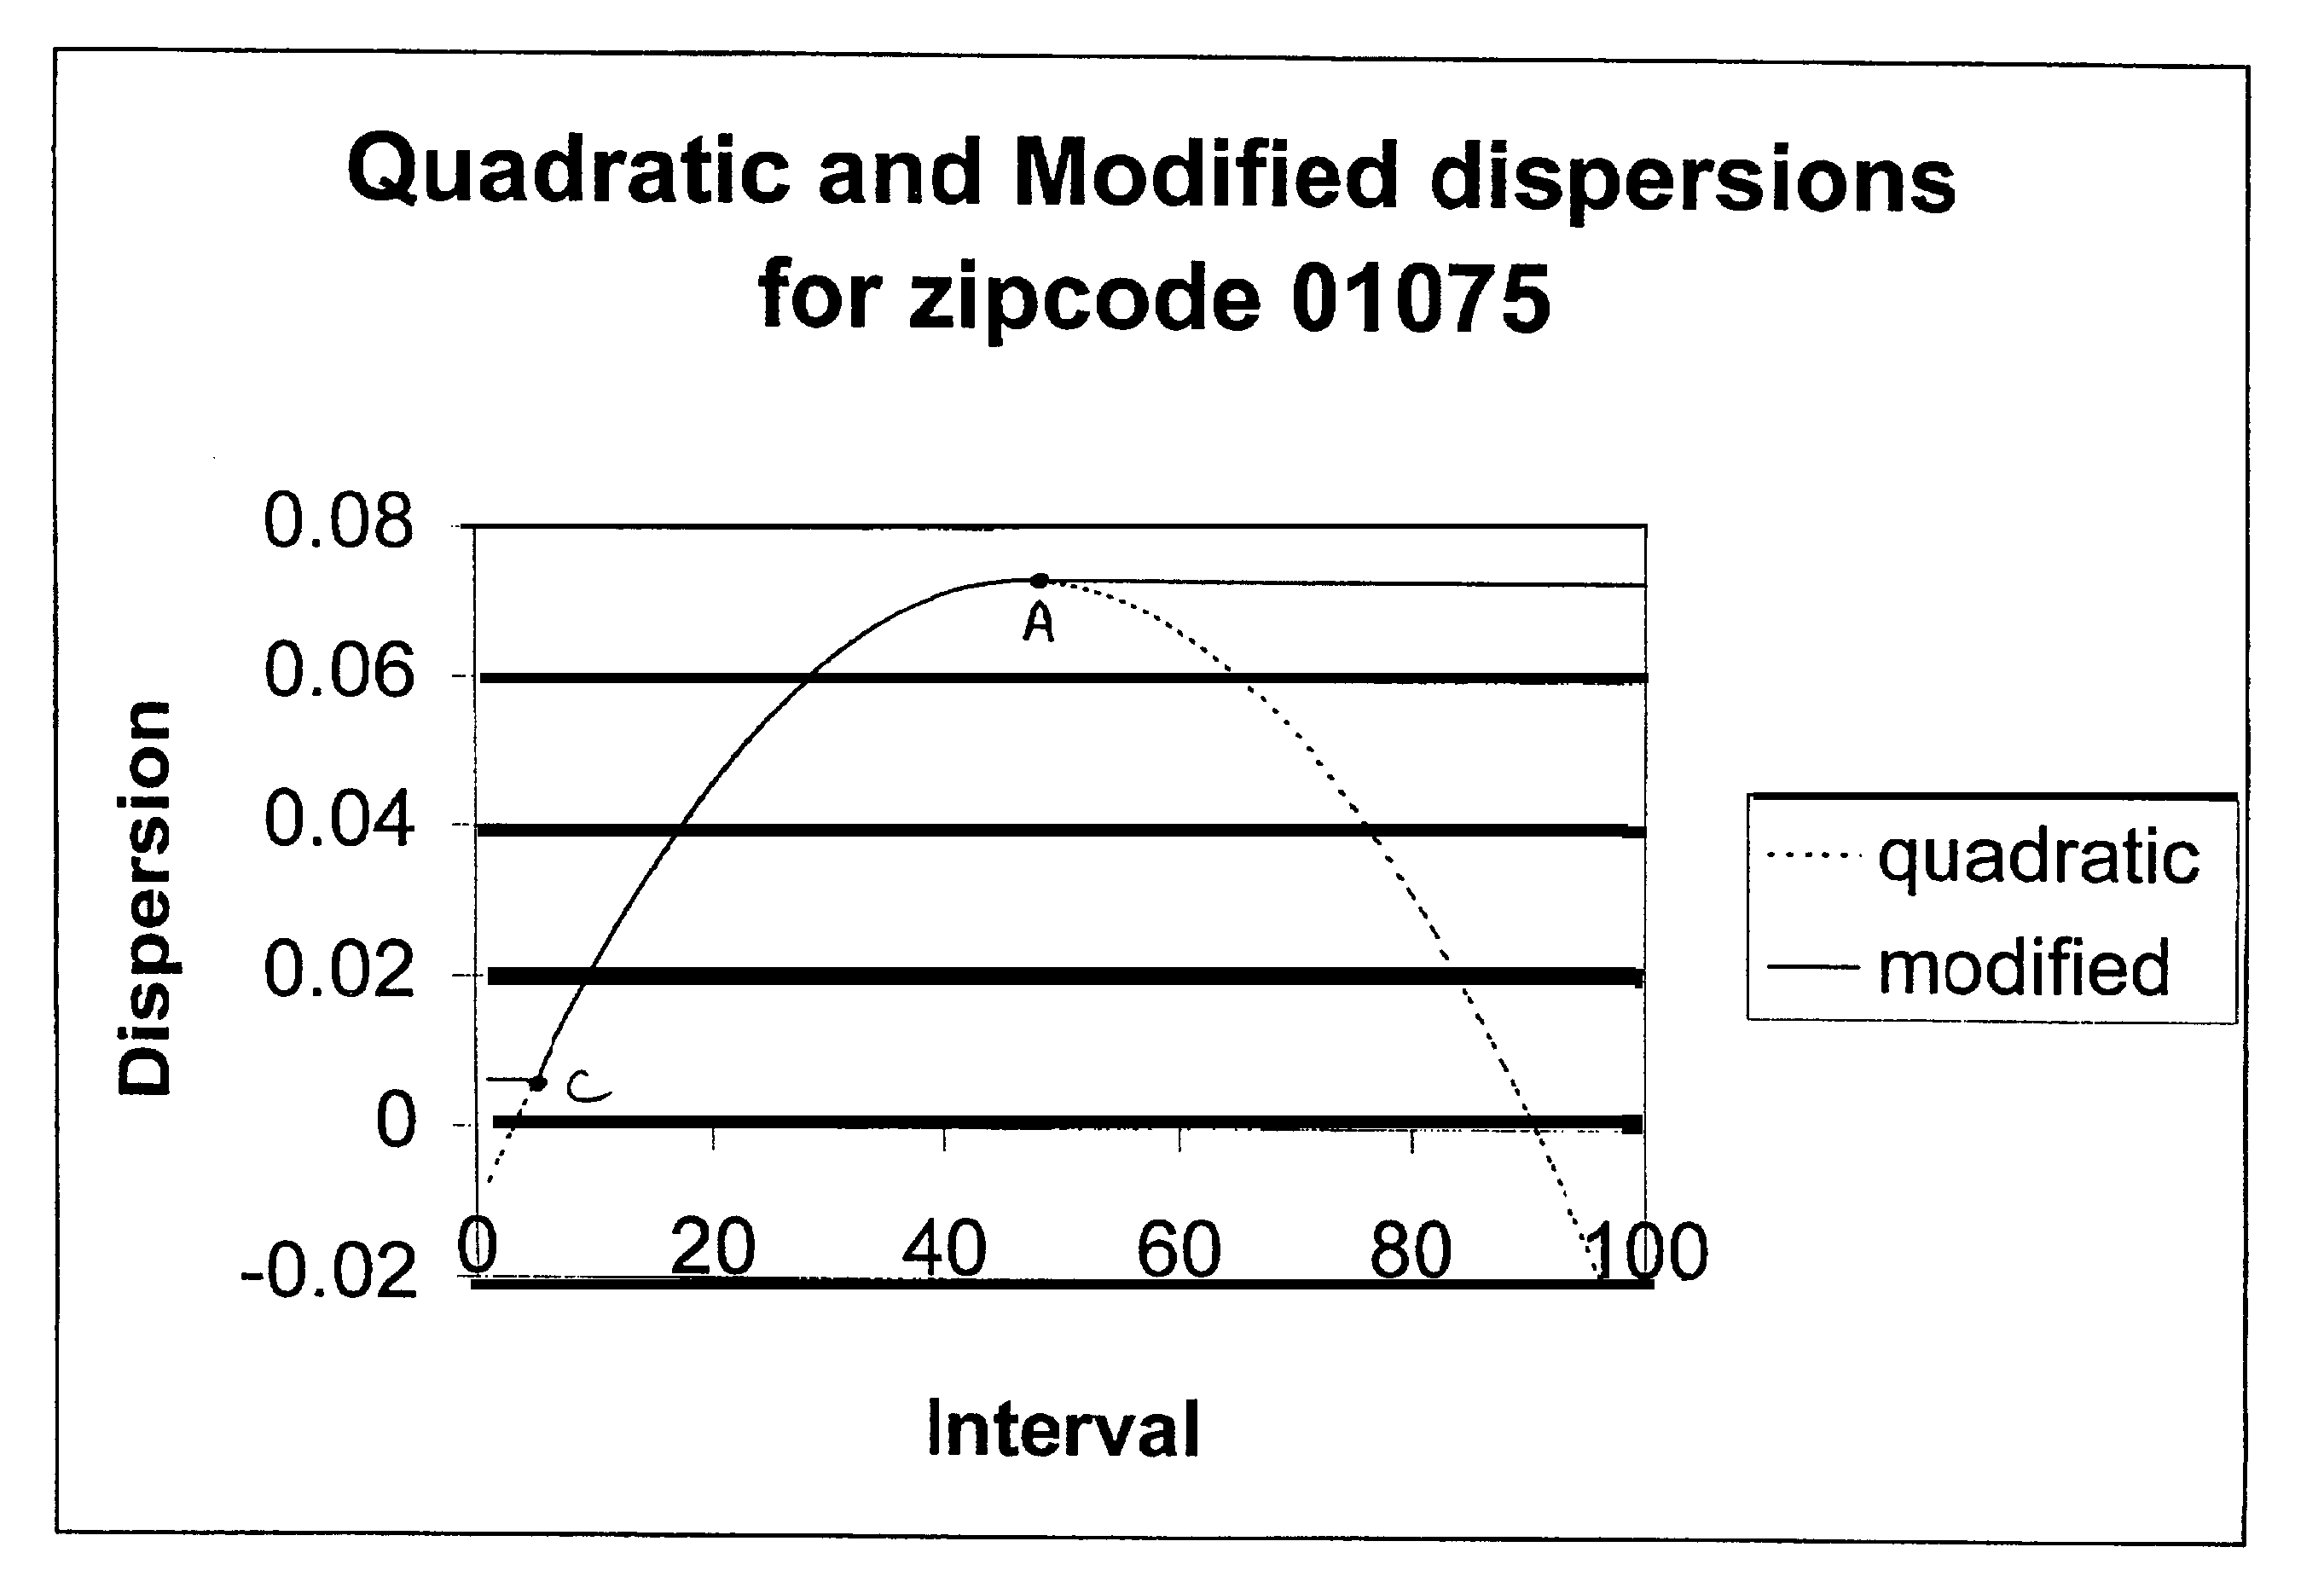
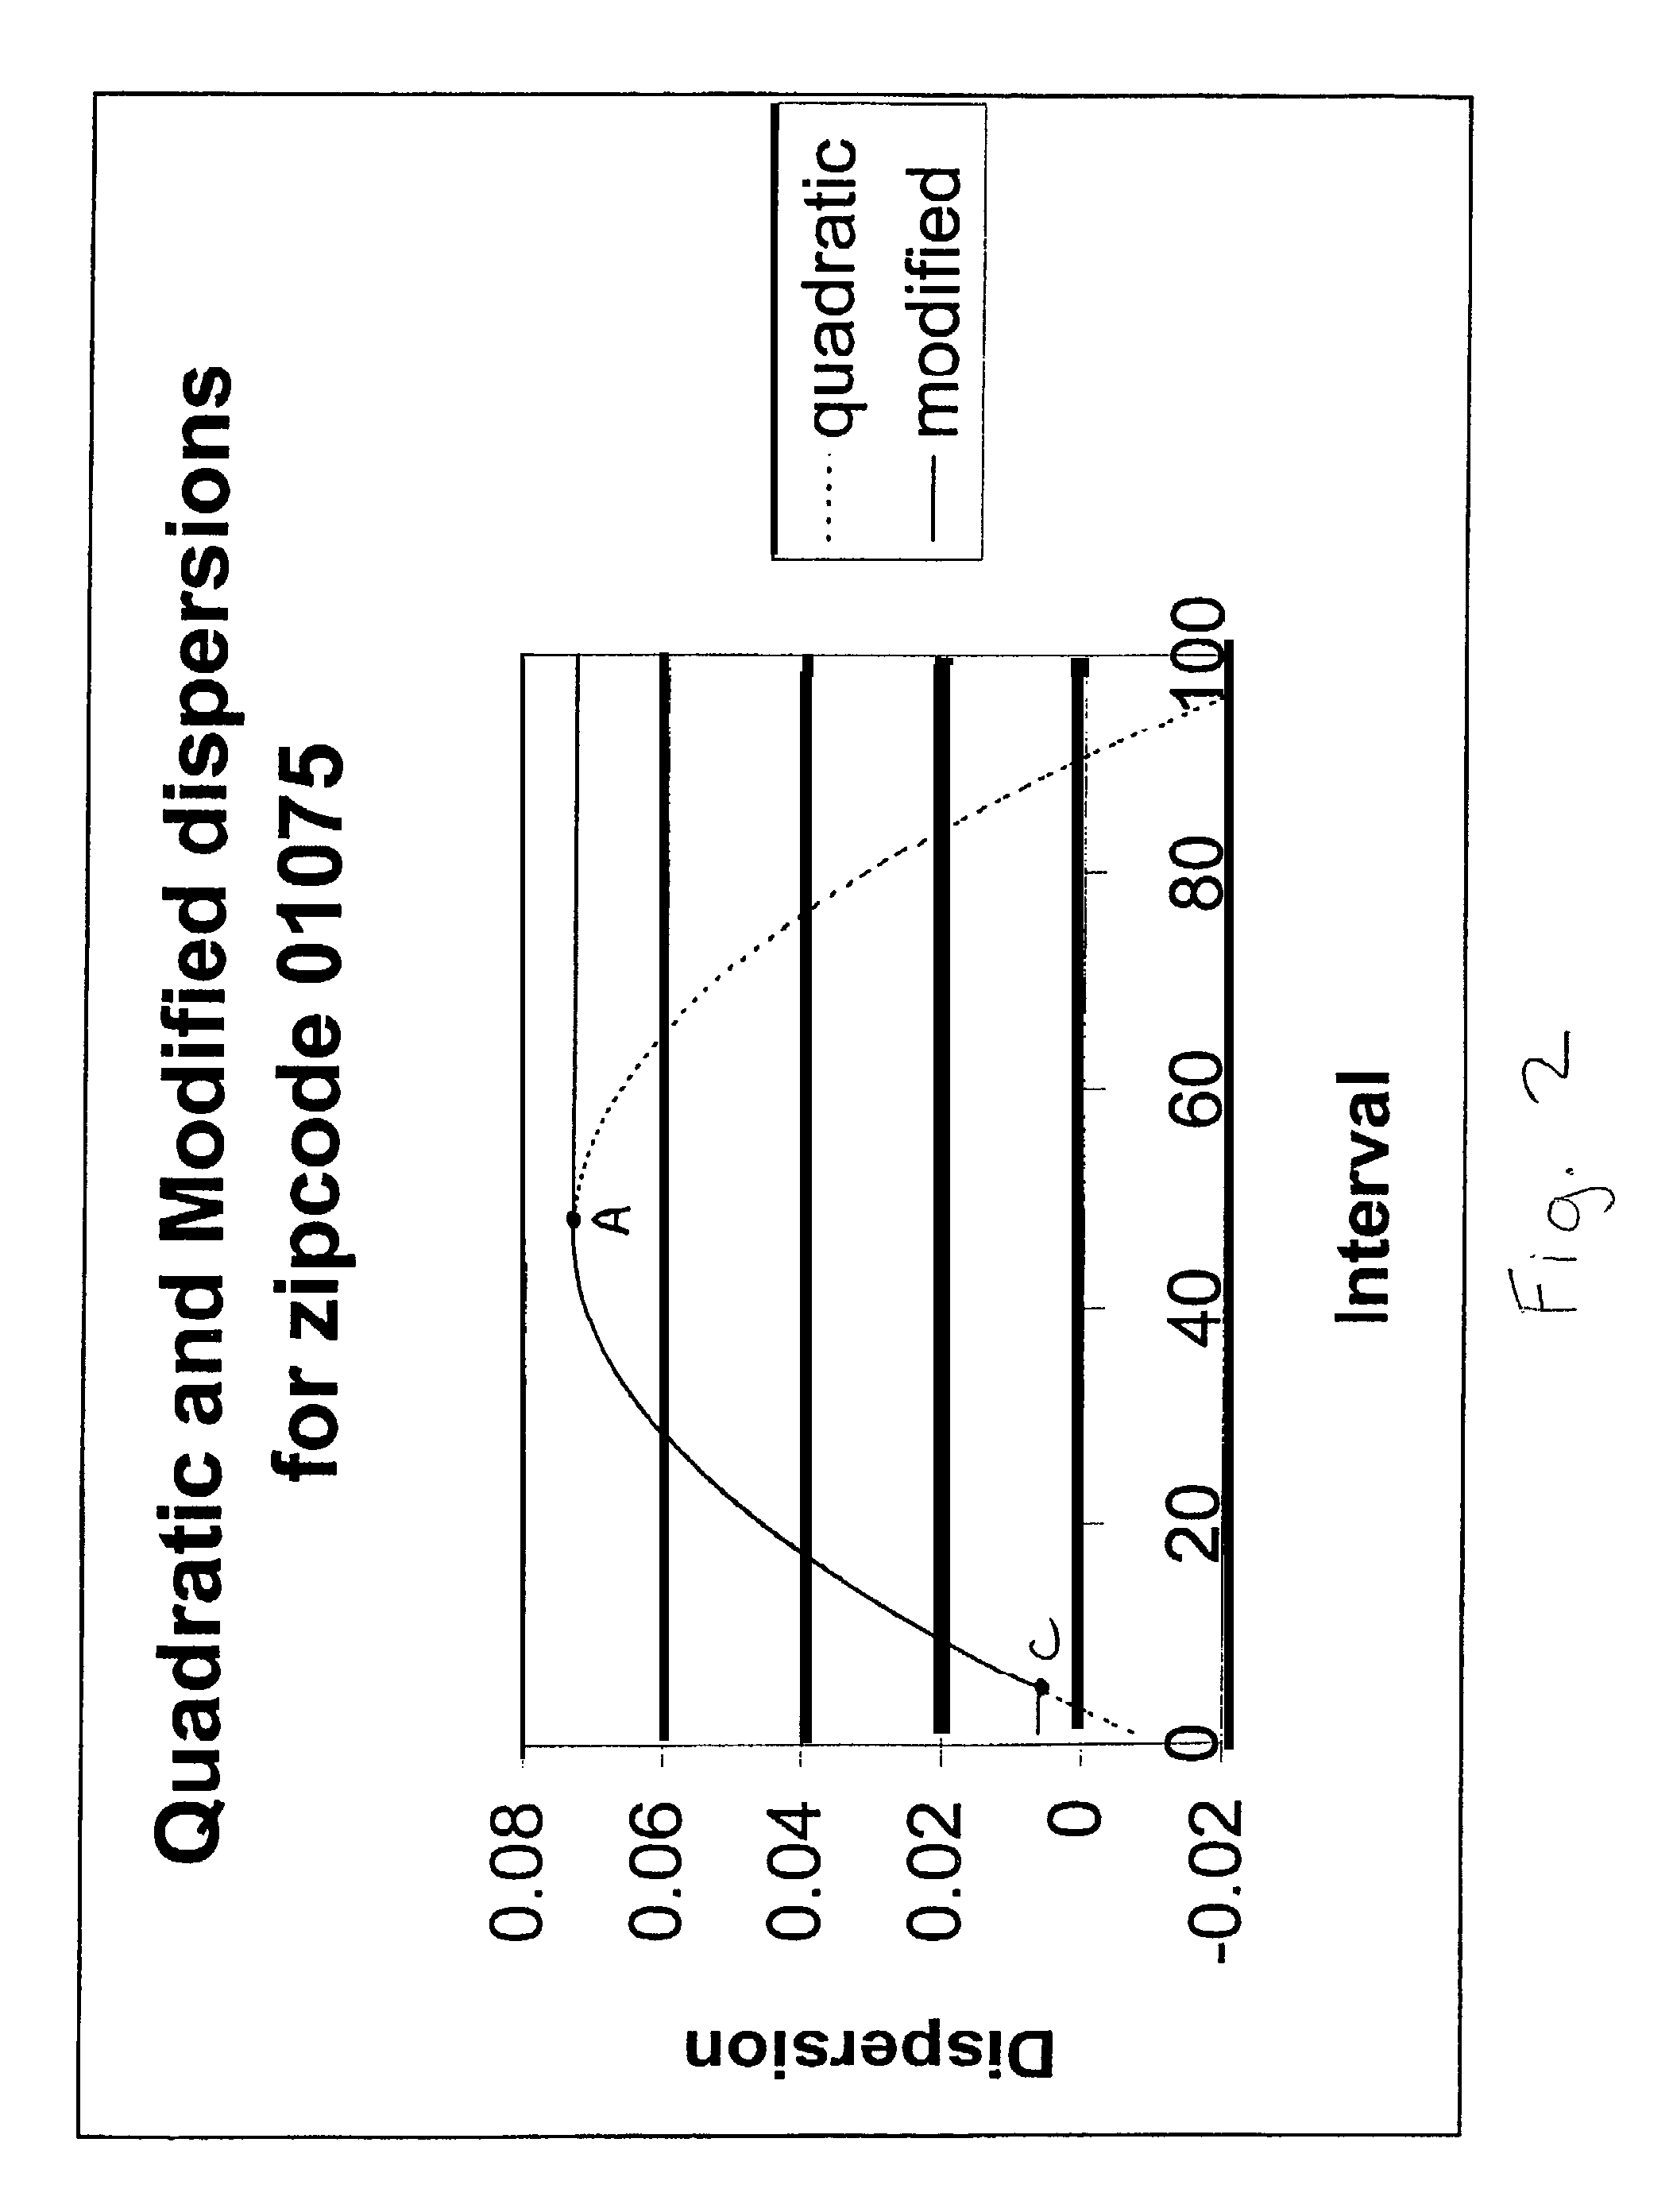
[0007]The present invention relates to a method for estimating a real estate price index based on a repeat sales model. The method includes the steps of eliminating corrupt portions of data used to determining price indices; regressing the difference in the log price of a second sale minus the log price of a first sale for a property on a set of dummy variables; eliminating the observations of zero residuals for the estimation of the dispersion function; using a quadratic formula to model and estimate a dispersion of residual values with respect to time interval; determining a minimum dispersion value calculated from the quadratic formula to modify the predicted negative dispersion; determining a maximum dispersion value calculated from the quadratic formula to modify the decreasing dispersion so that the dispersion values are prevented from decreasing with increasing time intervals; repeating the first-stage regression using the inverse of the square root of fitted values from the quadratic formula as weights; and obtaining an index series for a lower geographic level by using the index series of a higher geographic level.

Problems solved by technology

However, the application of real world data to the quadratic equation may yield a constant term that is negative, which often results in a prediction of negative dispersion when the time interval is short.
In addition, the dispersion of the residual values predicted by the quadratic model is likely to decrease when the interval between sales is long.
Since the occurrence of negative dispersion and the decreasing dispersion of residual values with increasing sales intervals run contrary to economic reasoning, the prediction by the quadratic model without a modification will produce unusable and inaccurate estimate of the dispersion.
These large sets of data inevitably contain some inaccurate values and some data that do not reflect market trends due to factors such as non-arms-length transactions and changes of building attributes.
It has been determined that faulty data is most likely to reveal itself as outlying data when compared with the entire data set.
The inclusion of outlying data in a data set used to calculate the price indices may undesirably skew the determined price index values.
Often there is insufficient data to estimate a complete series of index covering the entire time periods continuously.
Obviously, the index value for the time periods for which no data are available can not be estimated.
When the index value for a time period can be estimated, either in a complete or incomplete series, the index value may not necessarily be reliable.

Method used


Image

  • Method for determining house prices indices
  • Method for determining house prices indices
  • Method for determining house prices indices

Examples


example1

[0052][000011001000010000000000100000100000]Example⁢⁢1

[0053]In Step 502, the period for which the price index is desired is selected. If the estimation of price index is desired for the Tth period, then each (k,l) element of the Tth column that is equal to 1 designates the time periods for which the sales data is to be included for the determination of value. In Step 503, the Tth column is examined to determine all nonzero elements. For example, if the Tth period is the sixth (6th) period in the example, then the sixth column is examined to determine which elements of the column include a 1.

[0054]In Step 504, the time periods and their associated data that correspond to the identified elements of the examined column is selected for inclusion in the determination of the price index for the desired Tth period. In the above example, the first element in the sixth column, k=1 and l=6, is the only element that contains a 1. As a result, the sales for periods 1 and 6 are included for the ...


PUM


Abstract

A method for estimating a real estate price index based on a repeat sales model. The method includes the steps of eliminating corrupt portions of data used to determine price indices; regressing a difference in a log price of a second sale minus a log price of a first sale for a property on a set of dummy variables, eliminating the observations with zero residuals for estimating the dispersion function; using a quadratic formula to model a dispersion of residual values with respect to time interval; using the quadratic formula to solve for a dispersion for each time interval starting with a minimum positive value; determining a minimum dispersion value that is a value calculated from the quadratic formula; determining a maximum dispersion value that is calculated from the quadratic formula for each time interval starting with a minimum positive value, wherein the dispersion values are prevented from decreasing with increasing time intervals; repeating the step of regressing using the inverse of the square root of fitted values from the quadratic formula as weights; identifying and selecting the time periods and associated data for estimating a price index that covers a particular time period; excluding the index values which are determined to be unreliable; and obtaining an index series for a lower geographic level by using the index series of a higher geographic level.

Description

[0001]This application claims the benefit of U.S. Provisional Application No. 60 / 342,845, filed on Dec. 28, 2001, hereby incorporated by reference.FIELD OF THE INVENTION[0002]The present invention relates to a method and apparatus for determining a real estate price index associated with properties in a real estate market by using a repeat sales model.BACKGROUND OF THE INVENTION[0003]Repeat sales index models use actual sales prices and time data points to estimate a market-level home price index. Home price index is one of the most important factors in understanding the housing market trends and activities. The present value of a property may be estimated from the price index using the prior sale information. One repeat sales model proposed by Bailey, Muth, and Nourse (the BMN model) specifies that the change in the logarithm price of a property over a known period of time is equal to the change in the logarithmic price index plus an error term. Another repeat sales model by Case a...

Claims


Application Information

Patent Timeline
Patent Type & Authority Patents(United States)
IPC IPC(8): G06Q50/00
CPCG06Q30/06G06Q50/16G06Q30/0202G06Q30/0206
Inventor KUO, CHIONGLONG
Owner MAE FANNIE
Why Eureka
Try Eureka