System and methods for calibrating pricing power and risk scores

a pricing power and risk score technology, applied in the field of system and method for calibrating pricing power and risk score, can solve the problems of b2b markets renowned for being data-poor environments, affecting the effectiveness of classical approaches to price optimization, and requiring large sets of accurate and complete historical sales data

Active Publication Date: 2012-10-30
VENDAVO
View PDF114 Cites 29 Cited by
  • Summary
  • Abstract
  • Description
  • Claims
  • Application Information

AI Technical Summary

Problems solved by technology

There are major challenges in business to business (hereinafter “B2B”) markets which hinder the effectiveness of classical approaches to price optimization.
Also, B2B markets are renowned for being data-poor environments.
Availability of large sets of accurate and complete historical sales data is scarce.
There is no existing literature on optimization of negotiation terms and processes, neither at the product / segment level nor at the customer level.
Finally, B2B environments suffer from poor customer segmentation.
Top-down price segmentation approaches are rarely the answer.
Furthermore, price bands within customer segments are often too large and customer behavior within each segment is non-homogeneous.
These approaches are exclusively concerned with perishable products (e.g. airline seats) and are not pricing optimization approaches per se.
While this approach has been applied rather successfully in B2C markets, where the benefits of price optimization outweigh the loss of a few customers, its application to B2B markets is questionable.
No meaningful customer behavior can be modeled without sizable changes in customer prices (both price increases and decreases).
In B2B markets, where a small fraction of customers represent a substantial fraction of the overall business, these sizable price-changing tests can have adverse impact on business.
High prices can drive large customers away with potentially a significant loss of volume.
Most of the suggested price changes from these solutions are not implemented.
Even when they are implemented, these price changes tend not to stick.
Furthermore, the maintenance of such pricing solutions usually requires a lot of effort.
This effort includes substantial and expensive on-going consulting engagements with the pricing companies.

Method used


Image

  • System and methods for calibrating pricing power and risk scores
  • System and methods for calibrating pricing power and risk scores
  • System and methods for calibrating pricing power and risk scores

Examples


Embodiment Construction

[0085]The present invention will now be described in detail with reference to selected preferred embodiments thereof as illustrated in the accompanying drawings. In the following description, numerous specific details are set forth in order to provide a thorough understanding of the present invention. It will be apparent, however, to one skilled in the art, that the present invention may be practiced without some or all of these specific details. In other instances, well known process steps and / or structures have not been described in detail in order to not unnecessarily obscure the present invention. The features and advantages of the present invention may be better understood with reference to the drawings and discussions that follow.

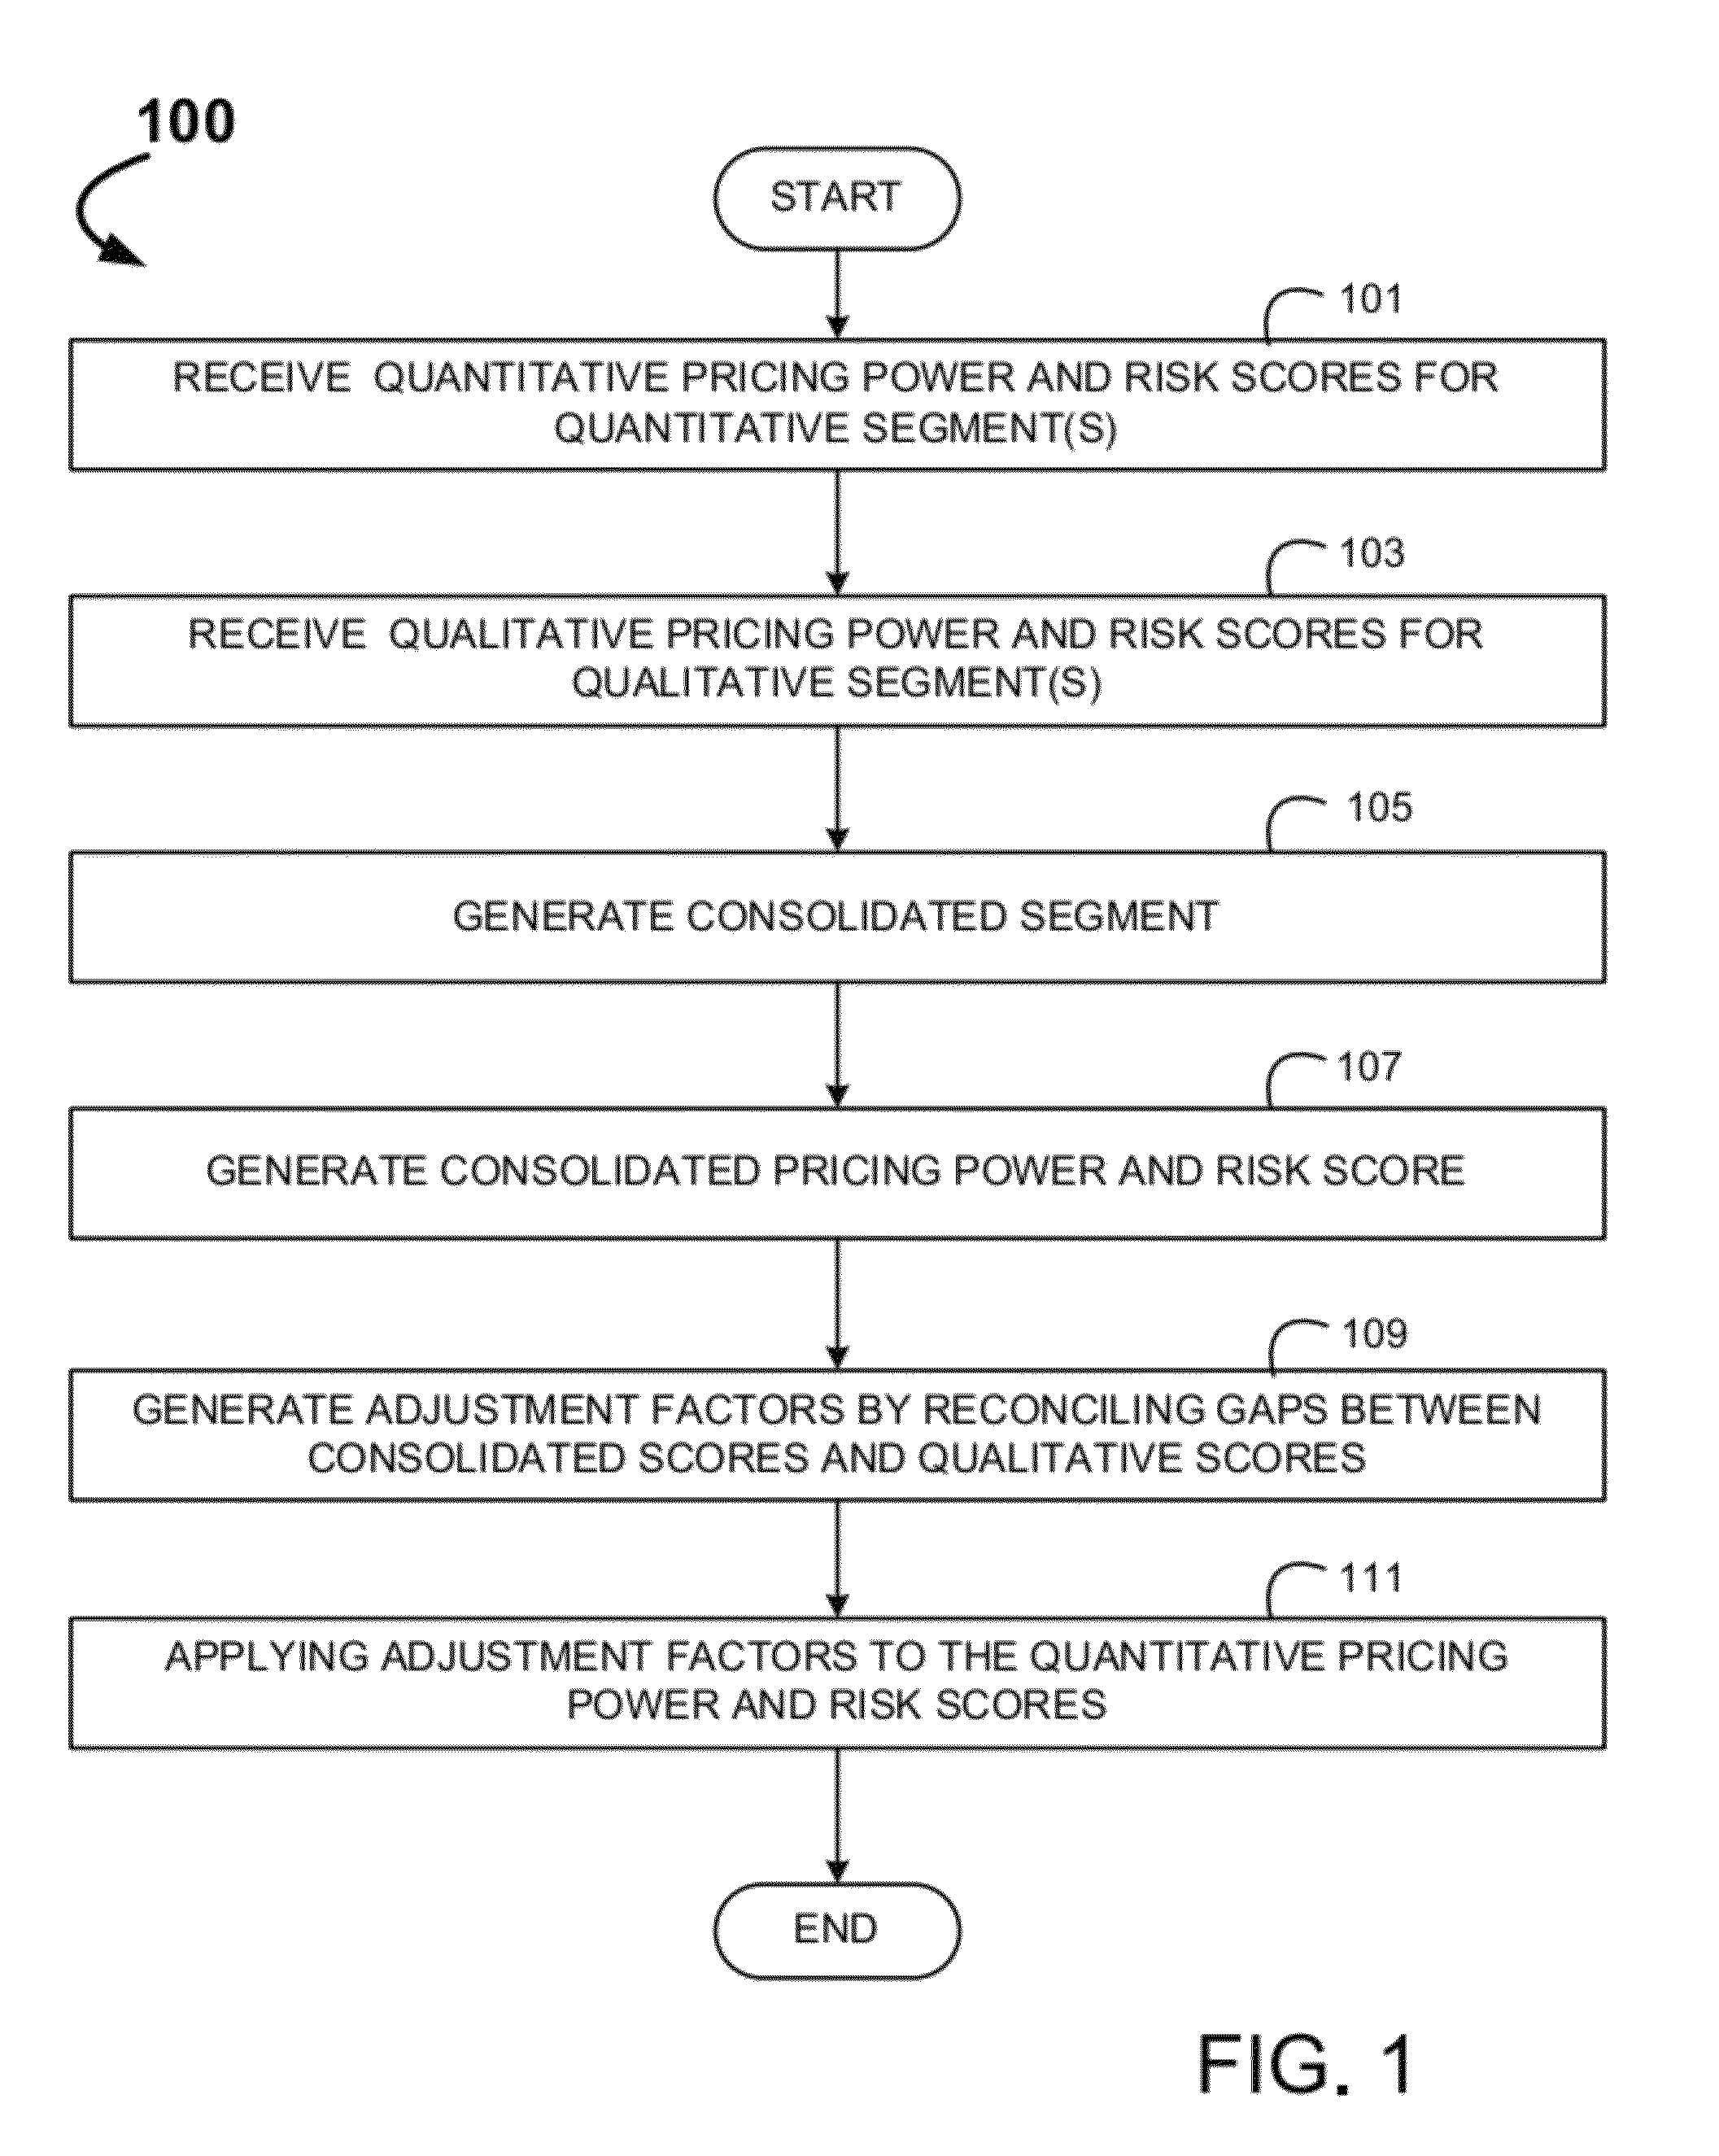
[0086]To facilitate discussion, FIG. 1 is a high level flowchart illustrating calibrating Pricing Power and Risk scores, shown generally at 100. Quantitative pricing power and risk scores are received at step 101. Quantitative pricing power and risk s...


PUM


Abstract

A power and risk score calibrator is provided, which receives quantitative power and risk scores for each quantitative segment, and receives qualitative power and risk scores for each qualitative segment. The qualitative segment and the qualitative power and risk scores are defined by a user. The system generates consolidated segments. Then consolidated power and risk scores for each of the consolidated segments are generated, respectively. The gaps between the qualitative power and risk scores and the consolidated power and risk scores are reconciled. From these reconciliations, adjustment factors are generated, which are applied by pricing power and risk value calibrators. The system may also perform a drill down to explain the gap between the qualitative scores and the consolidated scores.

Description

CROSS REFERENCE TO RELATED APPLICATIONS[0001]This application is a continuation-in-part of U.S. patent application Ser. No. 11 / 938,714, filed on Nov. 12, 2007, by Jens E. Tellefsen and Jeffrey D. Johnson, entitled “Systems and Methods for Price Optimization using Business Segmentation”, which in turn is a continuation-in-part of U.S. patent application Ser. No. 11 / 415,877 filed May 2, 2006, and also claims priority of U.S. Provisional patent application Ser. No. 60 / 865,643 filed on Nov. 13, 2006, which applications are incorporated herein in their entirety by this reference.[0002]This application is related to co-pending and concurrently filed application Ser. No. 12 / 408,862, filed Mar. 23, 2009, by Jamie Rapperport, Jeffrey D. Johnson, Gianpaolo Callioni, Allan David Ross Gray, Sean Geraghty, Vlad Gorlov and Amit Mehra, entitled “System and Methods for Generating Quantitative Pricing Power and Risk Scores”, currently pending, which application is incorporated herein in its entirety...

Claims


Application Information

Patent Timeline
Patent Type & Authority Patents(United States)
IPC IPC(8): G06Q99/00
CPCG06Q10/04G06Q10/06G06Q30/02G06Q30/0206Y02P90/82
Inventor RAPPERPORT, JAMIEJOHNSON, JEFFREY D.CALLIONI, GIANPAOLOROSS GRAY, ALLAN DAVIDGERAGHTY, SEANGORLOV, VLADMEHRA, AMIT
Owner VENDAVO
Why Eureka
Try Eureka