Machine-based population stability index selection

machine-based technology, applied in the field of apparatus and methods for selecting a population stability index threshold, can solve the problems of modifying the risk associated with the population, and the table 2 scheme may be inadequate for the identification of population shifts

Active Publication Date: 2012-12-04
BANK OF AMERICA CORP
View PDF3 Cites 5 Cited by
  • Summary
  • Abstract
  • Description
  • Claims
  • Application Information

AI Technical Summary

Benefits of technology

[0022]Apparatus and methods for quantifying a difference between a first population distribution and a second population distribution are provided. The apparatus and methods may use randomly generated population distribution differences to map a population stability index to a population distribution difference function.

Problems solved by technology

A change in conditions, such as economic conditions, political conditions, weather conditions and the like, may modify the risk associated with the population.
The Table 2 scheme therefore may be inadequate for the identification of population shifts that are economically meaningful.
When analyzing shifts over a shorter time period, however, even economically significant shifts may not generate PSIs that are large enough to cause the Table 2 scheme to indicate slight to significant shifts and may therefore be overlooked.

Method used


Image

  • Machine-based population stability index selection
  • Machine-based population stability index selection
  • Machine-based population stability index selection

Examples


Embodiment Construction

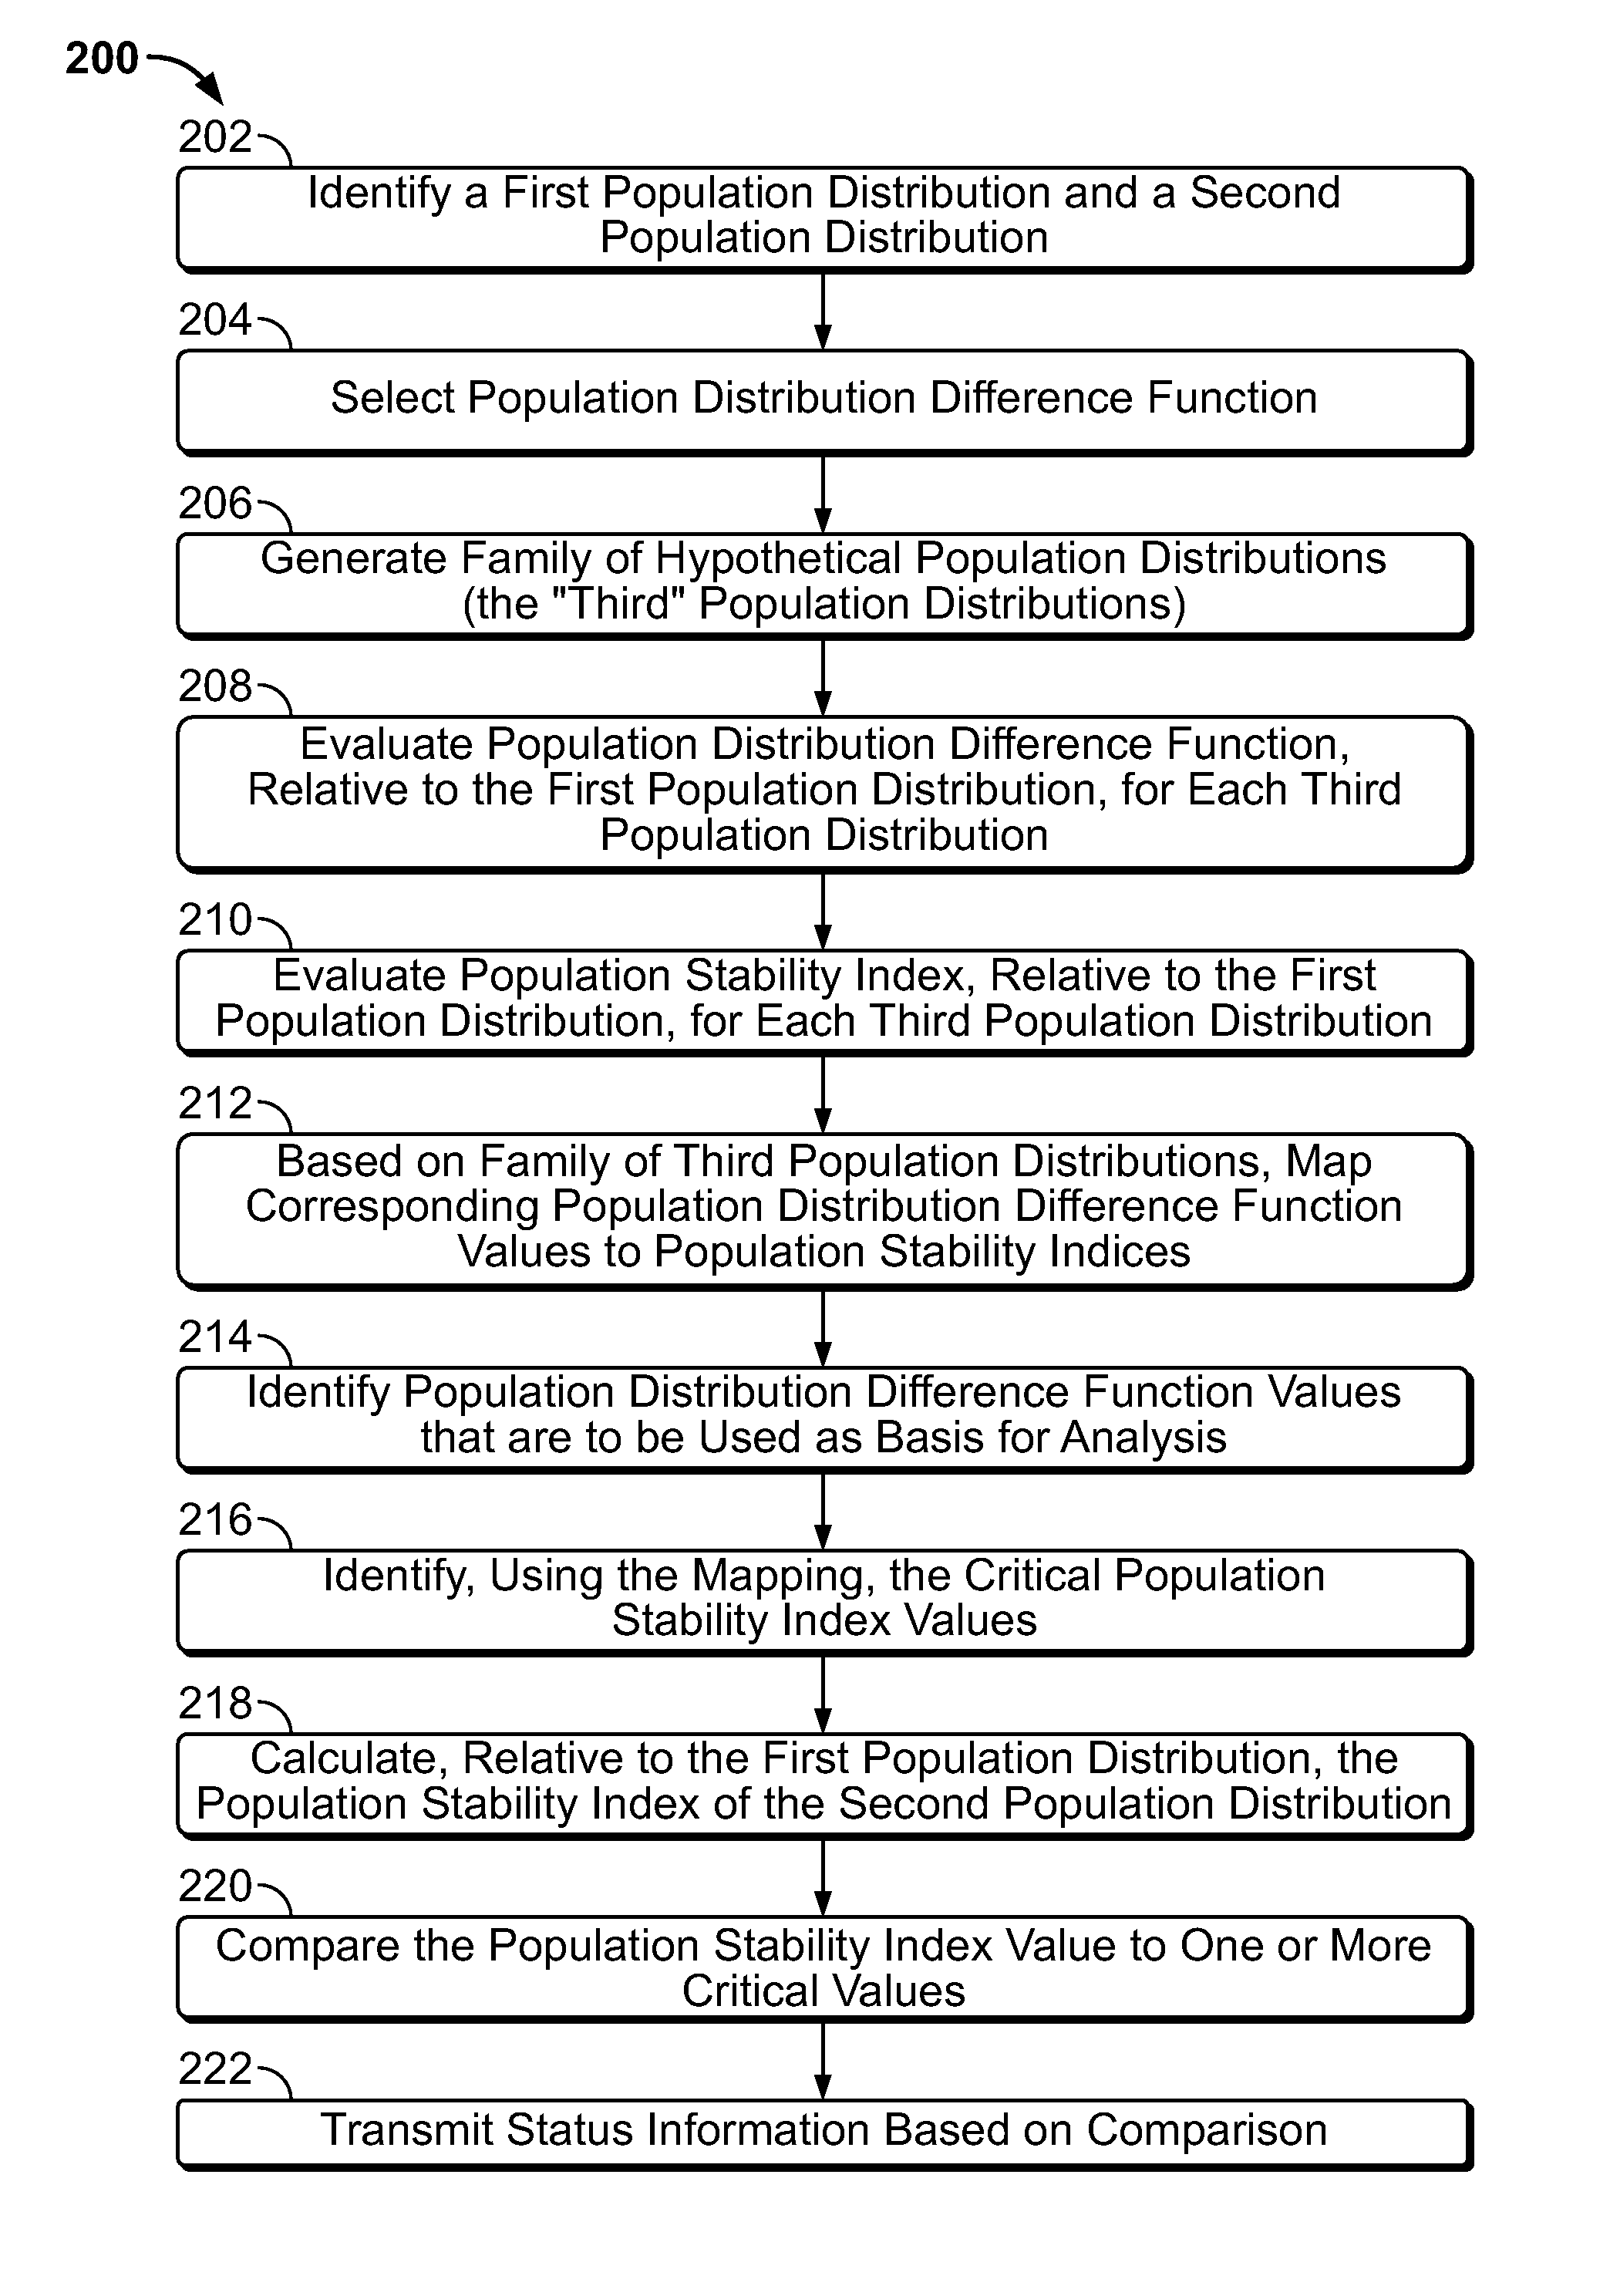
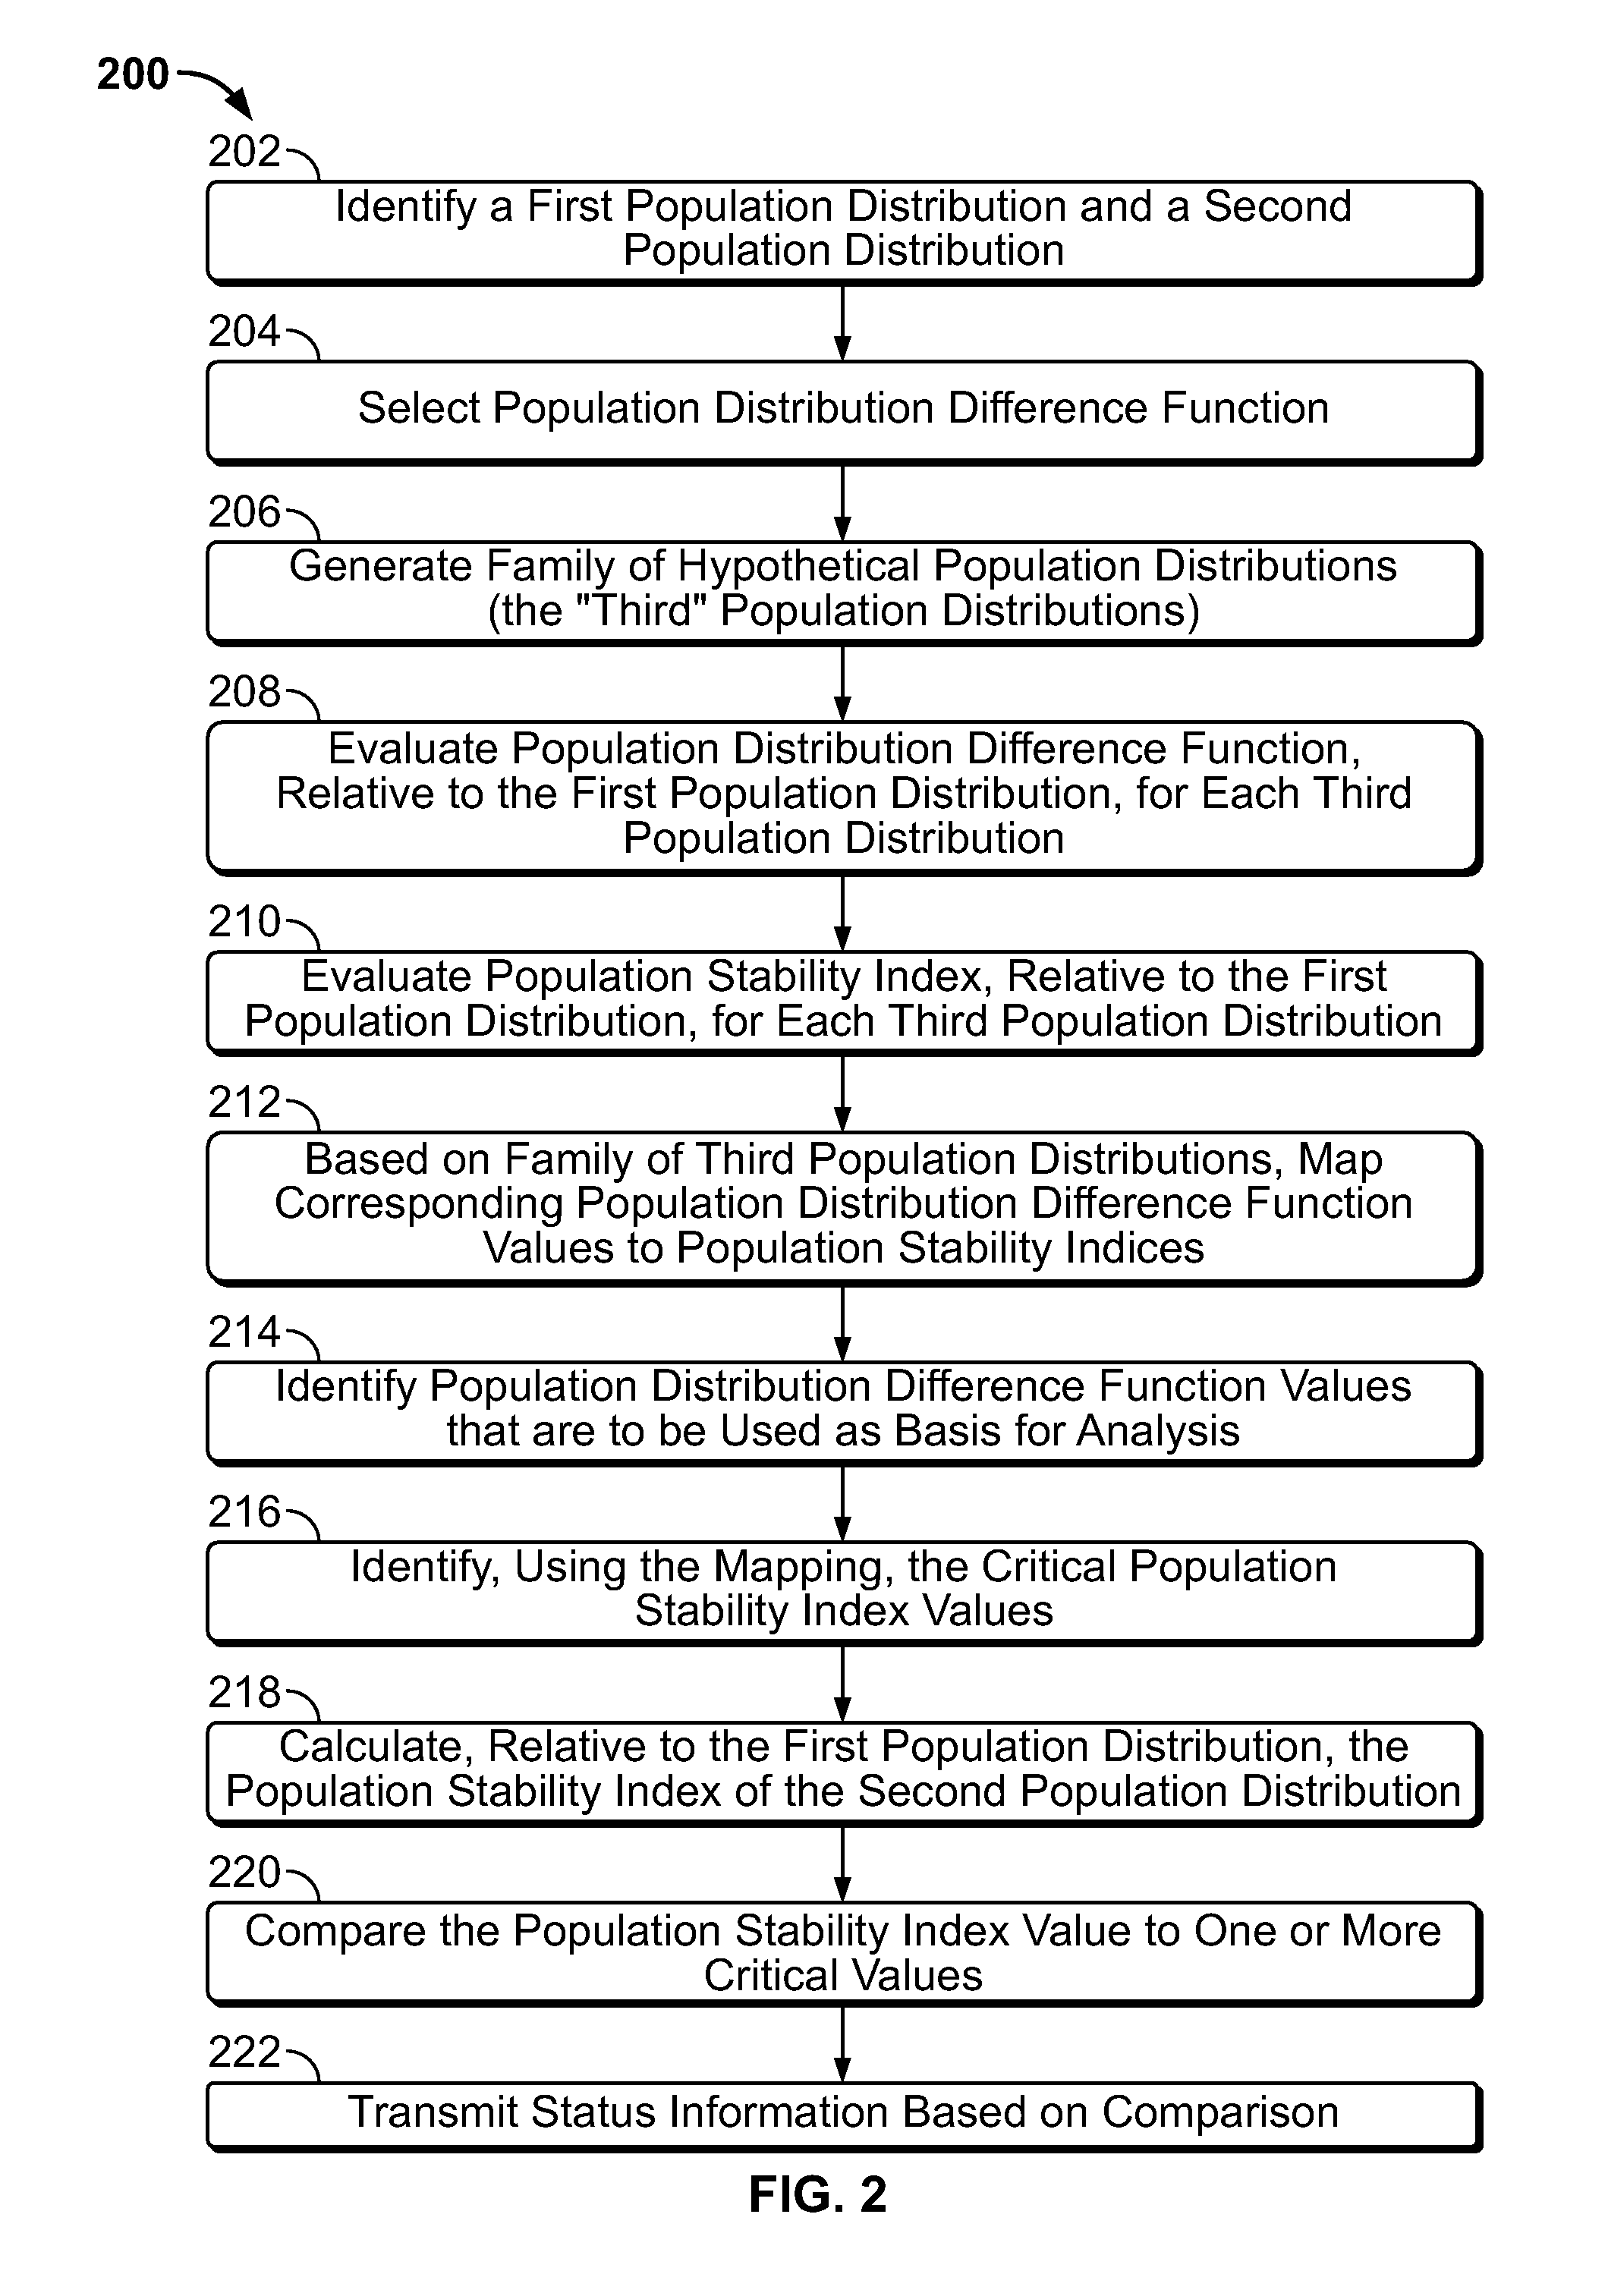
[0030]Apparatus and methods for quantifying a difference between a first population distribution data set and a second population distribution data set are provided. The apparatus and methods may involve a machine computational module that is configured to map a population stability index to a population distribution difference function. The machine computational module may be used to evaluate the population stability index based on the first population distribution data set and the second population distribution data set.

[0031]The population distribution difference function may be responsive to a difference between the first population distribution data set and the second population data set. By mapping the population stability index to the population distribution difference function, the population distribution difference function can be used to identify such a difference.

[0032]The population distribution difference function may be responsive to an intuitively relevant difference ...


PUM


Abstract

Apparatus and methods for quantifying a difference between a first population distribution data set and a second population distribution data set. The apparatus and methods may use randomly generated population distribution differences to generate a mapping of a population stability index to a population distribution difference function. The population distribution difference function may be more responsive to some differences between the first and second population distribution data sets than is the population stability index. The population distribution difference function thus may be used to identify differences between population distribution data sets. The differences may then be mapped to a corresponding population stability index. The population stability index may then be used to quantify a difference between the first and second data sets.

Description

FIELD OF TECHNOLOGY[0001]Aspects of the disclosure relate to providing apparatus and methods for identifying differences between frequency distributions. In particular, the disclosure relates to apparatus and methods for selecting a population stability index threshold for identifying differences between population distributions.BACKGROUND[0002]An entity may seek to monitor changes in an attribute associated with members of a population. The members may be individuals or things. The attribute may be quantified for each member of the population. For example, each member may be “scored” with respect to the attribute. The score may indicate the extent to which, or the likelihood that, the member possesses the attribute. The members' scores may change over time.[0003]One way to characterize the presence of the attribute at a selected time is to formulate a distribution showing how likely the attribute is to occur in portions of the population. The entity may desire to modify its own beh...

Claims


Application Information

Patent Timeline
Patent Type & Authority Patents(United States)
IPC IPC(8): G06F17/00
CPCG06Q10/06G06Q30/0201G06Q40/00
Inventor LIU, HEMEIPARISE, GERALD F.WARE, LEWIS R.
Owner BANK OF AMERICA CORP
Why Eureka
Try Eureka