
Graph viewer displaying predicted account balances and expenditures

a graph viewer and account balance technology, applied in the field of graph viewer displaying predicted account balances and expenditures, can solve the problem of little to attract customers

Active Publication Date: 2013-06-25
BANK OF AMERICA CORP
View PDF26 Cites 15 Cited by
  • Summary
  • Abstract
  • Description
  • Claims
  • Application Information

AI Technical Summary

Benefits of technology

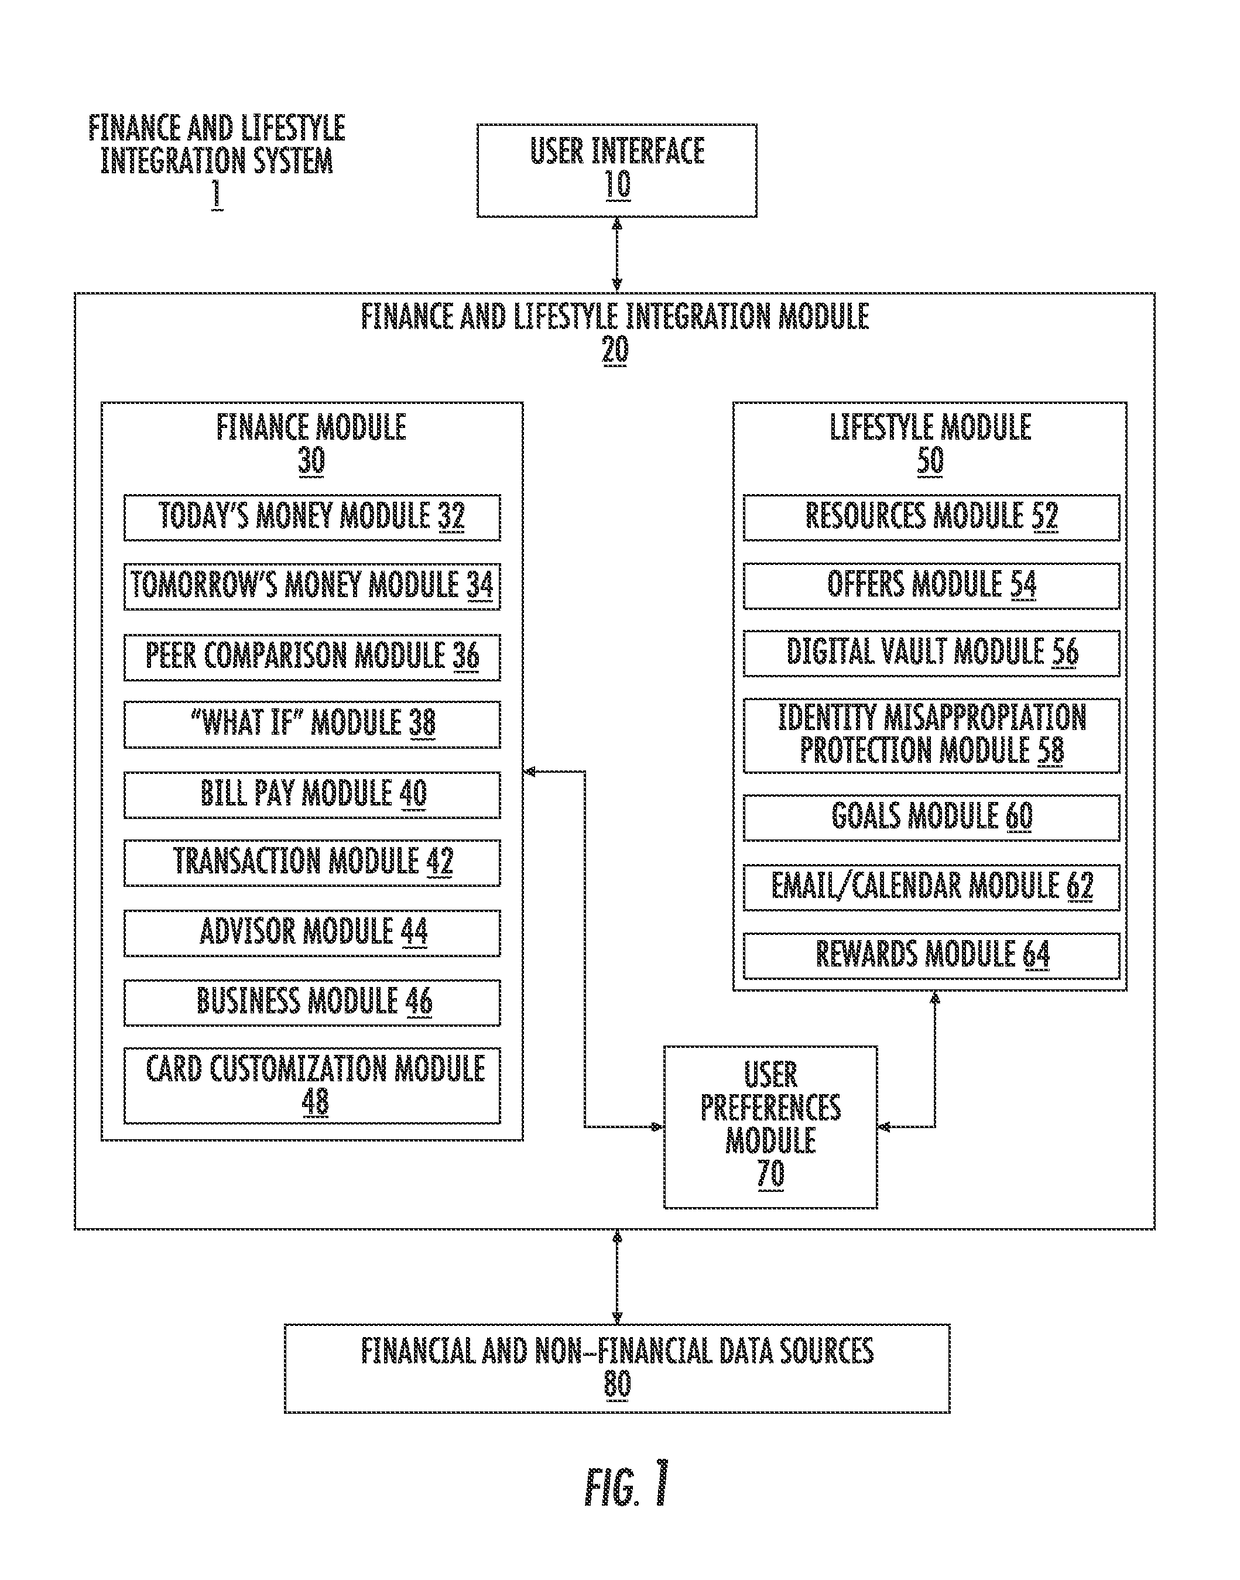
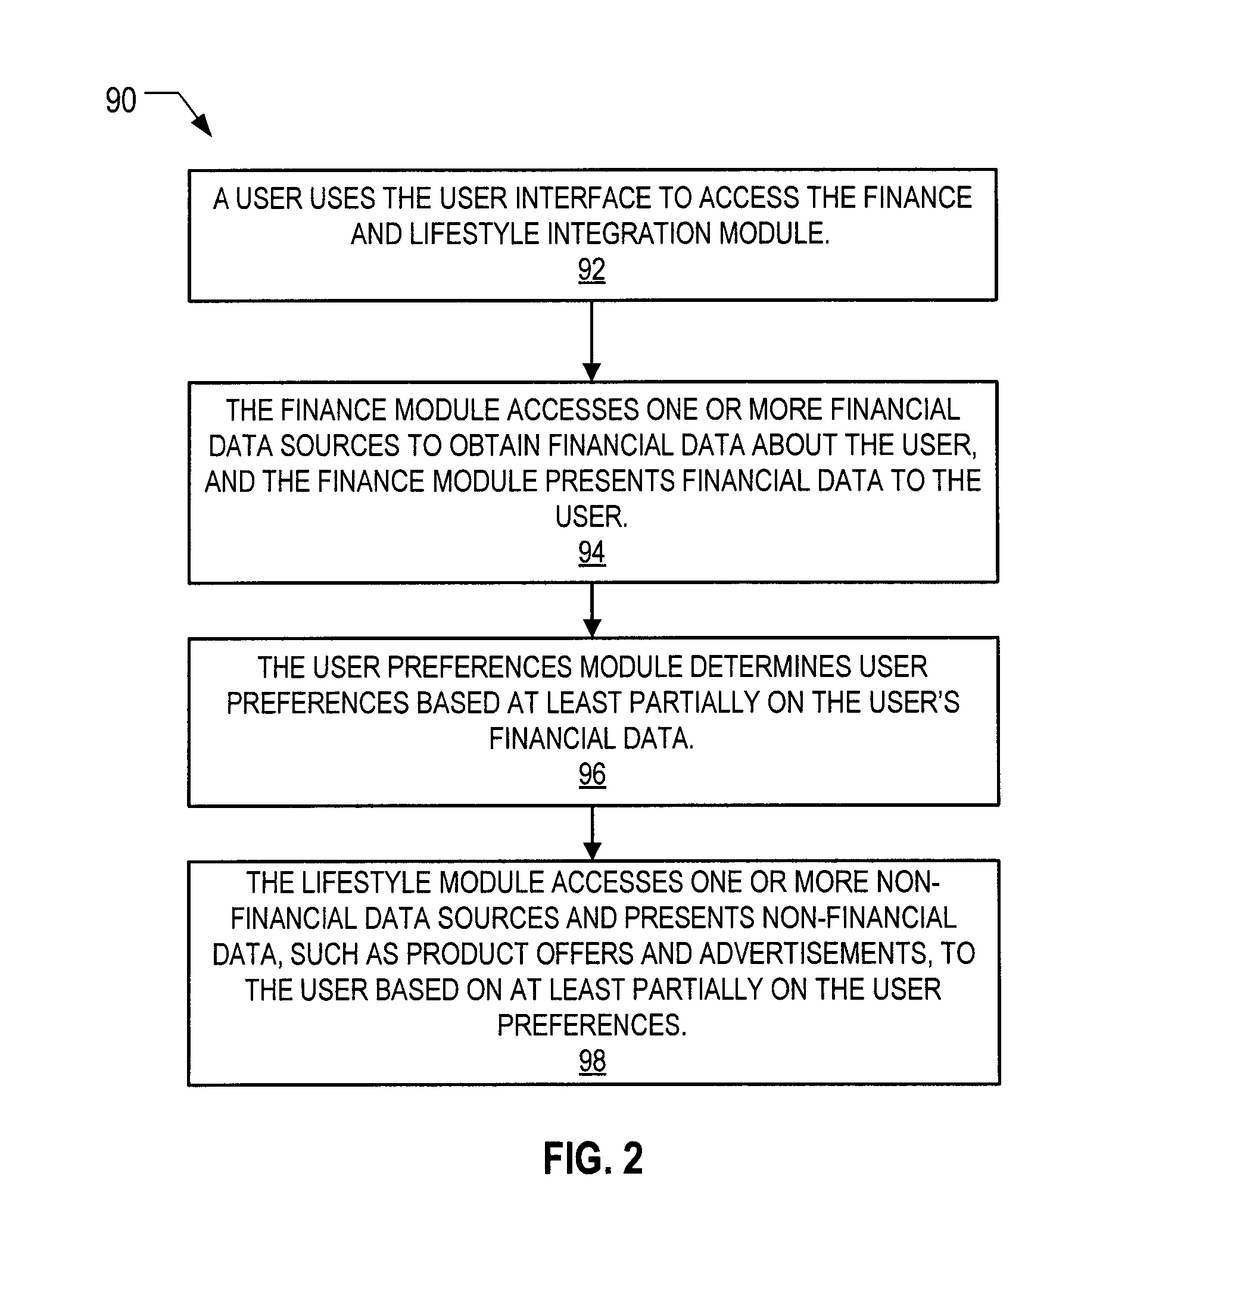
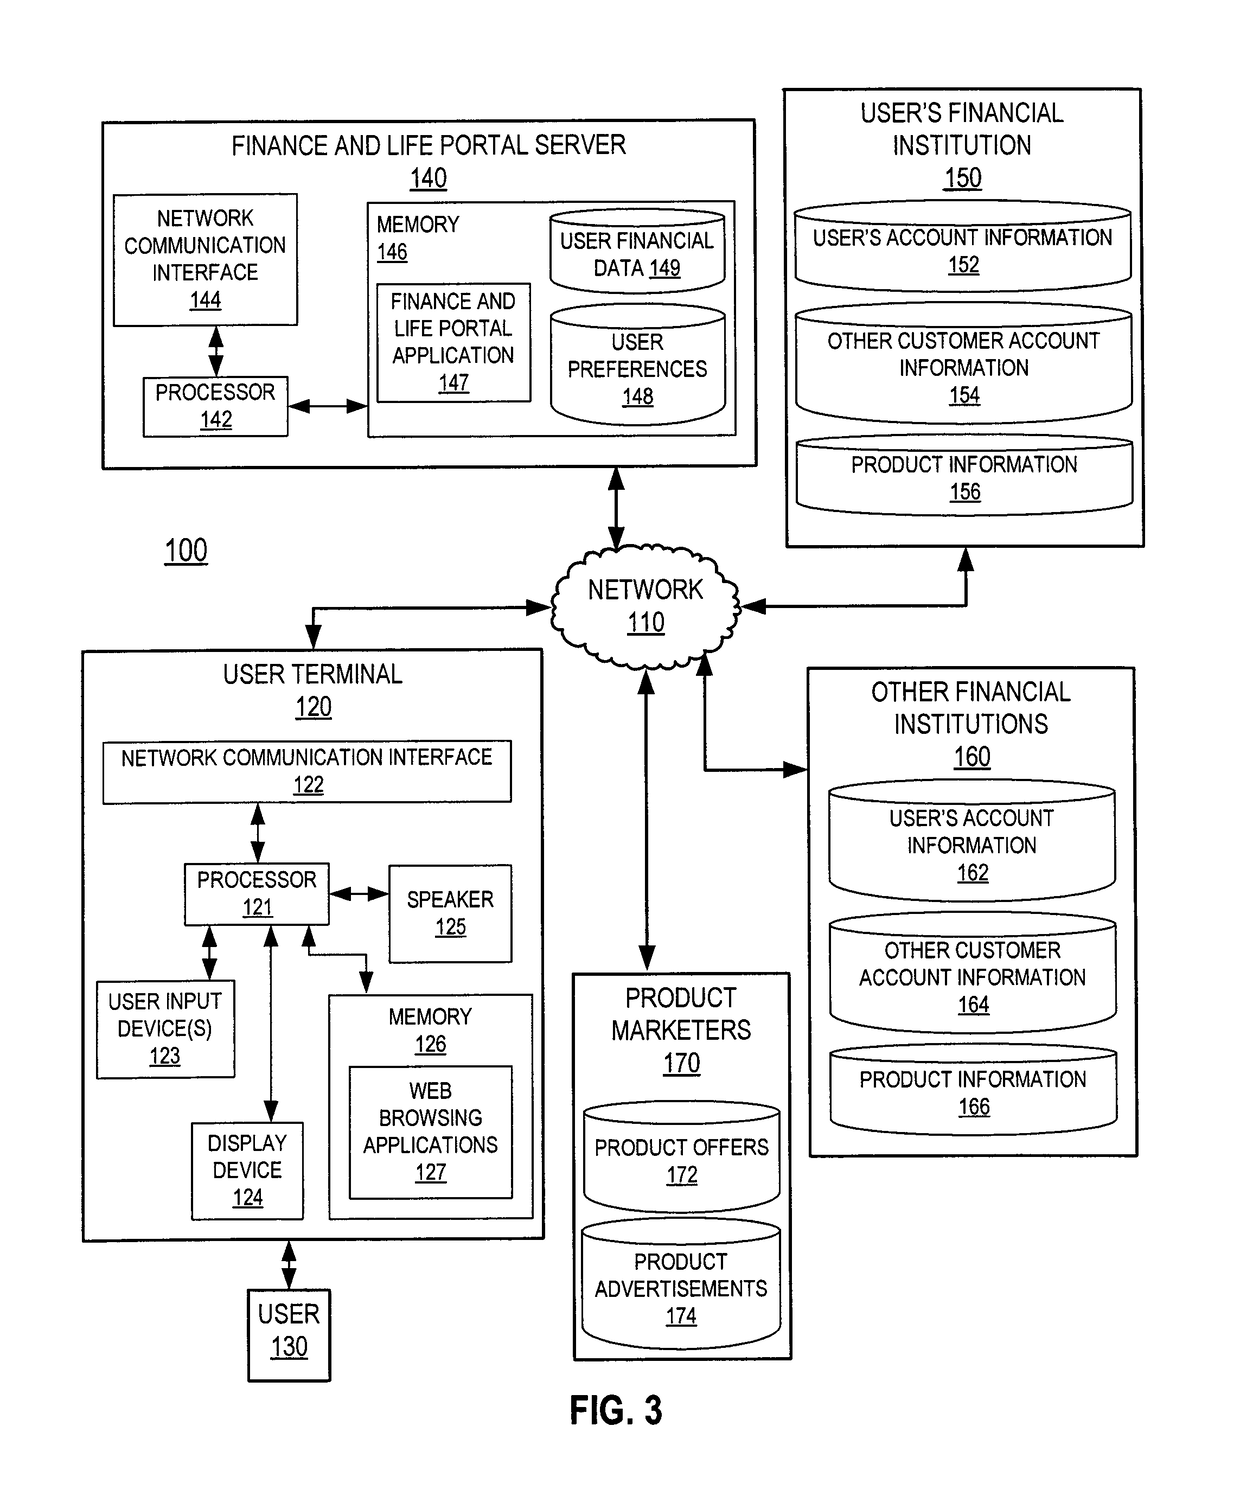
[0004]Embodiments of the present invention address a financial institution's needs for improved customer service by providing a personalized online portal that integrates a customer's financial interests with the customer's other lifestyle interests in an attempt to provide the customer with a “one-stop” shop for accessing the internet and a customized online experience tailored particularly to the customer. In this regard, embodiments of the online portal described herein provide, amongst other features, improved financial planning tools, an attractive and customizable user interface, personalized merchant offers and product advertisements based specifically on the customer's financial information, tools to help integrate a customer's finances with other aspects of the customer's life, and other user-friendly and novel financial and non-financial tools.
[0005]More particularly, embodiments of the present invention attract customers to the financial institution with a number of unique financial tools that help a customer analyze his or her finances and plan for the future. For example, one aspect of the invention provides a user interface that allows a user to view data in a line graph and portions of the graph in an intuitive, user-friendly, effective, and appealing manner. Specifically, in one embodiment, a graphical user interface is provided that displays a first graph of a first portion of some data, and a second graph of a second portion of the data, where the second portion of the data includes the first portion of the data. The graphical user interface further includes a first sliding bar and a second sliding bar displayed on the second graph and configured such that a user can move the first and second sliding bars relative to each other and relative to the second graph to increase or decrease the amount of the data displayed by the first graph. Such a user interface may be particularly useful to a user when reviewing stock price histories, financial account histories, and financial projections.
[0012]Embodiments of the invention further provide a method of displaying data. In one embodiment, the method involves providing a graphical user interface for display on a user terminal, wherein the graphical user interface comprises: (a) a first graph of a first portion of the data; (b) a second graph of a second portion of the data, the second portion of the data including the first portion of the data; and (c) a first sliding tool and a second sliding tool displayed on the second graph and configured such that a user can move the first and second sliding tools relative to each other and relative to the second graph to increase or decrease the amount of the data displayed by the first graph. The method further involves receiving an electronic communication from the user terminal indicating that a user moved the first and second sliding tools relative to each other and relative to the second graph. The method further involves using a processor to increase or decrease the amount of the data displayed by the first graph based on the user's movement of the first and second sliding tools relative to each other and relative to the second graph.
[0018]In one embodiment, the selection tool includes a first sliding bar and a second sliding bar displayed on the second graph and configured such that a user can move the first and second sliding bars relative to each other and relative to the second graph to increase or decrease the amount of the data displayed by the first graph.

Problems solved by technology

Although a customer may access the website of the customer's financial institution on a daily basis, these websites traditionally are quite mundane and uninviting, and do little to attract customers and distinguish one financial institution from another.

Method used


Image

  • Graph viewer displaying predicted account balances and expenditures
  • Graph viewer displaying predicted account balances and expenditures
  • Graph viewer displaying predicted account balances and expenditures

Examples


Embodiment Construction

[0077]Embodiments of the present invention now will be described more fully hereinafter with reference to the accompanying drawings, in which some, but not all, embodiments of the invention are shown. Indeed, the invention may be embodied in many different forms and should not be construed as limited to the embodiments set forth herein; rather, these embodiments are provided so that this disclosure will satisfy applicable legal requirements. Like numbers refer to like elements throughout.

[0078]Embodiments of the present invention address a financial institution's needs for improved customer service by providing a personalized online portal that integrates a customer's financial interests with the customer's other lifestyle interests in an attempt to provide the customer with a “one-stop” shop for accessing the internet and a customized online experience tailored particularly to the customer. In this regard, embodiments of the online portal described herein provide, amongst other fea...


PUM


Abstract

Embodiments of the invention provide apparatuses and methods for providing a graphical user interface on the display device, where the graphical user interface includes a graph viewing tool for charting data. The graph viewing tool includes: (a) a first display area displaying a first axis and a second axis of a graph, the first axis representing a first parameter of the data over a first range of values; (b) a second display area displaying a third axis representing the first parameter over a second range of values; and (c) a first tool and a second tool displayed in the second display area proximate the third axis, wherein the first tool and the second tool are configured such that they can be moved relative to each other and relative to the third axis to increase or decrease the first range of values displayed along the first axis in the first display area.

Description

CROSS REFERENCE TO RELATED APPLICATIONS[0001]This application claims benefit of priority under 35 U.S.C. §119(e) to the filing date of U.S. Provisional Application No. 61 / 196,452, as filed on Oct. 16, 2008, which is incorporated herein by reference in its entirety.BACKGROUND[0002]Financial institutions, such as banks, are constantly looking for ways to better serve their customers. In this regard, financial institutions strive to provide a customer with easy access to the customer's financial information, tools to allow the customer to analyze and manage the customer's finances effectively, and an enjoyable and intuitive experience when the customer is accessing and managing the customer's finances. The experiences that the customer encounters when interfacing with the financial institution shape the customer's perceptions and attitudes toward the financial institution which, in turn, may influence the customer's tendency to do business with the financial institution or increase the...

Claims


Application Information

Patent Timeline
Patent Type & Authority Patents(United States)
IPC IPC(8): G06F3/048G07F7/10G07F19/00G06Q40/00
CPCG06F3/04847G06Q40/04G06F16/904G09G5/00
Inventor BUCHANAN, JAMES BROOKSCORVO, ROSIE SUSANPHILLIPS, GREGORY S.PRATT, MARK COLINRICHARDSON, JULIA CLAIREDAUN, SUSAN CLAIREWOOD, PAUL ROBERTJAMESON, CRISPIN ALEXANDER CONRADBRENNAN, TIMOTHY ADAM
Owner BANK OF AMERICA CORP
Learn More