Ranking graphical visualizations of a data set according to data attributes

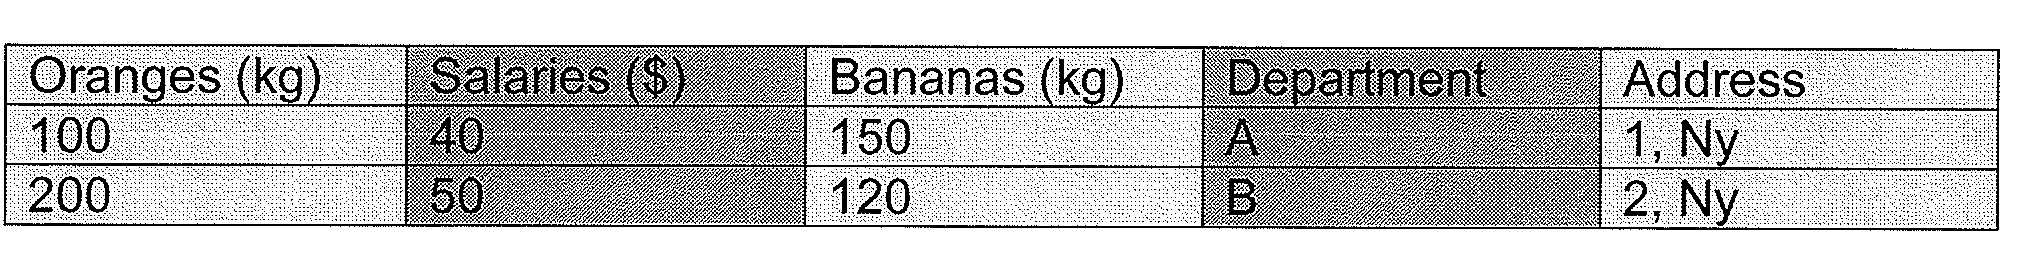
a data set and data attribute technology, applied in the field of data set graphical visualizations, can solve the problems of insufficient information to generate a graphical visualization to adequately, data in its current format cannot be used directly to visualize the data set, and the number of weight measurements (kg) is not easily compared

Active Publication Date: 2014-08-19
GOOGLE LLC
View PDF22 Cites 93 Cited by
  • Summary
  • Abstract
  • Description
  • Claims
  • Application Information

AI Technical Summary

Problems solved by technology

While correctly identified, the category selected may not provide enough information to generate a graphical visualization to adequately represent the data, and a graphical visualization such as a pie chart may be inadvertently selected.
However, given the expected data set for a

Method used


Image

  • Ranking graphical visualizations of a data set according to data attributes
  • Ranking graphical visualizations of a data set according to data attributes
  • Ranking graphical visualizations of a data set according to data attributes

Examples


Embodiment Construction

[0035]In view of the foregoing, the present disclosure, through one or more of its various aspects, embodiments and / or specific features or sub-components, is thus intended to bring out one or more of the advantages as specifically noted below.

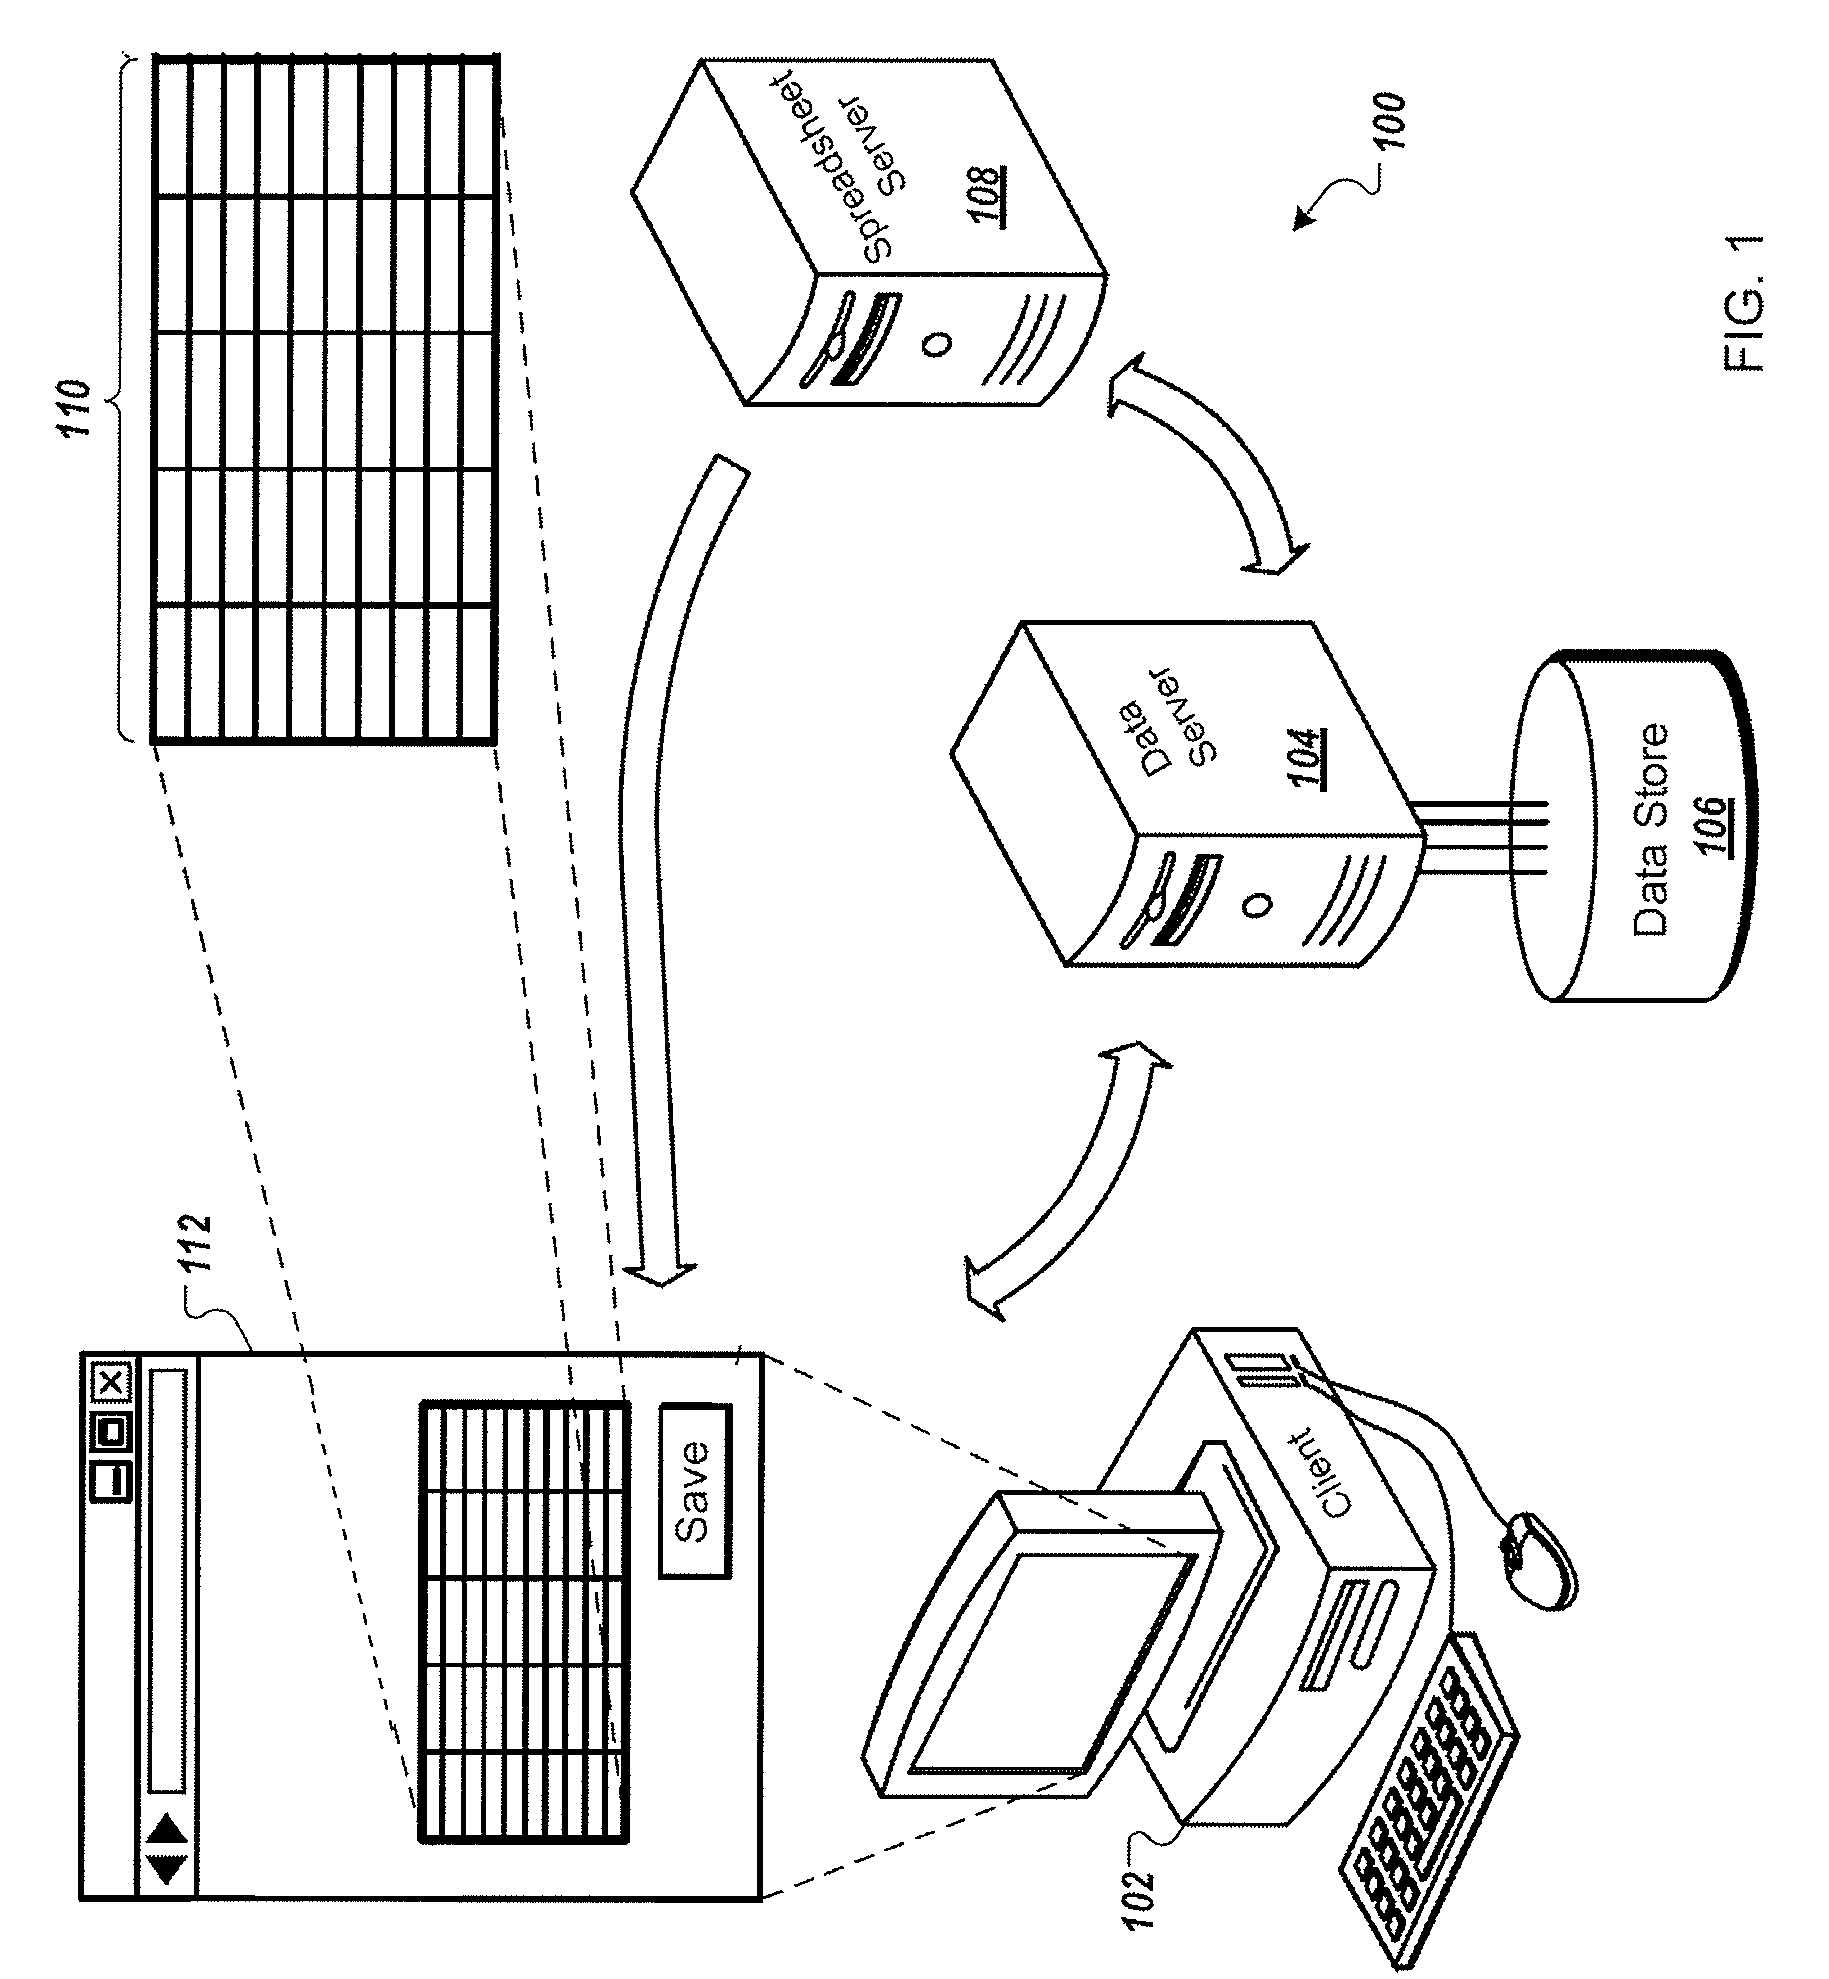
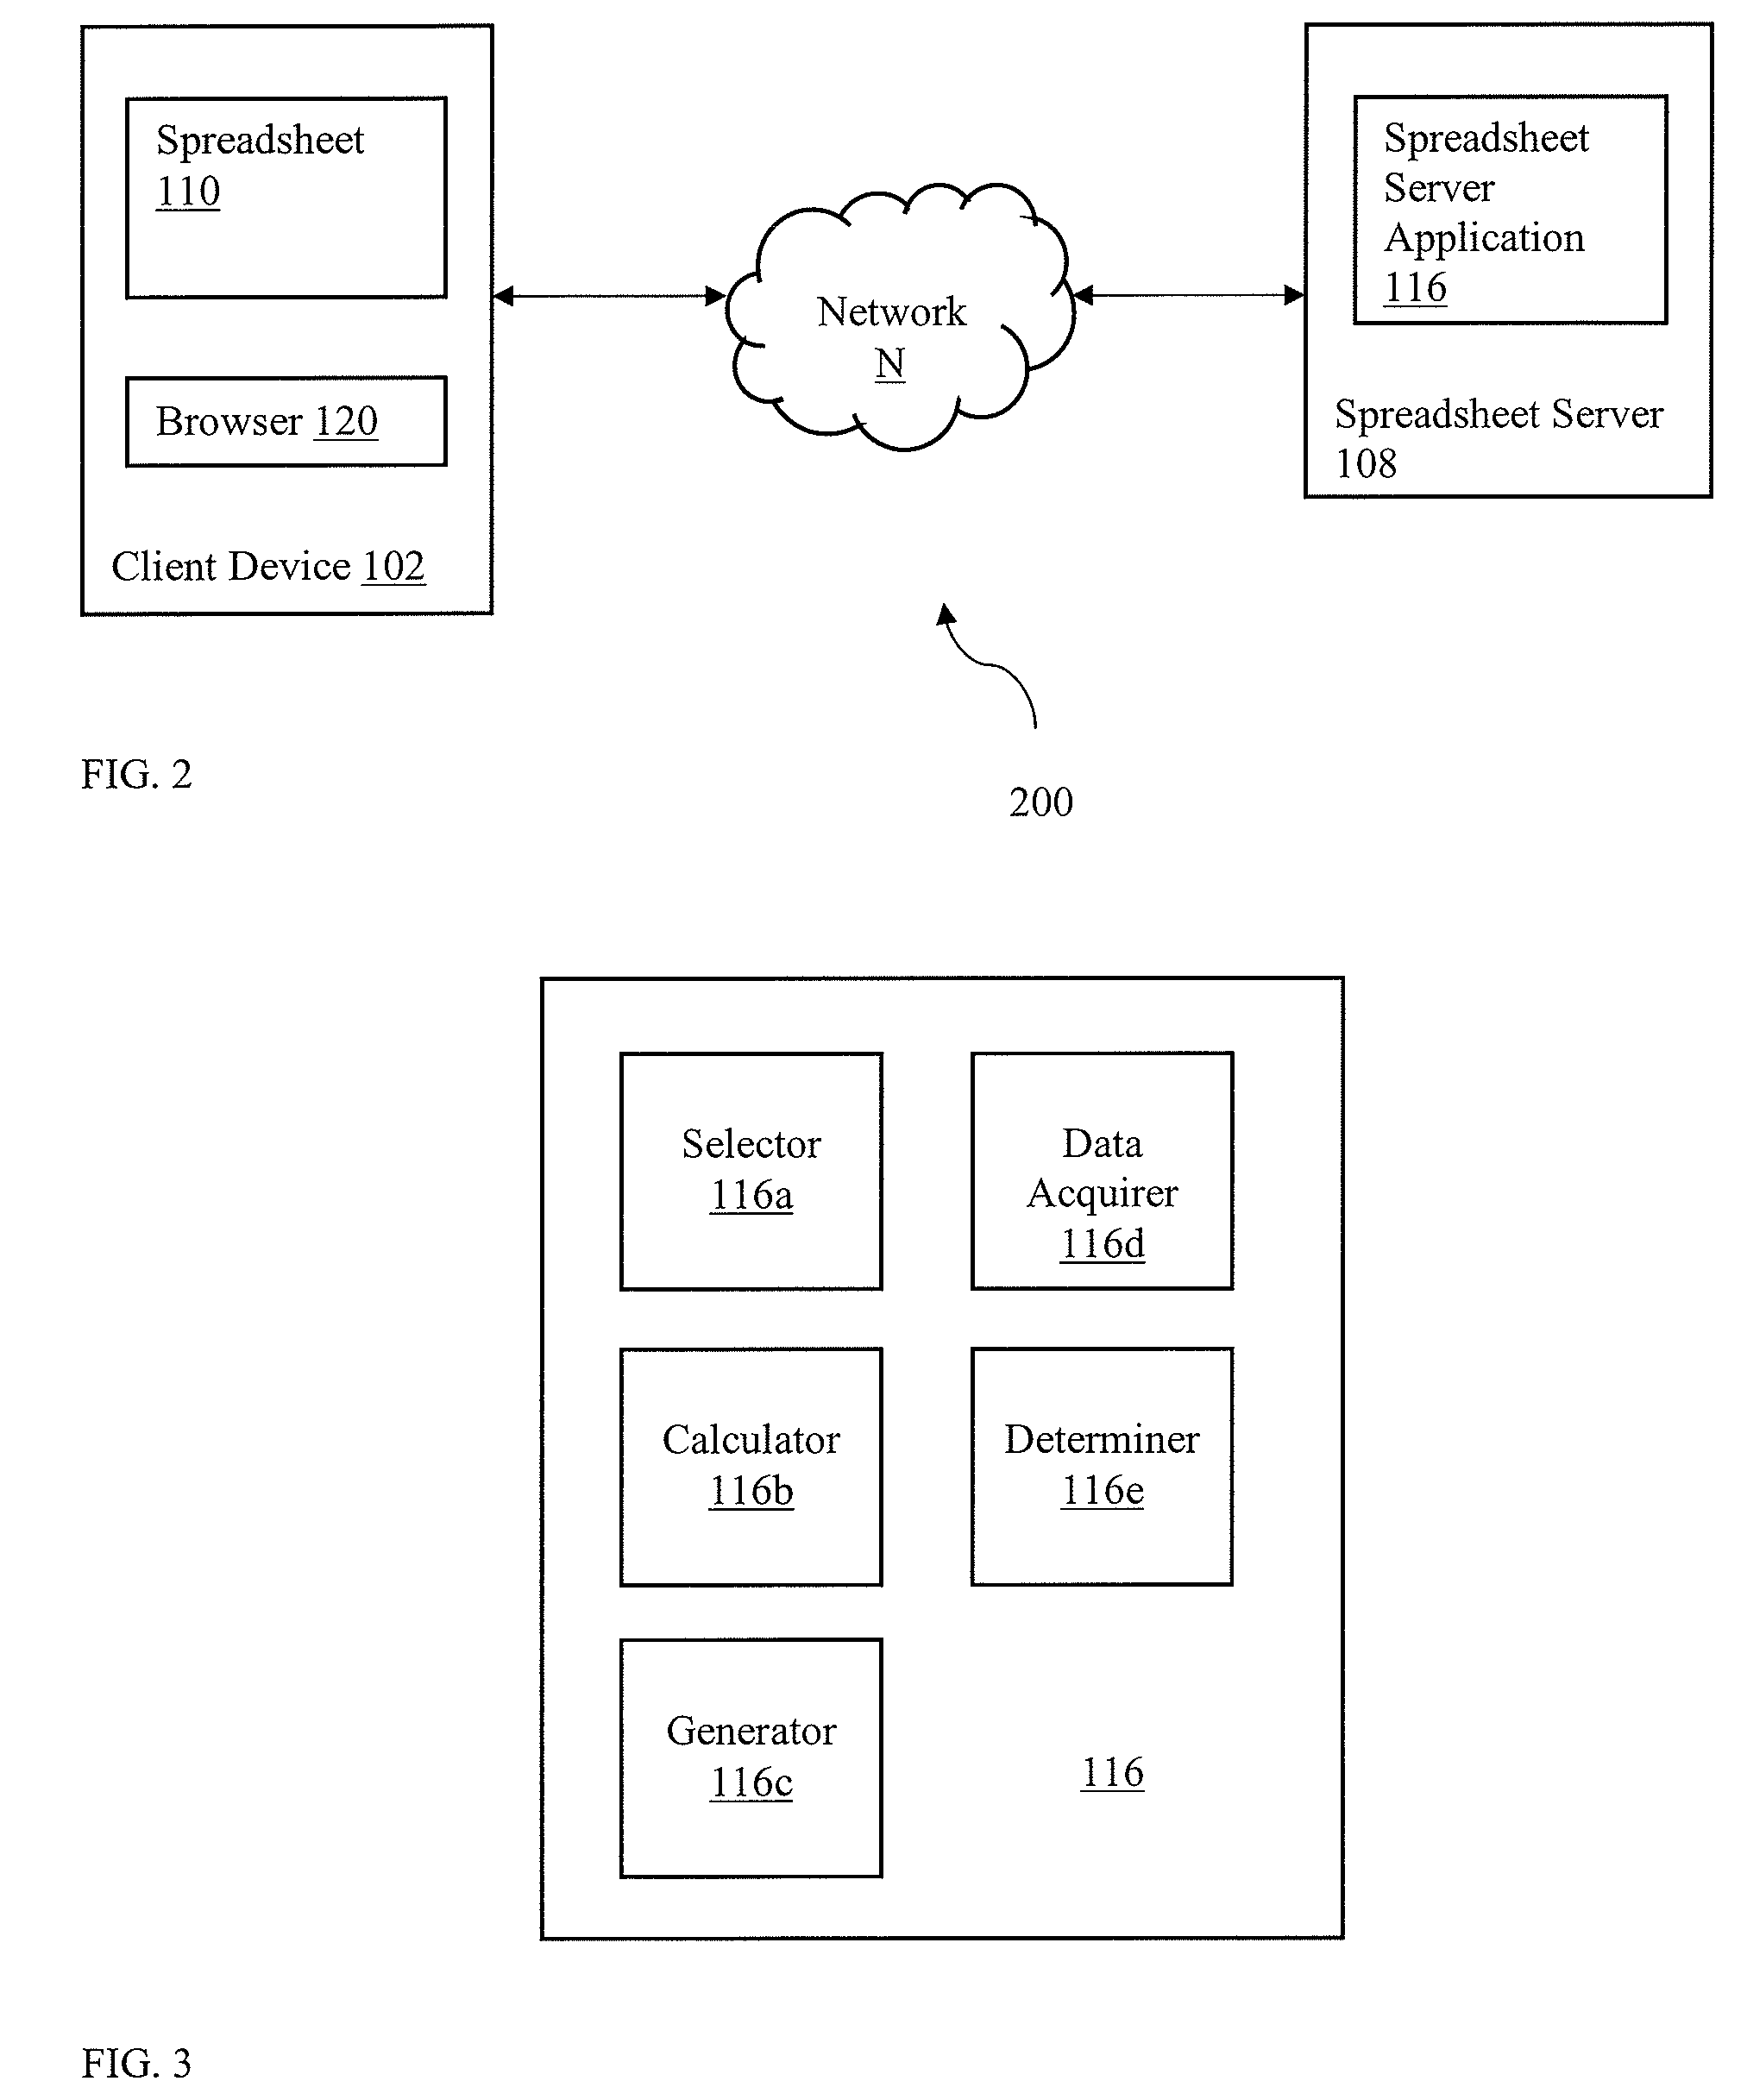
[0036]The present disclosure relates to the field of graphical visualizations for a data set, and in particular, to generating graphical visualizations from a data set in a web-based document, for example an electronic spreadsheet, accessible in an interne or cloud-based system. Programs such as spreadsheets enable a user to create graphical visualizations or representations from data or data sets in the spreadsheet. As appreciated, spreadsheets are typically made up of a grid of cells having rows and columns (e.g. data table), and allow users to track and manipulate large amounts of organized and structured information and data. Formulas, as well as other relationships among the cells making up the spreadsheet, can be created to compute vario...


PUM


Abstract

A computer-implemented system, method and computer readable medium to generate graphical visualizations corresponding to a data set populated in a web-based document, such as a spreadsheet. The spreadsheet is accessible in an interne or cloud-based system, and enables users to automatically create graphical visualizations or representations based on recommendations by a spreadsheet application. The graphical visualizations may be automatically ranked such that the system provides the recommendations to the user for display. Automatic ranking is accomplished, for example, by determining data types from identifying column type, differentiating column types, and extracting data sets having attributes corresponding to various graphical visualizations.

Description

TECHNICAL FIELD[0001]The present disclosure relates to the field of graphical visualizations for a data set, and in particular, to generating graphical visualizations from a data set in a web-based document, such as a spreadsheet.BACKGROUND[0002]In internet-based or cloud-based computing, documents and applications may be managed or executed using web browsers. In such an environment, information for the documents or applications to be managed or executed is typically obtained from a remote server system or service. Such documents and applications may include, for example, search engines, map services and spreadsheet programs which operate by loading executable HTML and JavaScript code from the server system to a browser running on a client device remote from the server system. The interne or cloud-based computing environment also allows clients the ability to access documents from different computers and locations.[0003]As mentioned, one particular type of document is an electronic...

Claims


Application Information

Patent Timeline
IPC IPC(8): G06F17/24G06F17/30
CPCG06F17/246G06F40/18
Inventor MAOZ, HILLELLIBICKI, DANIELFINK, MICHAELHO, RONALDLEE, DENNIS JULIANMATIAS, YOSSIWEINSTEIN, AMITDAVID, YOAH BARRAZ, ITAI
Owner GOOGLE LLC
Why Eureka
Try Eureka