System and method for flow visualization and interaction with network traffic

a flow visualization and network traffic technology, applied in the field of system and method for flow visualization and interaction with network traffic, can solve the problems of large number of traffic paths that users may follow, cumbersome processing of traffic information regarding even a basic internet transaction, and hundreds or thousands of web pages of a single websi

Active Publication Date: 2015-04-28
GOOGLE LLC
View PDF54 Cites 70 Cited by
  • Summary
  • Abstract
  • Description
  • Claims
  • Application Information

AI Technical Summary

Benefits of technology

[0003]In general, one aspect of the subject matter described in this specification can be embodied in a method for displaying Internet or network traffic data. The method includes systems and methods for generating visualization data representing network traffic flow in or out of one or more nodes, each node representing the network traffic for one or more web pages. The method includes visualizing data configured to connect the one or more nodes with one or more connectors, each connector configured to connect two nodes, the one or more connectors configured to have a dimension that indicates a number of visits between two nodes. Highlighting a portion of the network traffic when a user selects the one or more nodes or connectors.
[0004]In one implementation a system includes a processor configured to generate visualization data representing network traffic flow using one or more nodes, each node representing the internet traffic for one or more web pages. The processor configured to connect the one or more nodes with one or more connectors, each connector configured to connect at least two nodes, the one or more connectors configured to have a dimension that indicates a number of visits between two nodes. The processor configured to provide visualization data such that upon receiving user input a portion of the network traffic is highlighted when a user selects the one or more nodes or connectors.
[0005]A further implementation is one or more computer-readable media having instructions stored therein. The instructions are executable by one or more processors to cause the one or more processors to perform operations. The operations include generating visualization data representing network traffic flow in or out of one or more nodes, each node representing the network traffic for one or more web pages. The method includes visualizing data configured to connect the one or more nodes with one or more connectors, each connector configured to connect two nodes, the one or more connectors configured to have a dimension that indicates a number of visits between two nodes. A portion of the network traffic capable of being highlighted.
[0006]These implementations are mentioned not to limit the scope of the disclosure, but to provide examples to aid in the understanding thereof. Particular implementations can be developed to realize one or more of the following advantages.

Problems solved by technology

However, due to growing complexity, a single website can have hundreds or thousands of web pages.
The amount of traffic information available regarding even a basic Internet transaction can be cumbersome to process for the interested parties.
Therefore, the number of traffic paths that users may follow may also be large.
For these and other reasons, generating visualizations of the flow of Internet or network traffic is challenging and difficult.

Method used


Image

  • System and method for flow visualization and interaction with network traffic
  • System and method for flow visualization and interaction with network traffic
  • System and method for flow visualization and interaction with network traffic

Examples


Embodiment Construction

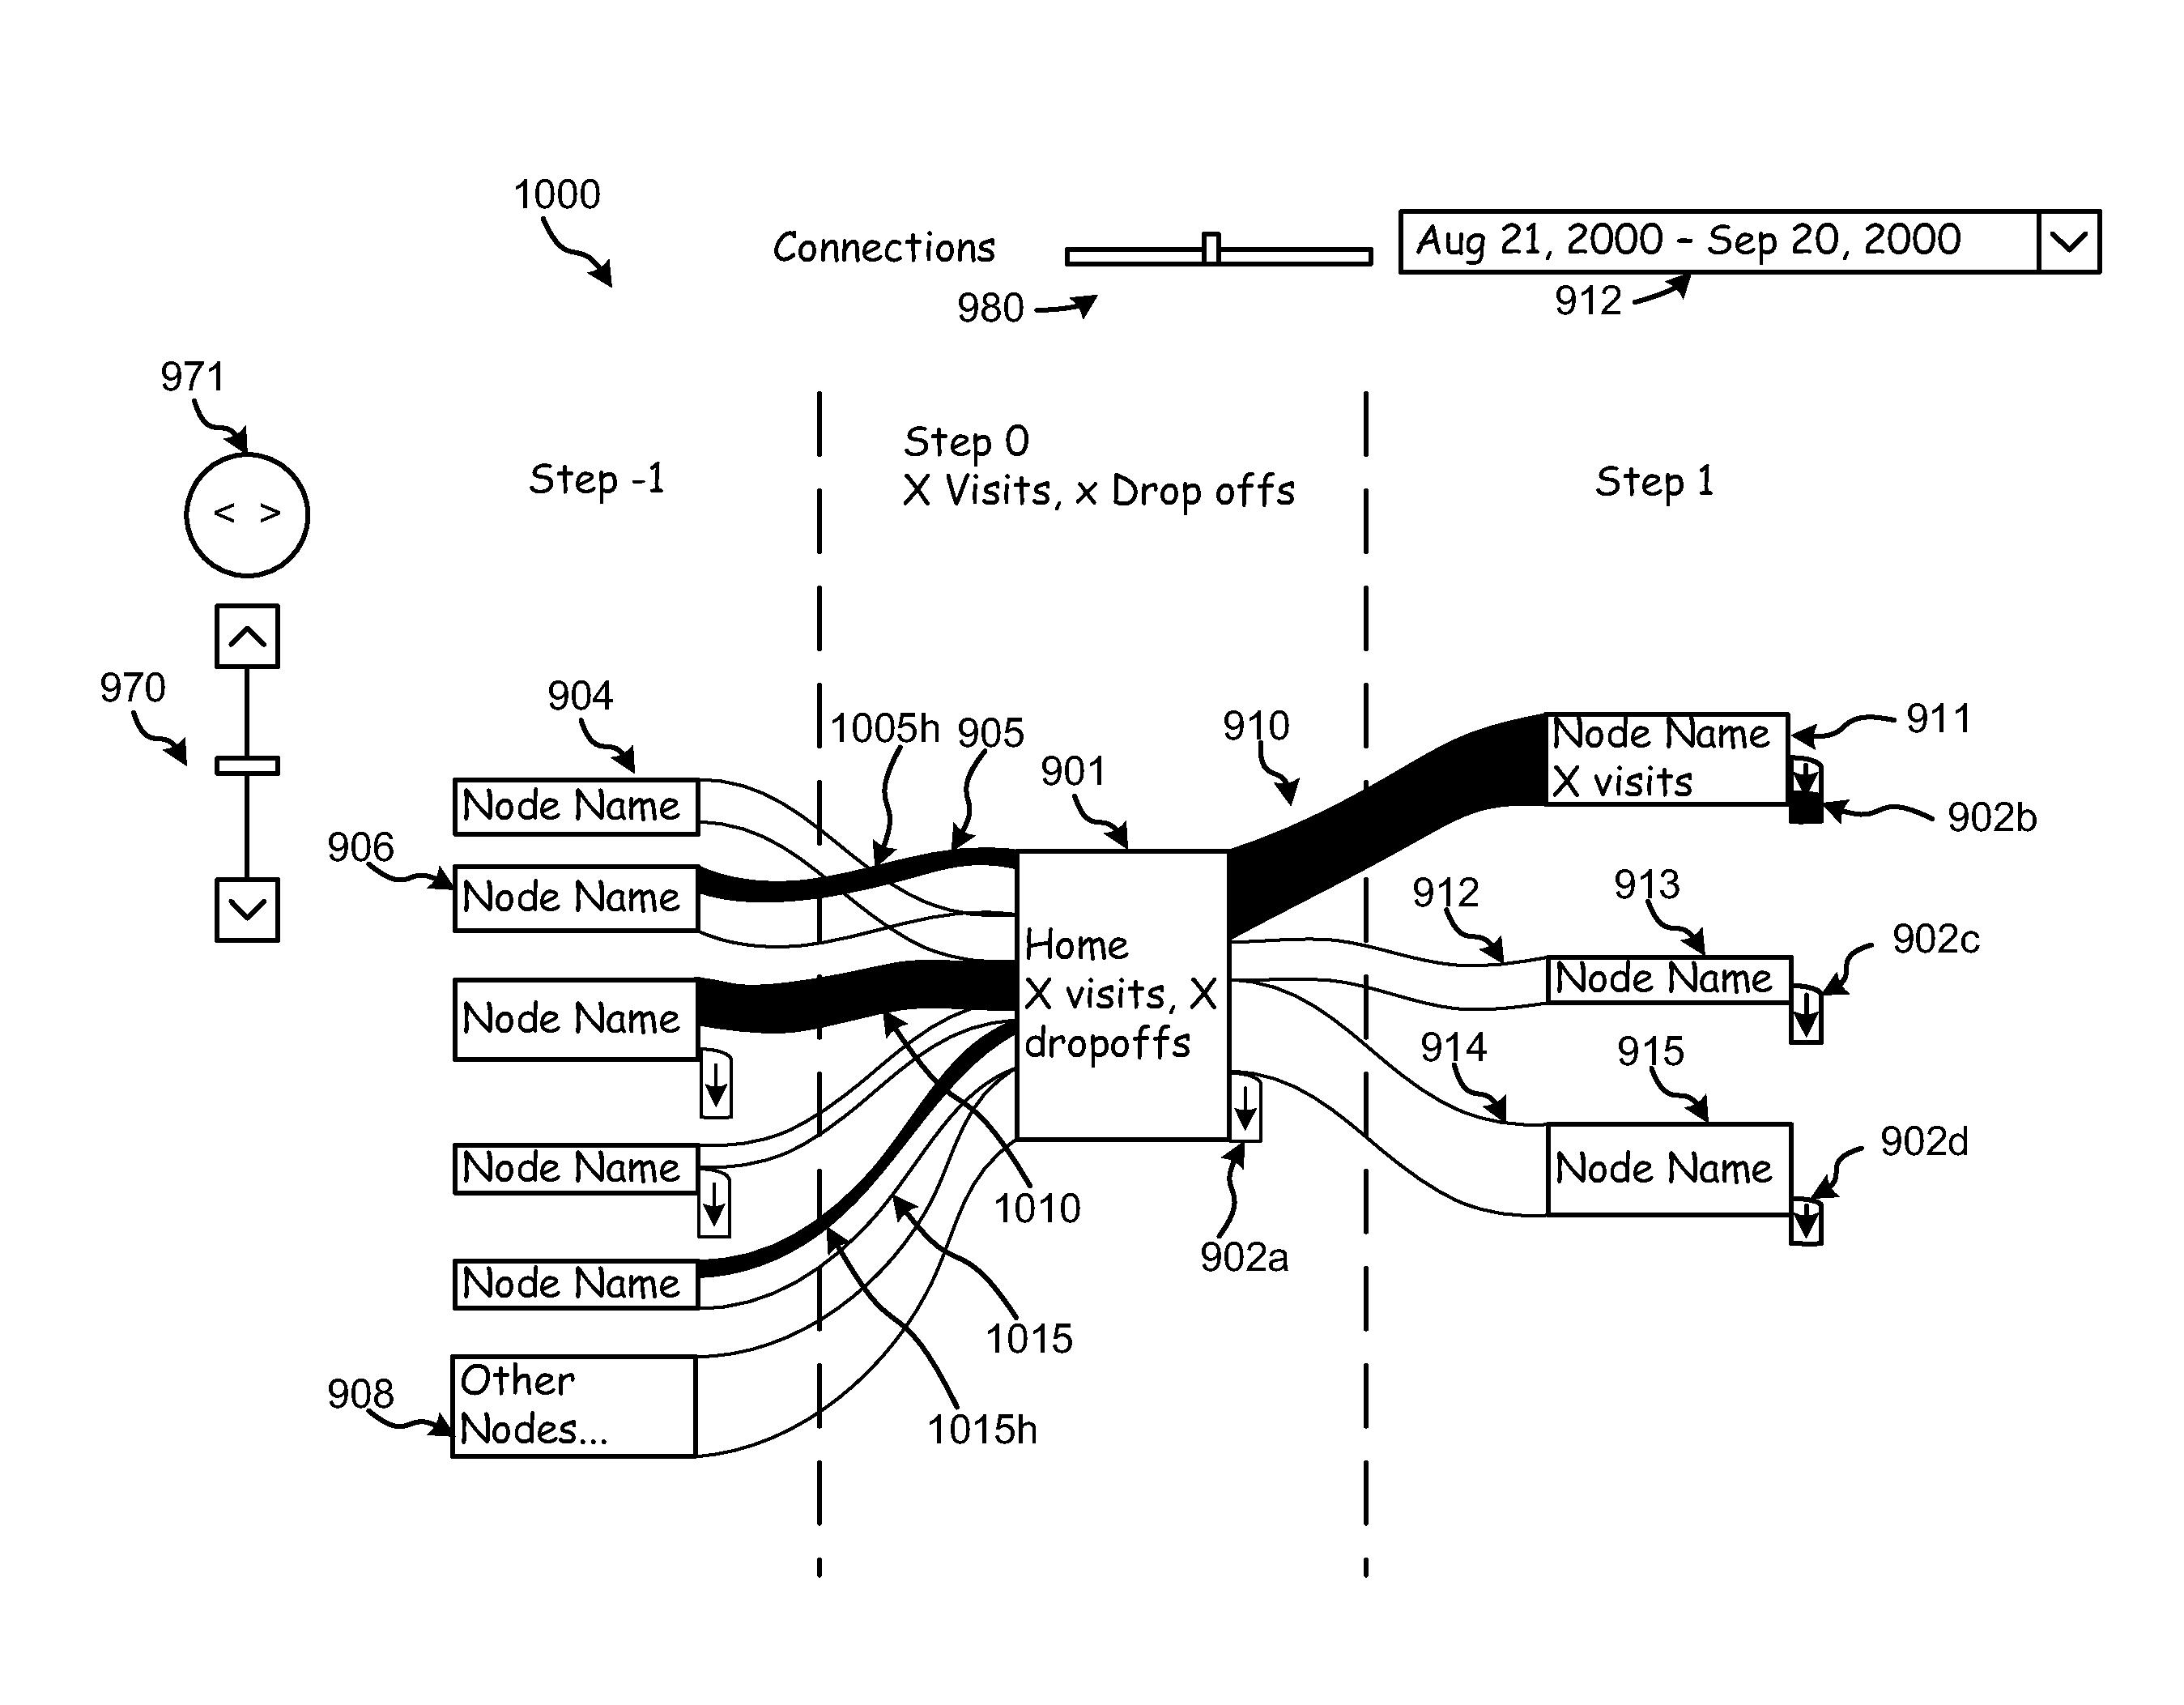
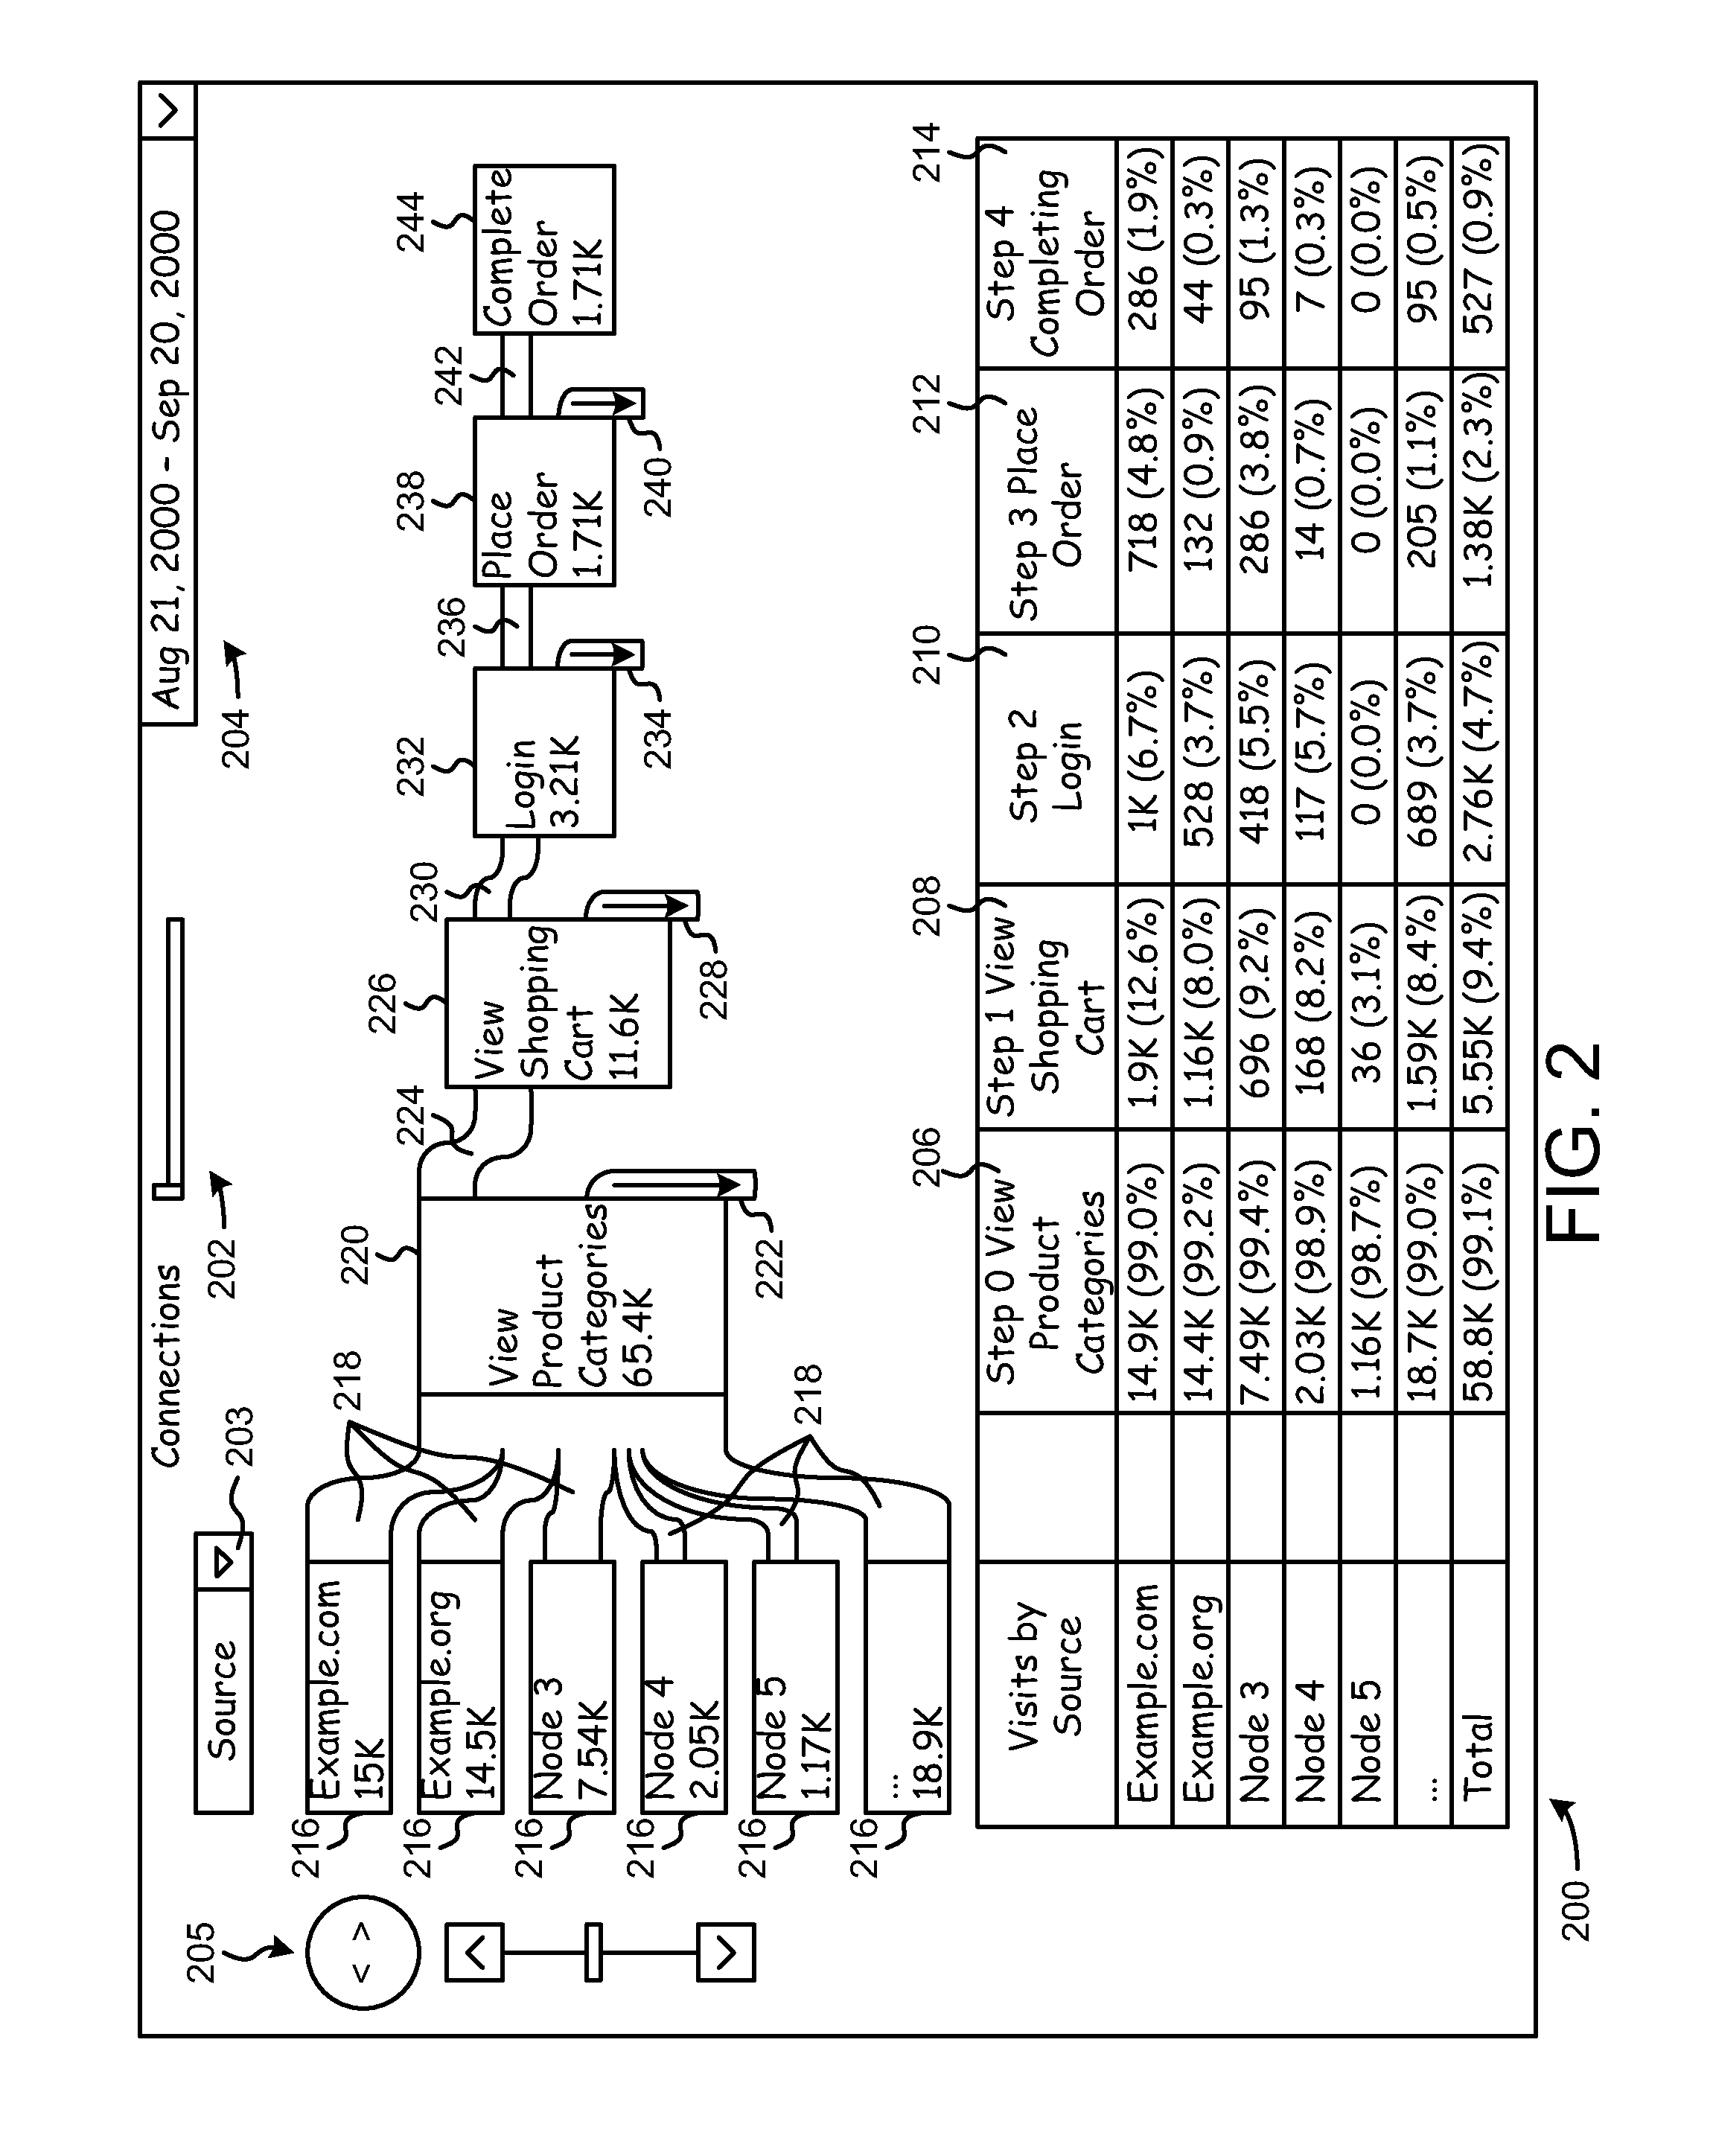
[0024]Network traffic provides a graphical representation of Internet or network traffic going into and out of a user chosen node. Each node represents one or more web pages that have been grouped together. A connector may be used to connect two nodes. The relative size of each connector that connects two nodes represents the relative amount of the traffic that traveled from one node to the other node or one web page to another. The connectors may represent the amount or volume of Internet or network traffic. User interactions clicking or hovering over a node or an edge and segmenting the traffic are clearly defined to surface the exit pages, conversion rates, and other relevant data in an interactive way.

[0025]Network traffic allows the website owner to choose the starting or ending node and visualize the traffic going into or out of the chosen node. Moreover, the website owner may add certain web pages to the node manually. A website owner may specify whether they wanted to add we...


PUM


Abstract

Systems and methods for generating visualization data representing network traffic flow in or out of one or more nodes, each node representing the network traffic for one or more web pages. The method includes visualizing data configured to connect the one or more nodes with one or more connectors, each connector configured to connect two nodes, the one or more connectors configured to have a dimension that indicates a number of visits between two nodes. The network traffic capable of being highlighted when a user selects the one or more nodes or connectors.

Description

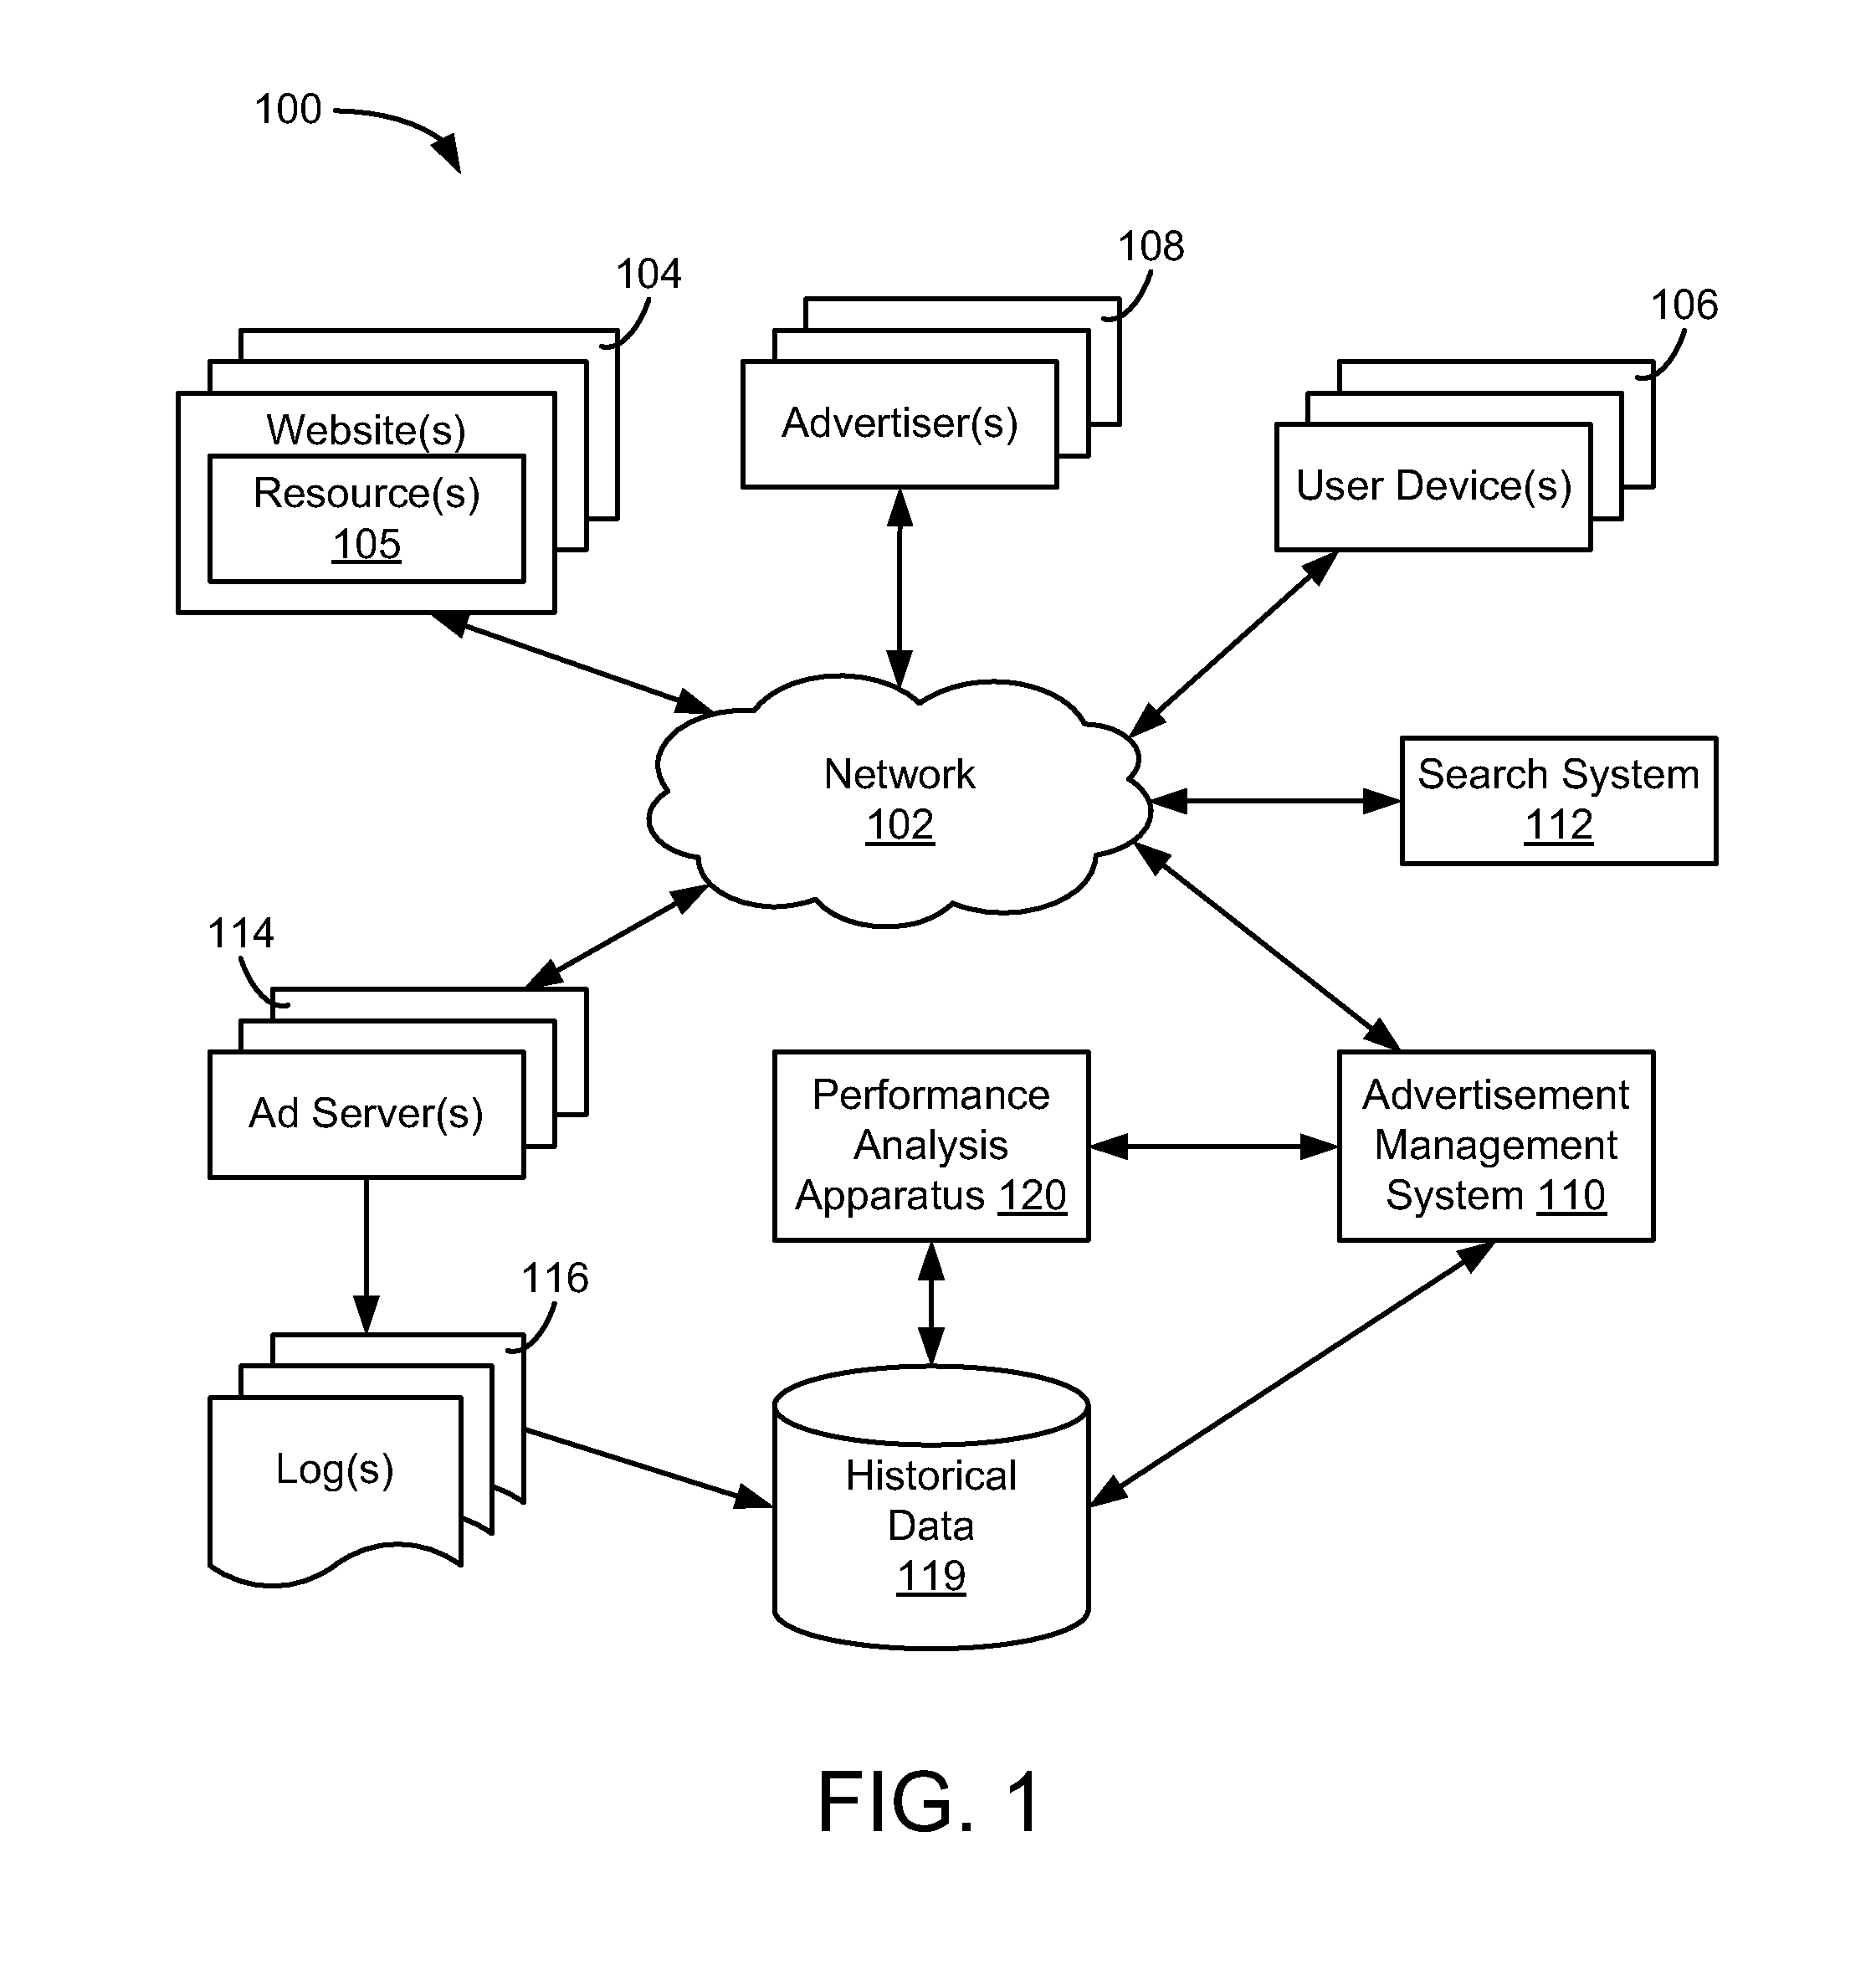
BACKGROUND[0001]The Internet provides access to a wide variety of content. For instance, images, audio, video, and web pages for many different topics are accessible through the Internet. Website owners that provide access to content want to gain insight regarding the performance of various web pages. However, due to growing complexity, a single website can have hundreds or thousands of web pages.[0002]The amount of traffic information available regarding even a basic Internet transaction can be cumbersome to process for the interested parties. Users may visit numerous, different uniform resource locators (URLs), to complete substantially the same types of transactions. For example, the website owners may wish to know more about the number of users that actually add a product to an online shopping cart. However, a unique URL may be generated each time a user adds a product to a shopping cart. In addition, various parties may be interested in how users arrive or depart from certain w...

Claims


Application Information

Patent Timeline
Patent Type & Authority Patents(United States)
IPC IPC(8): G06F3/048G06F15/177
CPCG06F3/048G06Q30/00
Inventor PETTINATI, LUCAS VISVIKISMUI, LIKZHANG, FENGHUILIAO, LINFOX, DOUGLI, PENGXU, ZHITINGMARTINEZ, MANUELWATTENBERG, MARTINVIEGAS, FERNANDA
Owner GOOGLE LLC
Why Eureka
Try Eureka