
System and method for analyzing and imaging three-dimensional volume data sets using a three-dimensional sampling probe

a three-dimensional sampling and volume data technology, applied in the field of three-dimensional volume data sets, can solve the problems of cluttering the user's field, slow traditional slice and composite technique, and affecting the user's ability to accurately visualize and interpret the features inherent in the 3d volume data s

Inactive Publication Date: 2016-05-24
LANDMARK GRAPHICS CORP
View PDF1 Cites 12 Cited by
  • Summary
  • Abstract
  • Description
  • Claims
  • Application Information

AI Technical Summary

Benefits of technology

The present invention provides a system and method for analyzing and imaging 3D volume data sets using a 3D sampling probe. The system creates one or more 3D sampling probe(s) that are sub-volumes of the 3D data set and draws an image of the probe(s) for display to the user. The image is re-drawn quickly enough to be perceived as real-time by the user. The system can also move the location of the probe within the 3D data set and repeat the drawing process for better visualization. The invention allows users to easily visualize and interpret physical parameters of the geographic space represented by the 3D data set.

Problems solved by technology

Although the user can see the internal organization or structure of the volume as the composite image grows, the traditional slice and composite technique is typically slow, particularly when very large 3D volume data sets are being used.
Additionally, the slice and composite technique clutters the user's field of view with extraneous information, and interferes with the user's ability to accurately visualize and interpret features inherent in the 3D volume data set.
Such conventional computer programs have numerous deficiencies that preclude a user from quickly and accurately visualizing and interpreting features inherent in a 3D seismic data set.
During the 30-45 second delay time, the mind of the user loses focus on the feature of interest, making it difficult to completely and properly analyze the seismic data.
The interruption in the displayed image makes it difficult for the user to visualize any continuity between the two pieces of the full 3D volume of seismic data that have been imaged.
This impedes the user's ability to interpret and identify the geologic features that are inherent in the full 3D volume of seismic data.
Additionally, even though only a piece of the full 3D volume of seismic data is being visibly displayed, conventional 3D seismic interpretation programs continue processing the full 3D volume of seismic data to draw the image, thereby slowing the display of the image to the user.
This is time consuming even on a high speed graphics supercomputer.
Additionally, conventional 3D seismic interpretation programs do not provide the capability to directly delete from the collection of picked voxels.
This iterative process is time consuming, and interferes with the visualization process of the user.

Method used


Image

  • System and method for analyzing and imaging three-dimensional volume data sets using a three-dimensional sampling probe
  • System and method for analyzing and imaging three-dimensional volume data sets using a three-dimensional sampling probe
  • System and method for analyzing and imaging three-dimensional volume data sets using a three-dimensional sampling probe

Examples


Embodiment Construction

Overview

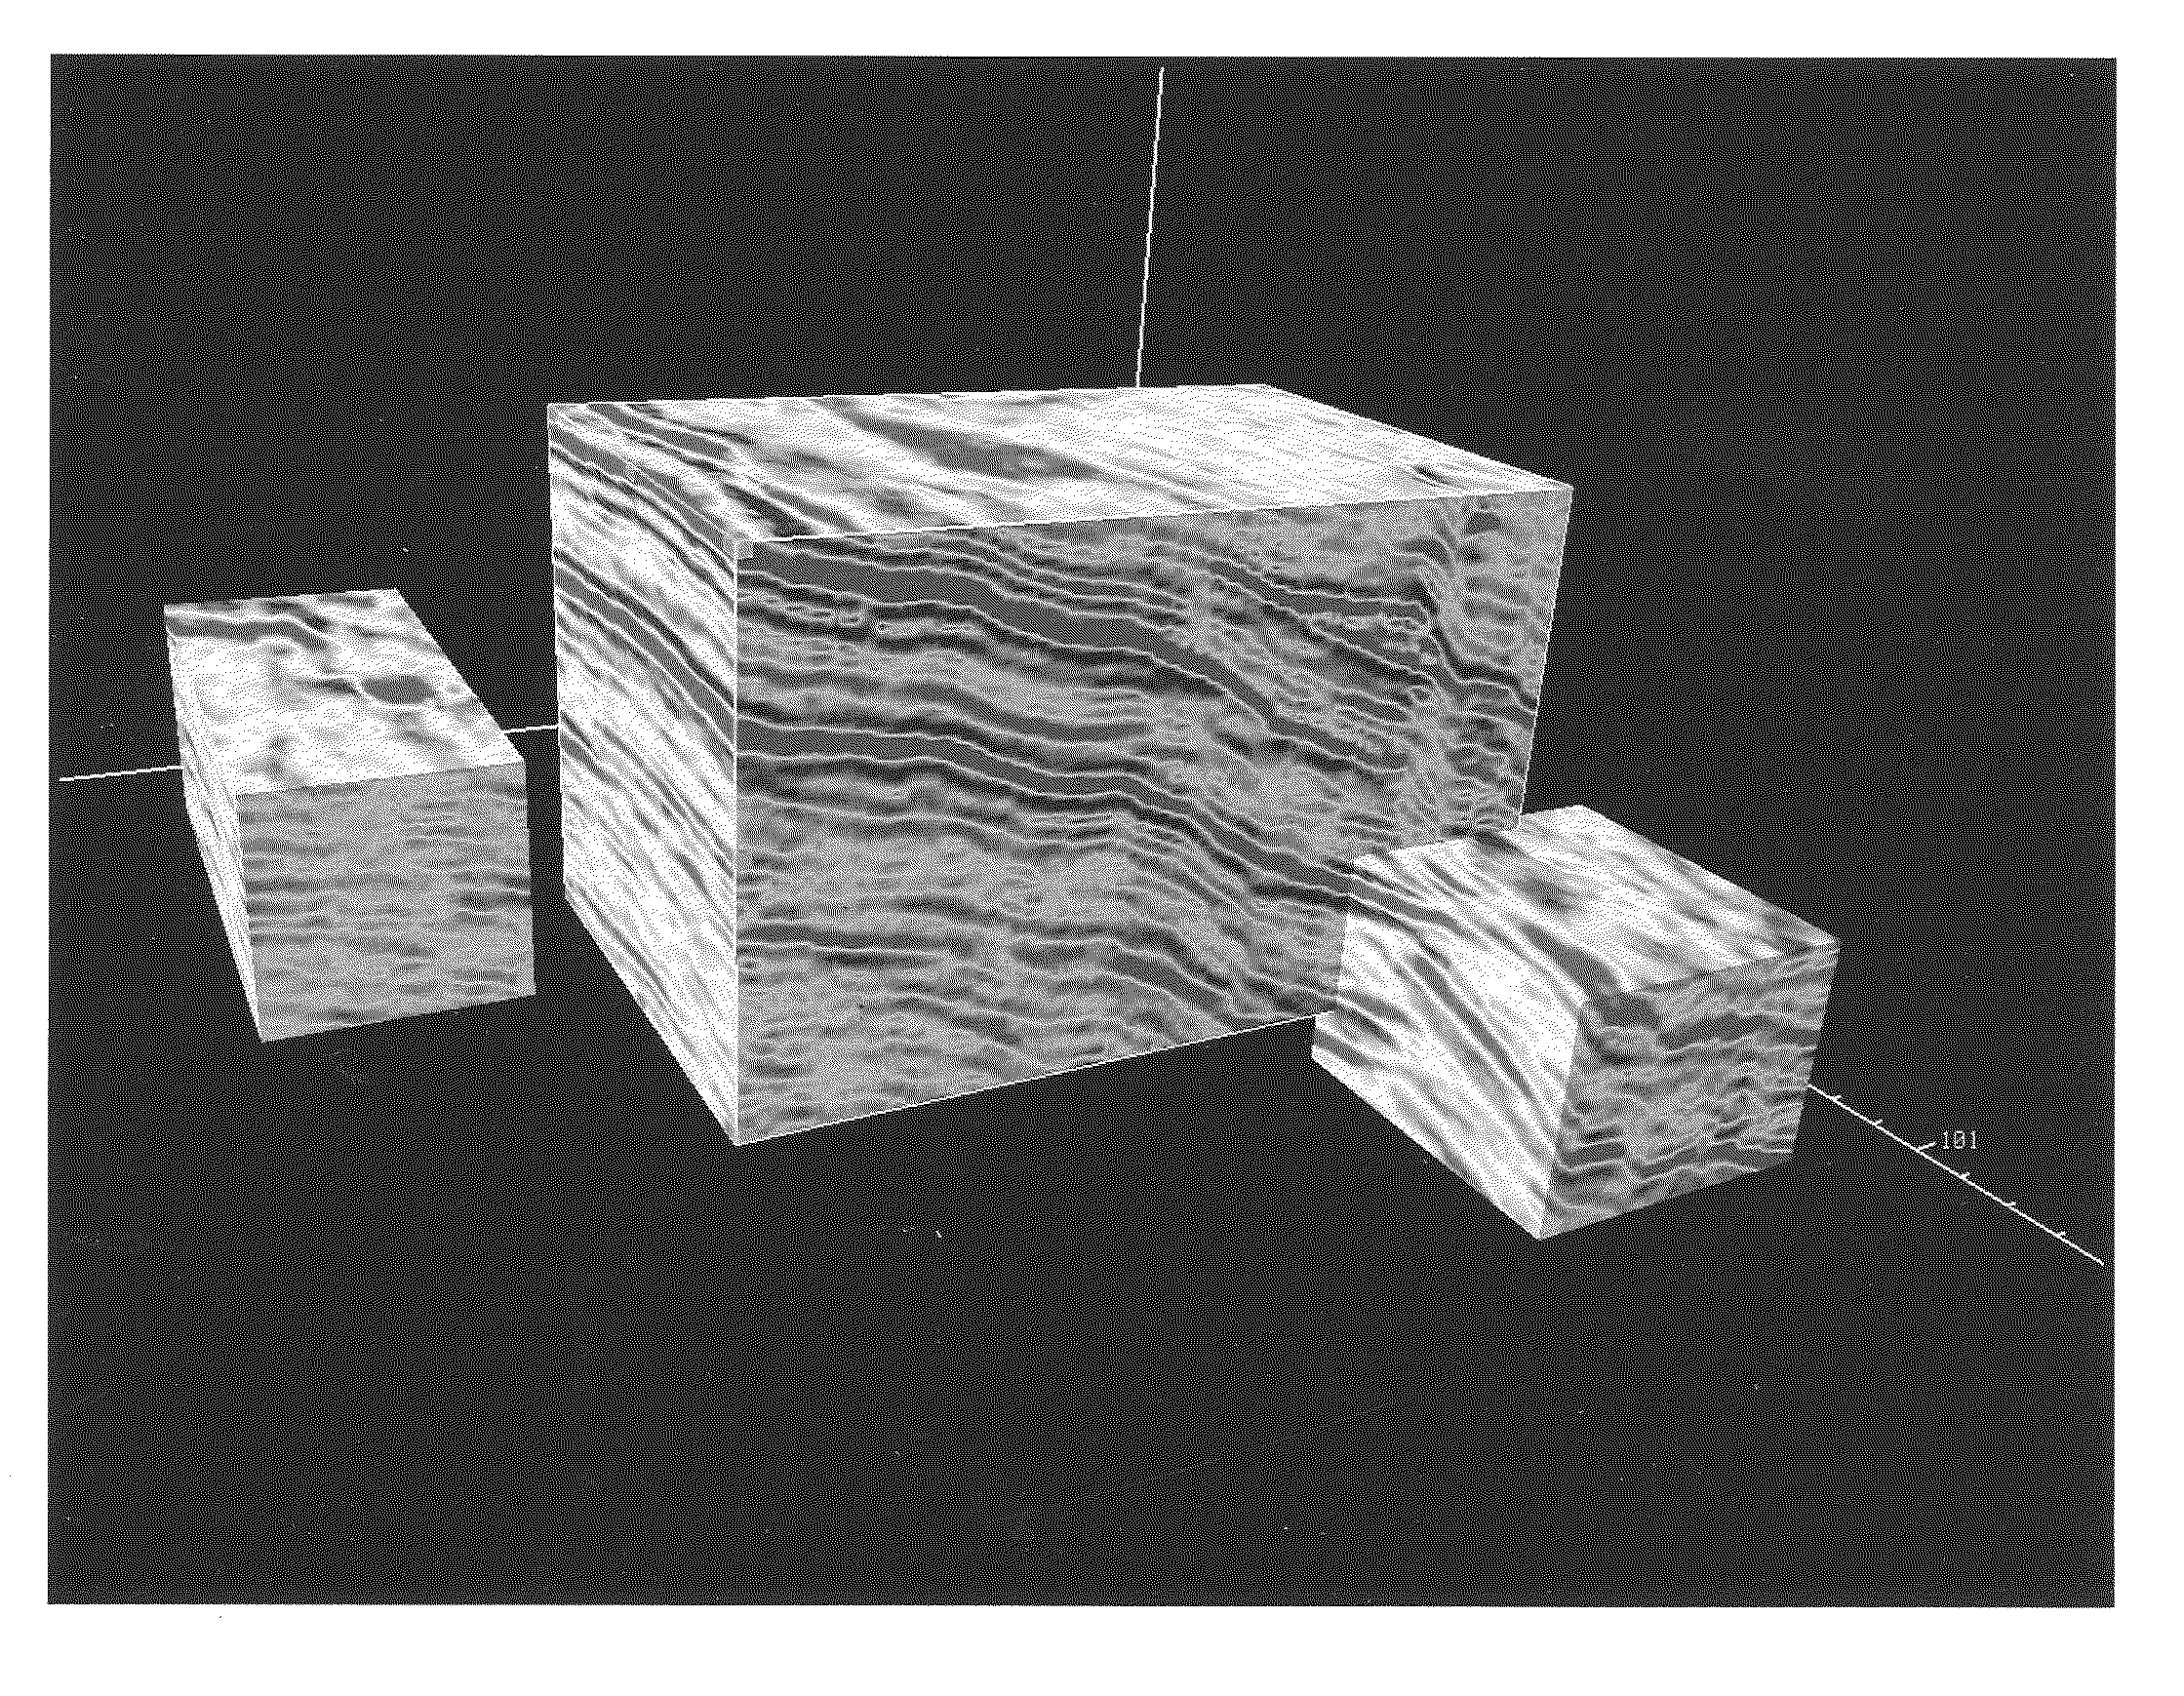
[0052]The present invention is directed to a system and method for analyzing and imaging three-dimensional (“3D”) volume data sets using a 3D sampling probe. 3D volume data sets comprise “voxels” or volume elements. Each voxel is a sample or point within a volume. Each voxel can be expressed in the form (x, y, z, data value) where “x, y, z” identifies the 3D location of the point within the volume, and “data value” is the value of some measured or calculated attribute or physical parameter at the specified point within the volume. For example, a 3D volume data set suitable for use with the present invention is 3D seismic data. Each voxel in a 3D seismic data can be expressed as (x, y, z, amplitude), with amplitude corresponding to the amplitude of reflected sound waves at the specified (x, y, z) location.

[0053]Any form of information that can be expressed in the voxel form (x, y, z, data value) is suitable for use with the present invention. In addition to seismic data, exam...


PUM


Abstract

System and method for analyzing and imaging three-dimensional volume data sets using a three-dimensional sampling probe. A number of sampling probes can be created, shaped, and moved interactively by the user within the whole three-dimensional volume data set. As the sampling probe changes shape, size, or location in response to user input, the image is re-drawn at a rate sufficiently fast to be perceived as real-time by the user. In this manner, the user can more easily and effectively visualize and interpret the features and physical parameters that are inherent in the three-dimensional volume data set.

Description

CROSS-REFERENCE TO RELATED APPLICATIONS[0001]This application is a continuation of U.S. patent application Ser. No. 10 / 806,980, filed on Mar. 22, 2004, which is a continuation of U.S. patent application Ser. No. 09 / 119,635, filed on Jul. 21, 1998, which are both incorporated herein by reference. Applicants therefore, claim priority based on the filing date of U.S. patent application Ser. No. 09 / 119,635.BACKGROUND OF THE INVENTION[0002]1. Field of the Invention[0003]The present invention relates generally to imaging of three-dimensional (“3D”) volume data sets. More particularly, the present invention relates to fast visualization and analysis of very large 3D volume data sets using 3D computer graphics.[0004]2. Related Art[0005]Many fields of endeavor require the analysis and imaging of three-dimensional (“3D”) volume data sets. For example, in the medical field, a CAT (computerized axial tomography) scanner or a magnetic resonance imaging (MRI) device is used to produce a “picture”...

Claims


Application Information

Patent Timeline
Patent Type & Authority Patents(United States)
IPC IPC(8): G06T15/00G06T15/08G06T17/05
CPCG06T15/08G06T17/05
Inventor CHEUNG, YIN LZEITLIN, MICHAEL JACOSTA, MARK
Owner LANDMARK GRAPHICS CORP
Features
  • Generate Ideas
  • Intellectual Property
  • Life Sciences
  • Materials
  • Tech Scout
  • Unparalleled Data Quality
  • Higher Quality Content
  • 60% Fewer Hallucinations
Learn More