

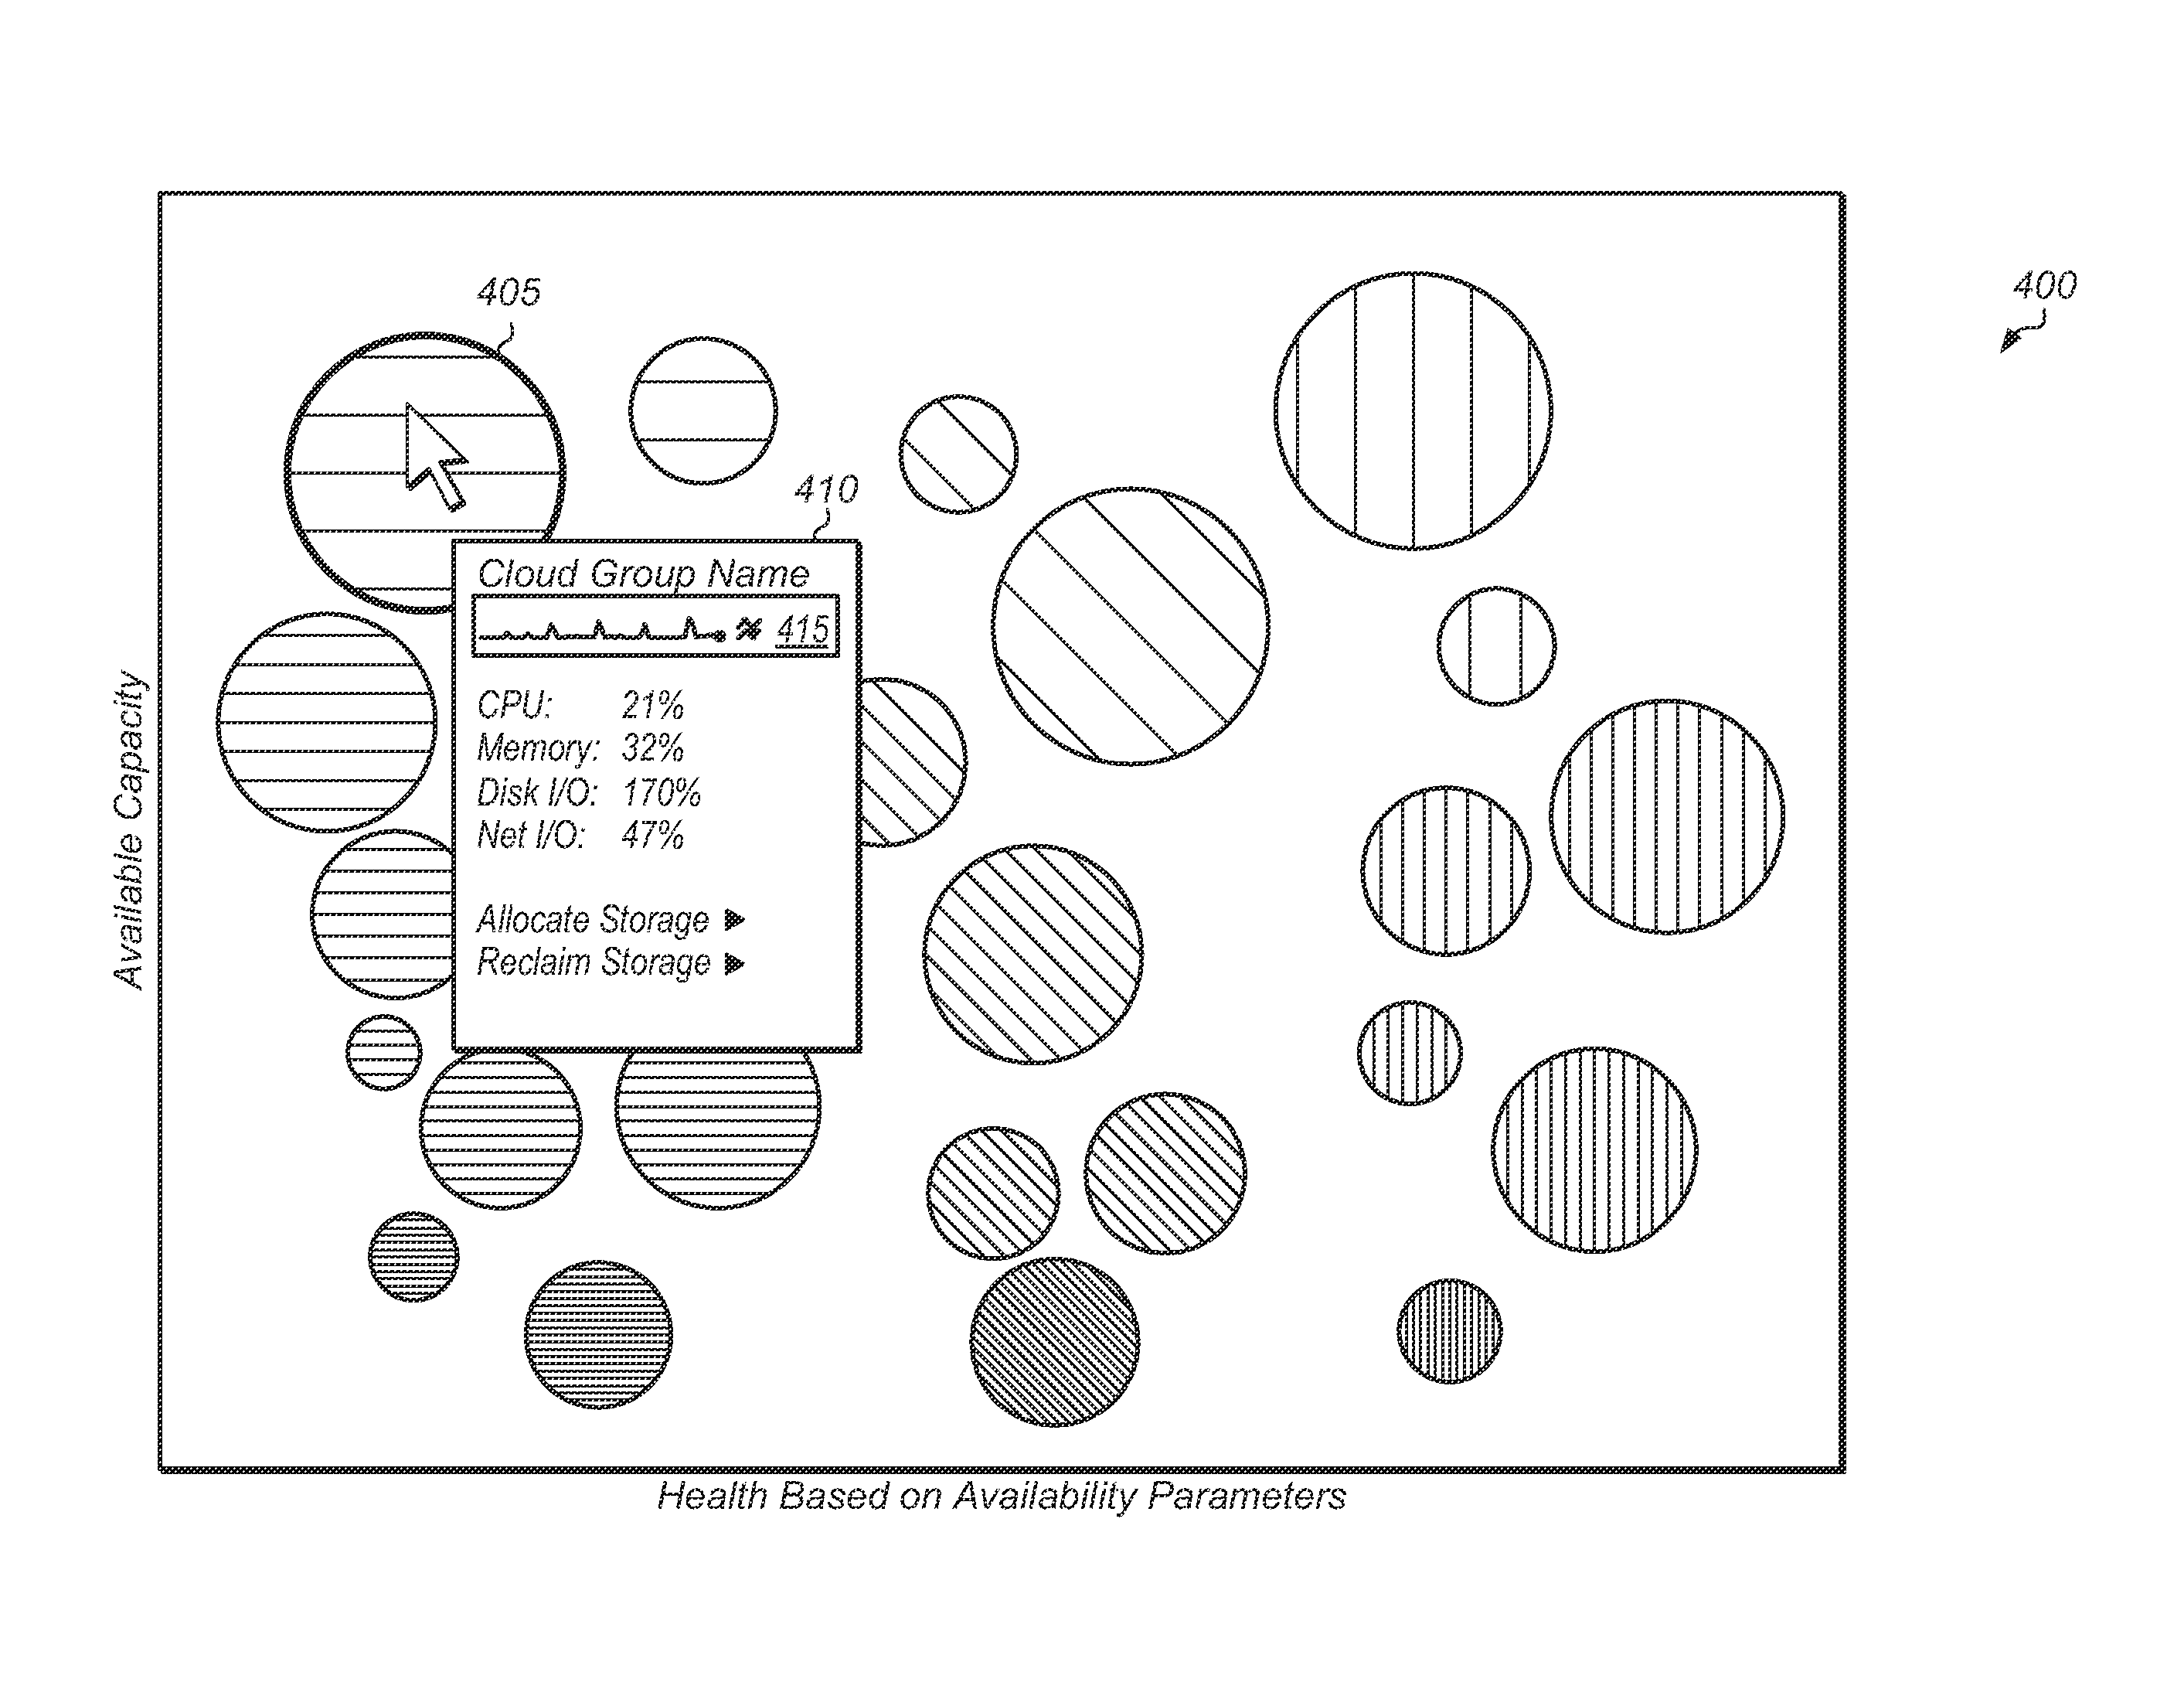
Method and system to visually represent the status of a data center
a data center and status technology, applied in the field of computer systems, can solve the problems of not having a single view that provides an administrator with an overview, and performing actions such as allocating and reclaiming storage are typically not integrated
- Summary
- Abstract
- Description
- Claims
- Application Information
AI Technical Summary
Benefits of technology
Problems solved by technology
Method used
Image

Examples
Embodiment Construction
[0022]In the following description, numerous specific details are set forth to provide a thorough understanding of the methods and mechanisms presented herein. However, one having ordinary skill in the art should recognize that the various embodiments may be practiced without these specific details. In some instances, well-known structures, components, signals, computer program instructions, and techniques have not been shown in detail to avoid obscuring the approaches described herein. It will be appreciated that for simplicity and clarity of illustration, elements shown in the figures have not necessarily been drawn to scale. For example, the dimensions of some of the elements may be exaggerated relative to other elements.
[0023]This specification includes references to “one embodiment”. The appearance of the phrase “in one embodiment” in different contexts does not necessarily refer to the same embodiment. Particular features, structures, or characteristics may be combined in any ...
PUM
 Abstract
Description
Claims
Application Information