Method for determining microscopic mechanics performance of each consist composing phase in polyphase material

A technology of micromechanics and multiphase materials, which is applied in the field of measurement of micromechanical properties of each constituent phase in multiphase materials, and can solve problems such as no data point grouping

Active Publication Date: 2011-05-11
BAOSHAN IRON & STEEL CO LTD
View PDF7 Cites 1 Cited by
  • Summary
  • Abstract
  • Description
  • Claims
  • Application Information

AI Technical Summary

Problems solved by technology

Unfortunately, these literatures do not report how to group the data points obtained from the test and make a one-to-one correspondence between the data groups and the constituent phases, which is precisely the key to determining the microscopic mechanical properties of the constituent phases of multiphase materials

Method used


Image

  • Method for determining microscopic mechanics performance of each consist composing phase in polyphase material
  • Method for determining microscopic mechanics performance of each consist composing phase in polyphase material
  • Method for determining microscopic mechanics performance of each consist composing phase in polyphase material

Examples


Embodiment 1

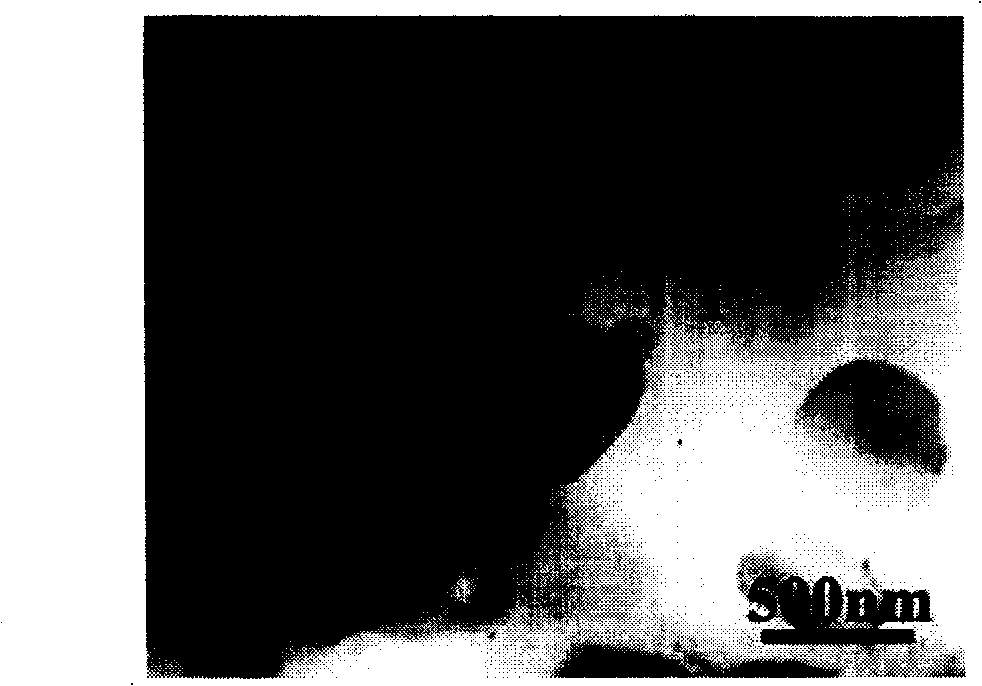
[0060] The multi-phase material to be tested is spheroidized annealed GCr15 bearing steel, and its microstructure is as figure 2 As shown, spherical carbides (cementite, θ) are distributed in the matrix ferrite phase (F), and the average diameter of the particles is 0.5 μm.

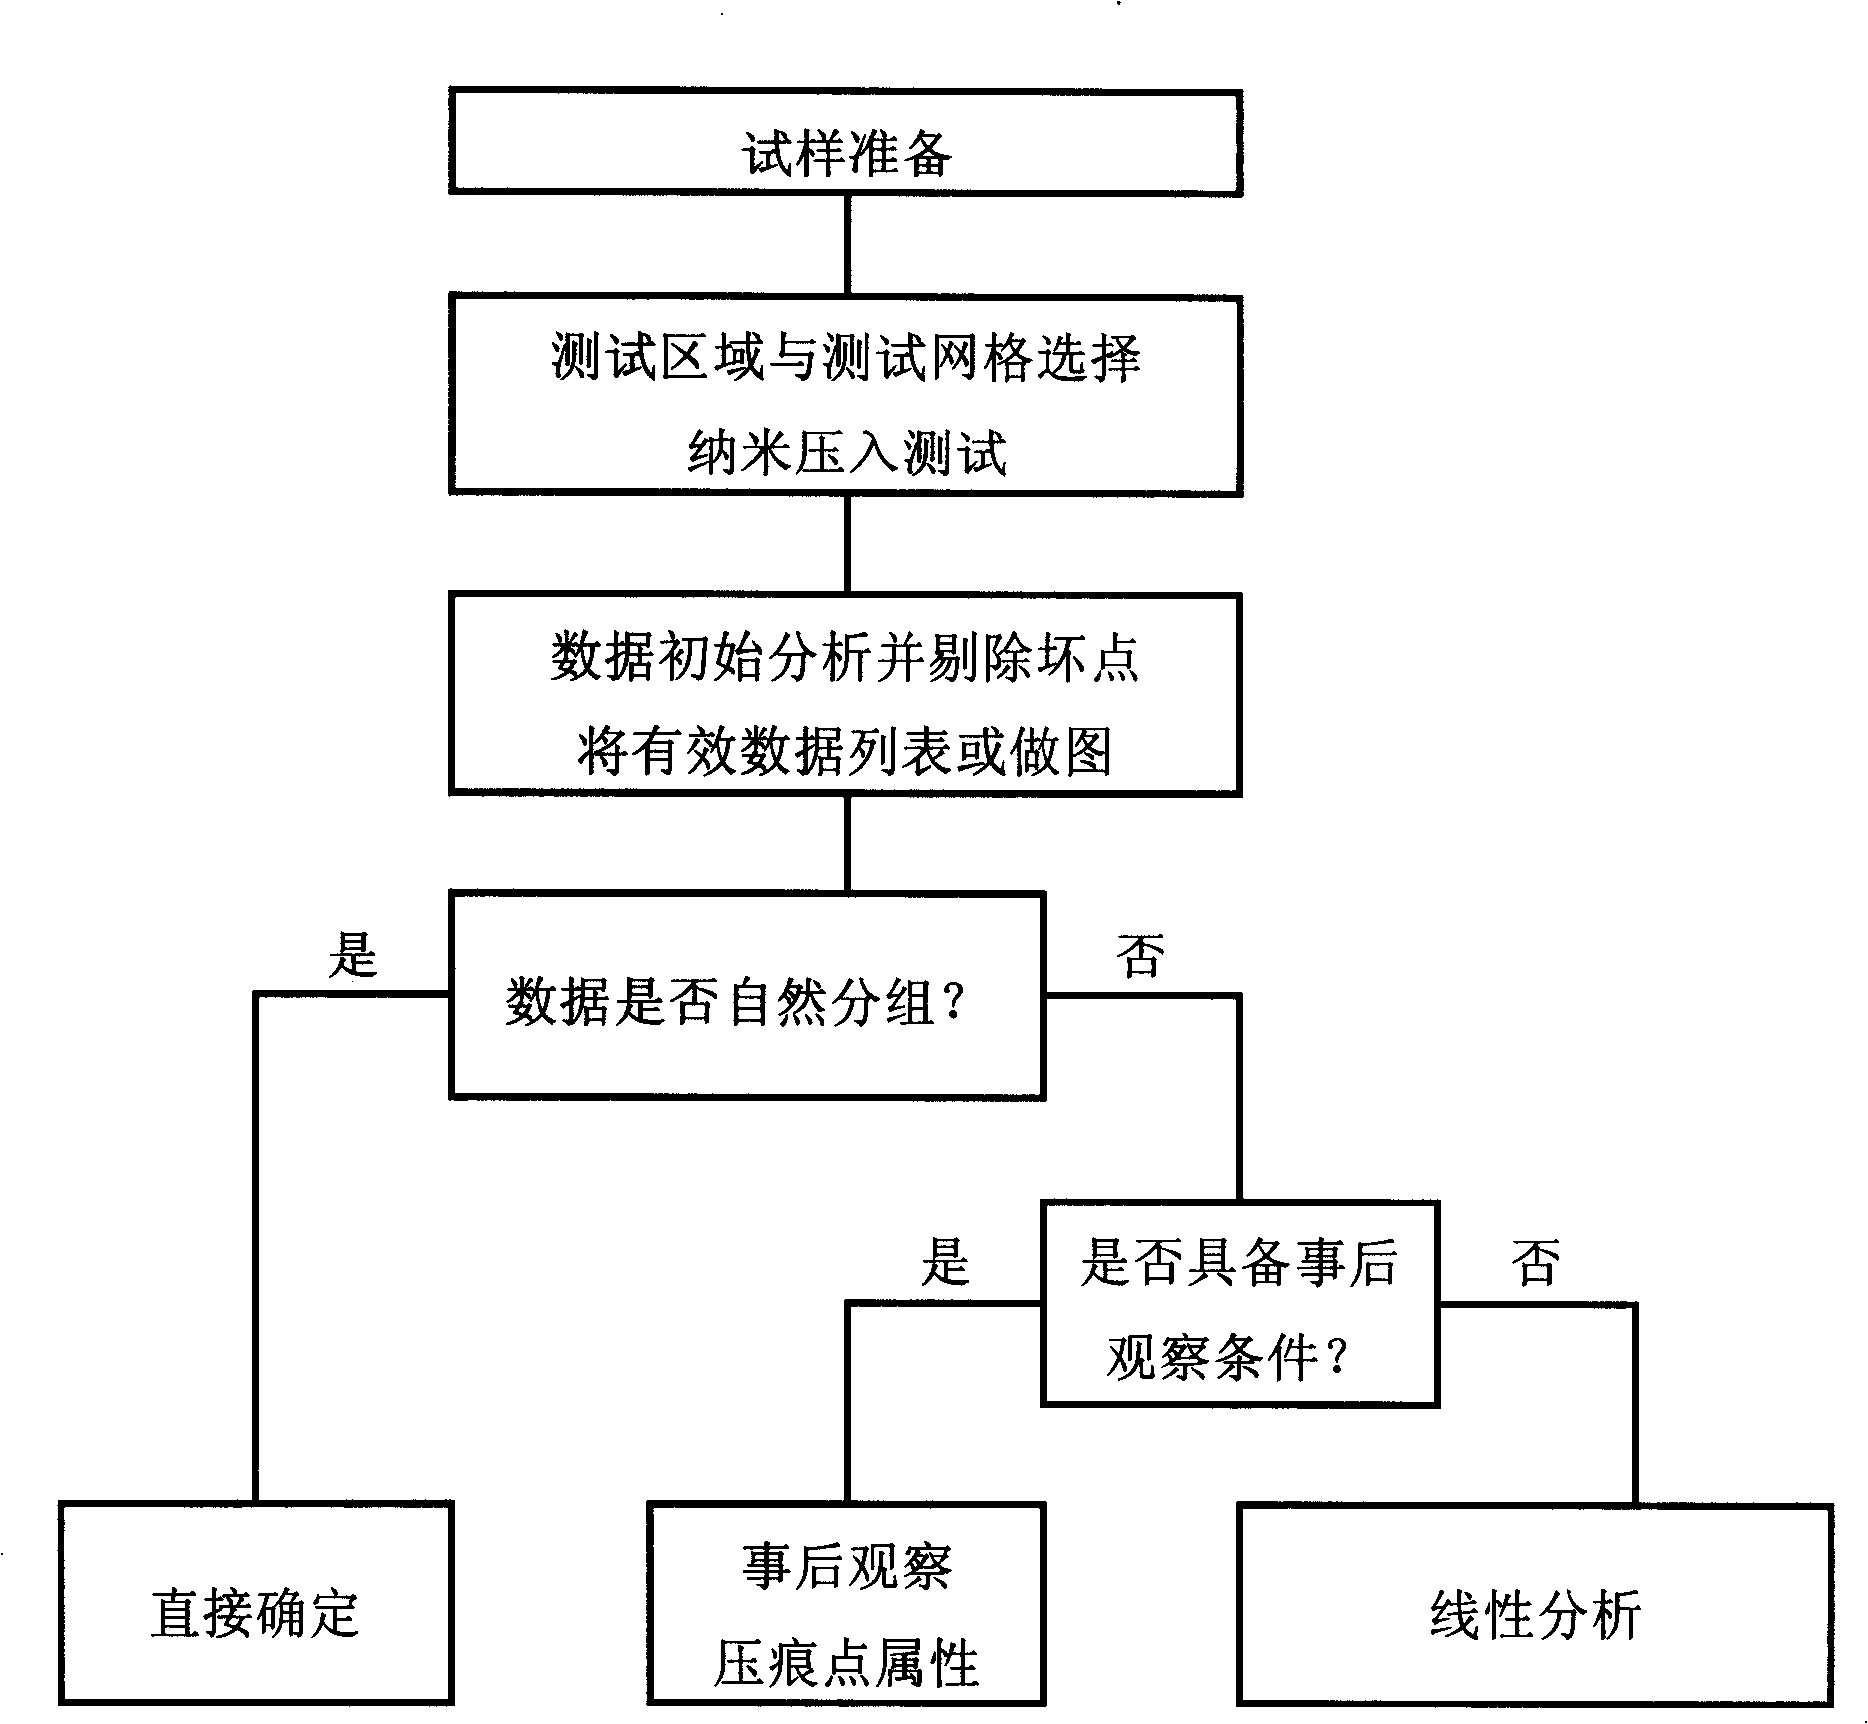
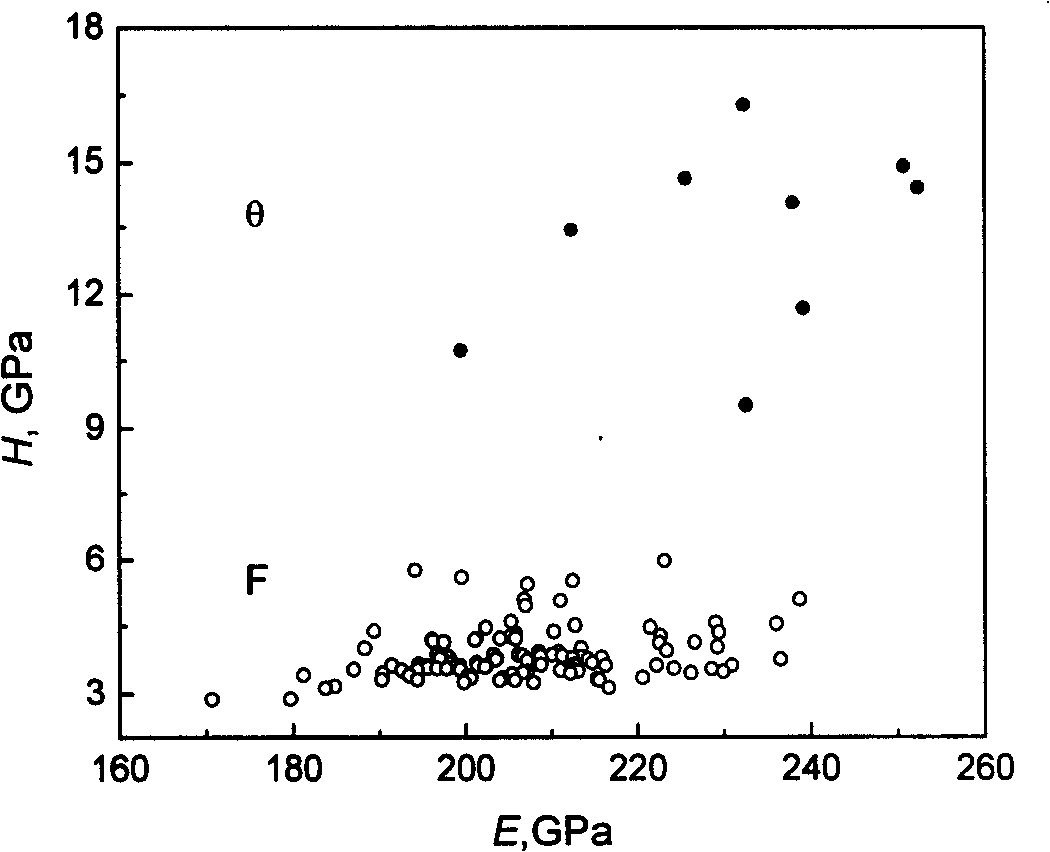
[0061] The specific scheme of nanoindentation test is shown in Table 1. The 119 effective data points obtained are listed in Table 2 in order of hardness from high to low. It can be seen that the first 9 data points form a group of their own (in the thick line box in the upper left corner of the table), and their hardness is significantly higher than the other data points. If the above 119 valid data are plotted in a rectangular coordinate system, we will get image 3 E-H scatter plot shown. It can be seen more intuitively that there are indeed 9 data points in a group (upper part of the figure), and their hardness is significantly higher. Because m min =9>5, the aforementioned nanoindentation test schem...

Embodiment 2

[0069] The multi-phase material to be tested is as-cast ferritic-austenitic duplex stainless steel, and its microstructure is as Figure 4 As shown, a coarse dendritic austenite phase (A) is distributed in the matrix ferrite phase (F).

[0070] The specific scheme of the nanoindentation test is shown in Table 1, and the scatter diagram of the 228 effective data points obtained by the test is shown in Figure 5 . It can be seen that these data points are not grouped naturally, but because the steel is a cast structure, the dendrites are very coarse (see Figure 4 ). This is easy to judge one by one through optical microscope observation ("post observation") after the press-in test Image 6 The composition phase corresponding to each indentation point in the Figure 5 The composition phase corresponding to each data point in the Figure 7 . Because m min =82>5, the aforementioned nanoindentation test scheme (see Table 1) is effective, and the test results (see Table 3) have statis...

Embodiment 3

[0071] Example 3 (the linear analysis result of Example 2):

[0072] Since the data points are not grouped naturally, the post-observation method is used in Example 2 ( Image 6 ) Determine the correspondence between data points and each component phase ( Figure 7 ). analysis Figure 7 , If you draw a straight line to divide the data points into two groups, most of the data points on the left of the dividing line correspond to the austenite phase (A), and most of the data points on the right correspond to the ferrite phase ( F). This means that in the absence of conditions for "post-observation", linear analysis can be used to approximate the correspondence between data points and each component phase. When solving the dividing line equation shown in formula (1), it is necessary to ensure that the total number of misjudged data points (that is, the erroneous correspondence between the data points and the constituent phases) is minimized. From this, determine Figure 7 The line...


PUM

PropertyMeasurementUnit
diameteraaaaaaaaaa

Abstract

A method for measuring microcosmic dynamic properties of each compositive phase in a multiphase material comprises the following steps: (1) preparing a multiphase material sample to be measured; (2) radom selecting one or a plurality of test areas on the surface of the sample to be measured to perform the nanometer pressing-in test, arranging test points in a way of grid, grid nodes and impressing points being in one-to-one correspondence; (3) initially analyzing the test result to get a total of Ne effective elastic modulus E-hardness H data pairs, listing the data summarization or drawing a scattergraph in an E-H rectangular plane coordinates system; (4) grouping the Ne effective data points, the data group and the compositive phases being in a one-to-one correspondence; (5) determining volume fraction and the microcosmic dynamic properties of each compositive phase according to the data group. Therefore, each compositive phase content, the elastic modulus and the hardness of the multiphase material can be measured conveniently and flexibly; the measure result is visual and reliable, thereby being particularly suitable for the measurement of the microcosmic dynamic properties of each compositive phase in the multiphase materials such as the multiphase steel, the polymer, the biological materials and the composite materials, etc.

Description

Technical field [0001] The present invention relates to a method for measuring the micromechanical properties of each component phase in a multiphase material, and in particular, to a method for measuring the elastic modulus and hardness of each component phase in a multiphase material. Background technique [0002] Multiphase materials have rich organizational properties, widely exist in nature or engineering circles, and are widely used in engineering structures. As the name suggests, multiphase materials are materials that contain at least two different types of constituent phases in their microstructure. The microscopic properties (including micromechanical properties) and phase ratio (or content, usually expressed as volume fraction) of these component phases have a decisive influence on the macroscopic properties (including macromechanical properties) of multiphase materials. It is for this reason that people can develop and even design a variety of multiphase materia...

Claims


Application Information

Patent Timeline
Patent Type & Authority Patents(China)
IPC IPC(8): G01N13/00G01N3/00G01N1/32G06F19/00
Inventor 宋洪伟王秀芳杨晓萍史弼
Owner BAOSHAN IRON & STEEL CO LTD
Why Eureka
Try Eureka