Method for acquiring vocal print picture with refined time-frequency structure

A voiceprint, time-frequency technology, applied in speech analysis, instruments, etc., can solve the problems of unable to provide voiceprint, unable to provide time-frequency structure, etc.

Inactive Publication Date: 2010-06-09
JIANGNAN UNIV
View PDF0 Cites 11 Cited by
  • Summary
  • Abstract
  • Description
  • Claims
  • Application Information

AI Technical Summary

Problems solved by technology

Speech is a non-stationary, multi-component, real-valued signal, and its WVD cannot provide a time-frequency structure that reflects the non-stationary characteristics of speech. Therefore, based on nonlinear time-frequency analysis methods, it cannot provide effective voiceprints.

Method used


Image

  • Method for acquiring vocal print picture with refined time-frequency structure
  • Method for acquiring vocal print picture with refined time-frequency structure
  • Method for acquiring vocal print picture with refined time-frequency structure

Examples


specific Embodiment

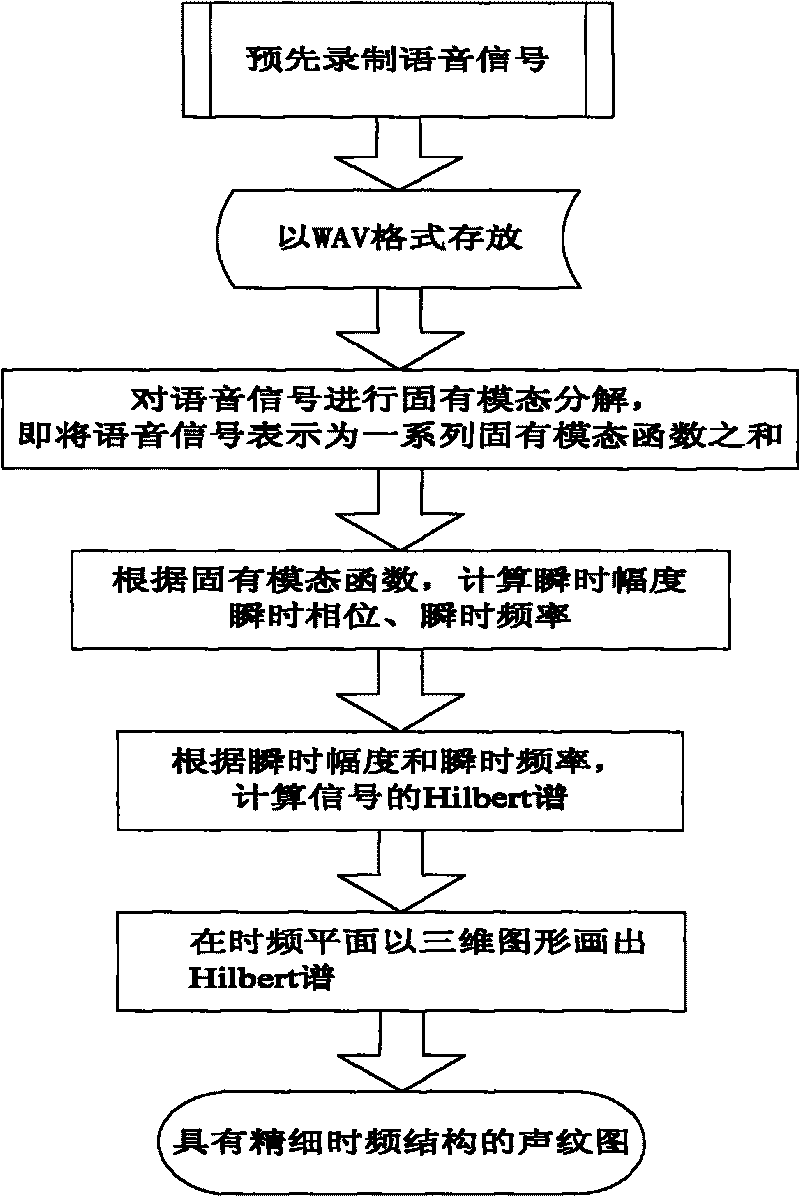
[0072] A specific embodiment of the present invention is as follows:

[0073] Step 1: Record the voice signal, filter it if necessary, and store it in WAV format.

[0074] Step 2: Perform intrinsic mode decomposition on the recorded speech signal, and express the speech signal as the sum of a series of intrinsic mode functions.

[0075] Step 3: Find the instantaneous amplitude and instantaneous frequency according to the intrinsic mode function.

[0076] Step 4: Calculate the Hilbert spectrum of the signal.

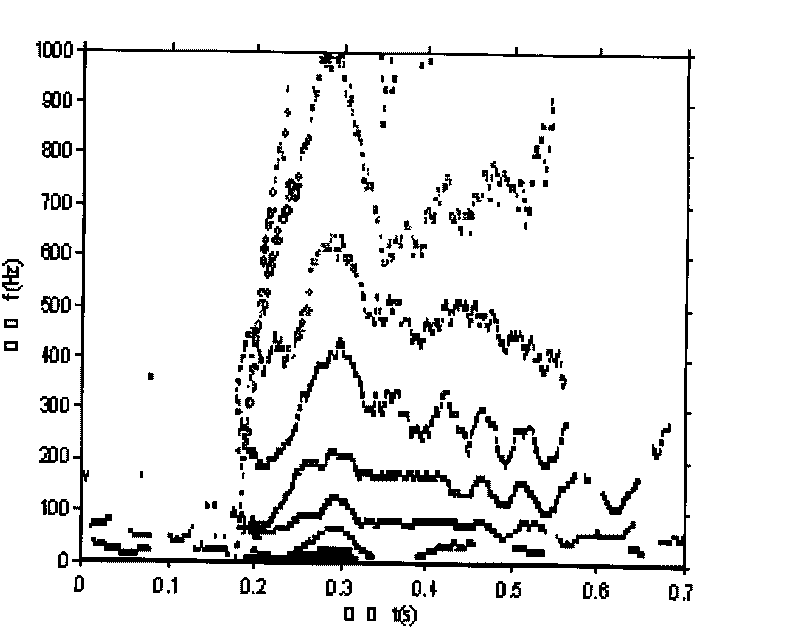
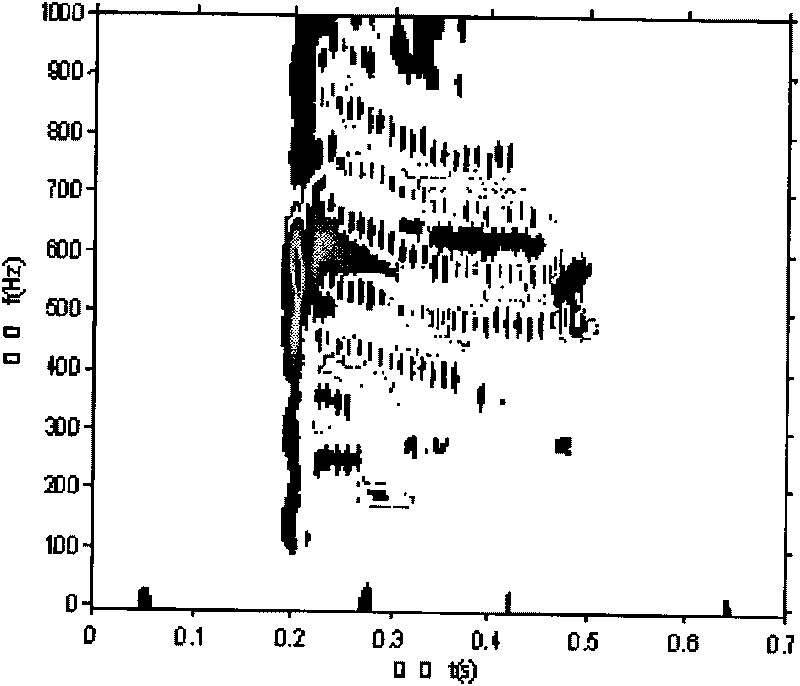
[0077] Step 5: Draw the Hilbert spectrum in a three-dimensional graph on the time-frequency plane to obtain a voiceprint image with a fine time-frequency structure.

[0078] In order to compare the actual effect of the present invention, the "five" in English by an adult male voice is used as an experimental signal (this speech signal comes from a publicly available speech database). Obtain the voiceprint figure with fine time-frequency structure by the method of the p...


PUM


Abstract

The invention relates to a time-frequency analysis method for a voice signal, which displays the analysis result in a mode of a vocal print picture, and provides a method for acquiring the vocal print picture with a refined time-frequency structure. Due to the adoption of an adaptive signal decomposition method, the vocal print picture provides the refined time-frequency structure which reflects the non-stable characteristic of the voice signal, but because of the window effect of the conventional spectrogram, the conventional spectrogram have to use a long-window spectrogram and a short-window spectrogram to describe the non-stable characteristic of the voice signal. The vocal print picture with the refined time-frequency structure can be further applied to speaker recognition, vocal print identification and the like.

Description

technical field [0001] The invention relates to a time-frequency analysis method of a speech signal, in particular to a method for obtaining a voiceprint image with a fine time-frequency structure. Background technique [0002] The voiceprint is also called the spectrogram, referred to as the spectrogram. It was invented by Bell Labs researchers in 1941. It uses three-dimensional or two-dimensional graphics to display the characteristics of the voice spectrum. The vertical axis represents frequency, the horizontal axis represents time, and the depth of color. Indicates the magnitude of energy in a specific frequency band. The earliest analog spectrogram instruments converted sound waves into electrical signal strengths, wavelengths, frequencies, and rhythms, and then plotted these electrical signals into spectral graphs. [0003] There are two types of spectrograms currently used: broadband (short window) spectrogram and narrowband (long window) spectrogram. These two spec...

Claims


Application Information

Patent Timeline
Patent Type & Authority Applications(China)
IPC IPC(8): G10L19/00G10L19/02
Inventor 于凤芹
Owner JIANGNAN UNIV
Why Eureka
Try Eureka