Method for fast displaying electronic chart

A display method and electronic chart technology, applied in the direction of image data processing, image data processing, graphics and image conversion, etc., can solve the problems of no fast reading file improvement, not fast display, weak practicability, etc., so as to avoid continuous repetition Drawing, convenient file search, strong practical effects

Active Publication Date: 2010-12-08
哈尔滨哈船导航技术有限公司
View PDF5 Cites 21 Cited by
  • Summary
  • Abstract
  • Description
  • Claims
  • Application Information

AI Technical Summary

Problems solved by technology

[0005] However, this paper does not propose improvements for the rapid reading of files during the zooming process of the chart. When the zoom is reached to change the chart, the chart is searched again, resulting in a delay phenomenon.
In addition, the paper does not solve the problem of fast display of the international standard S-57 chart, so the practicability is weak

Method used


Image

  • Method for fast displaying electronic chart
  • Method for fast displaying electronic chart
  • Method for fast displaying electronic chart

Examples


Embodiment Construction

[0034] The present invention is described in more detail below in conjunction with accompanying drawing example:

[0035] Step 1: Chart initialization settings

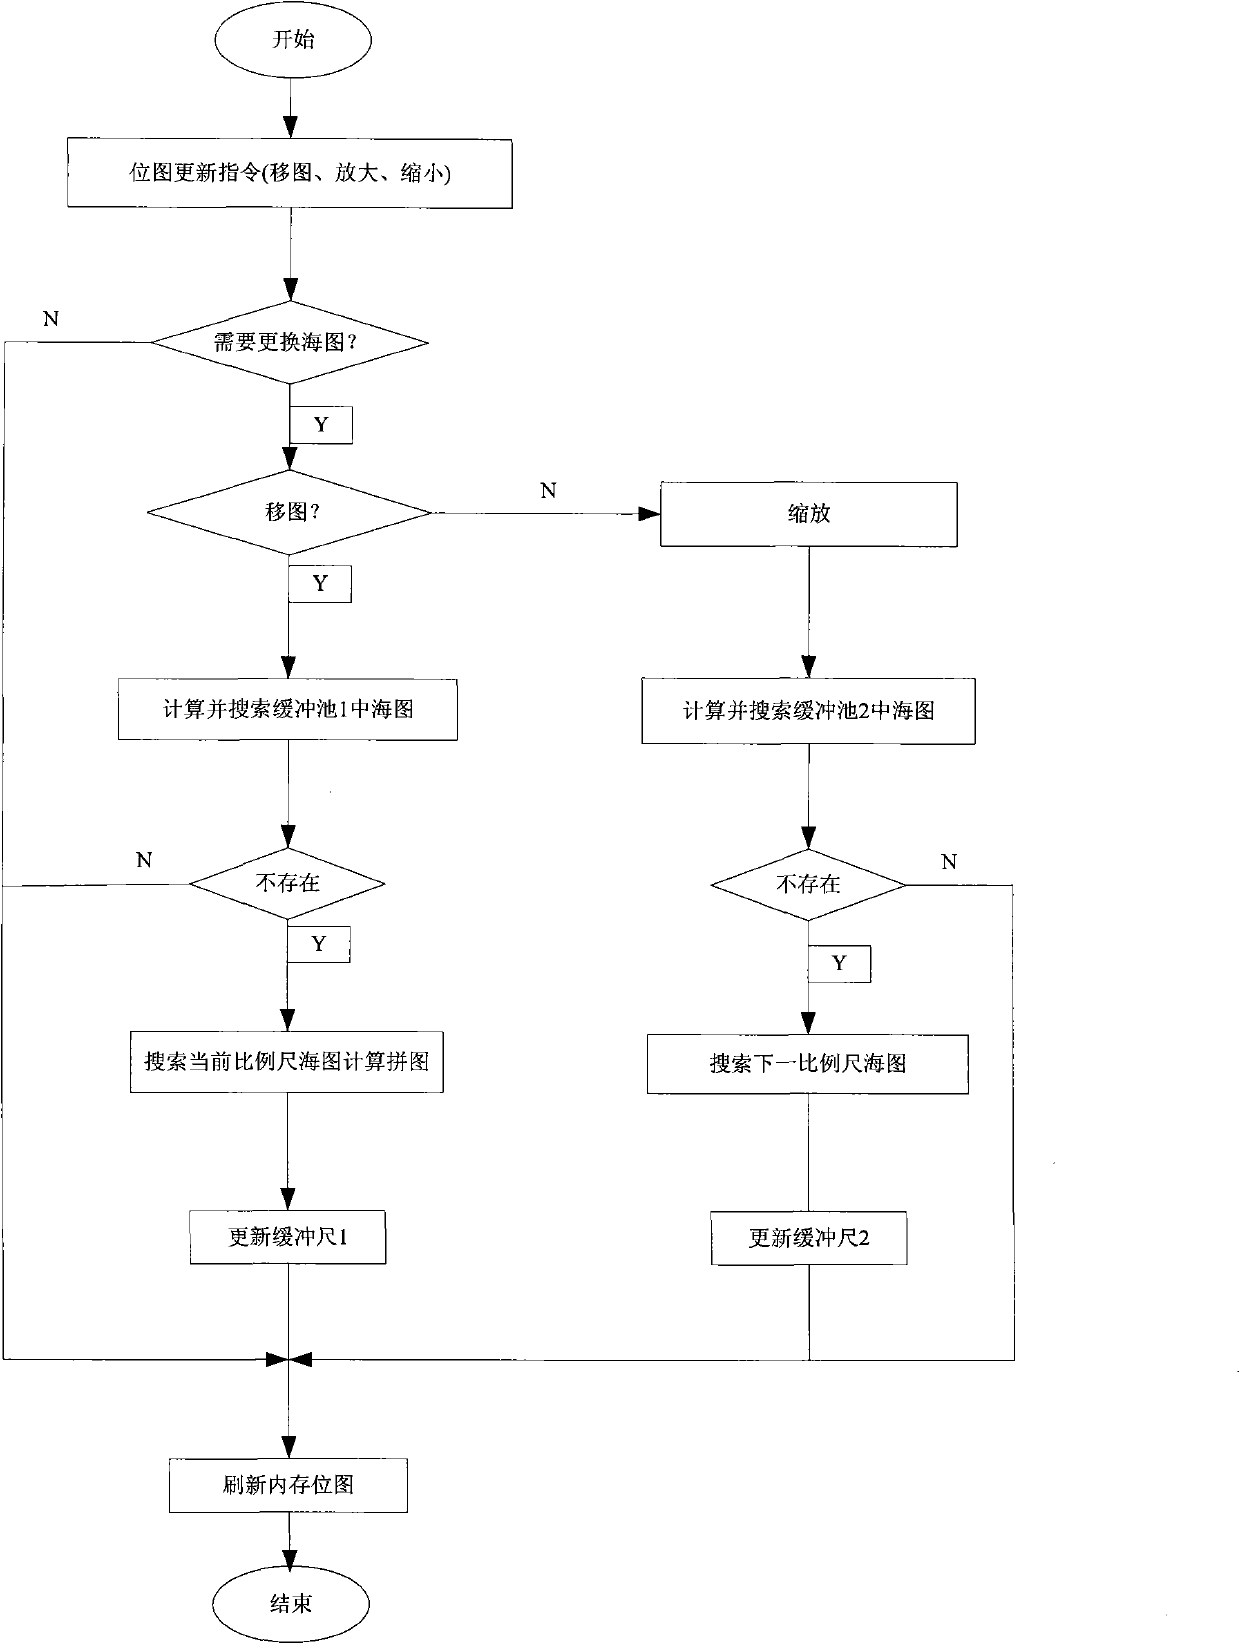
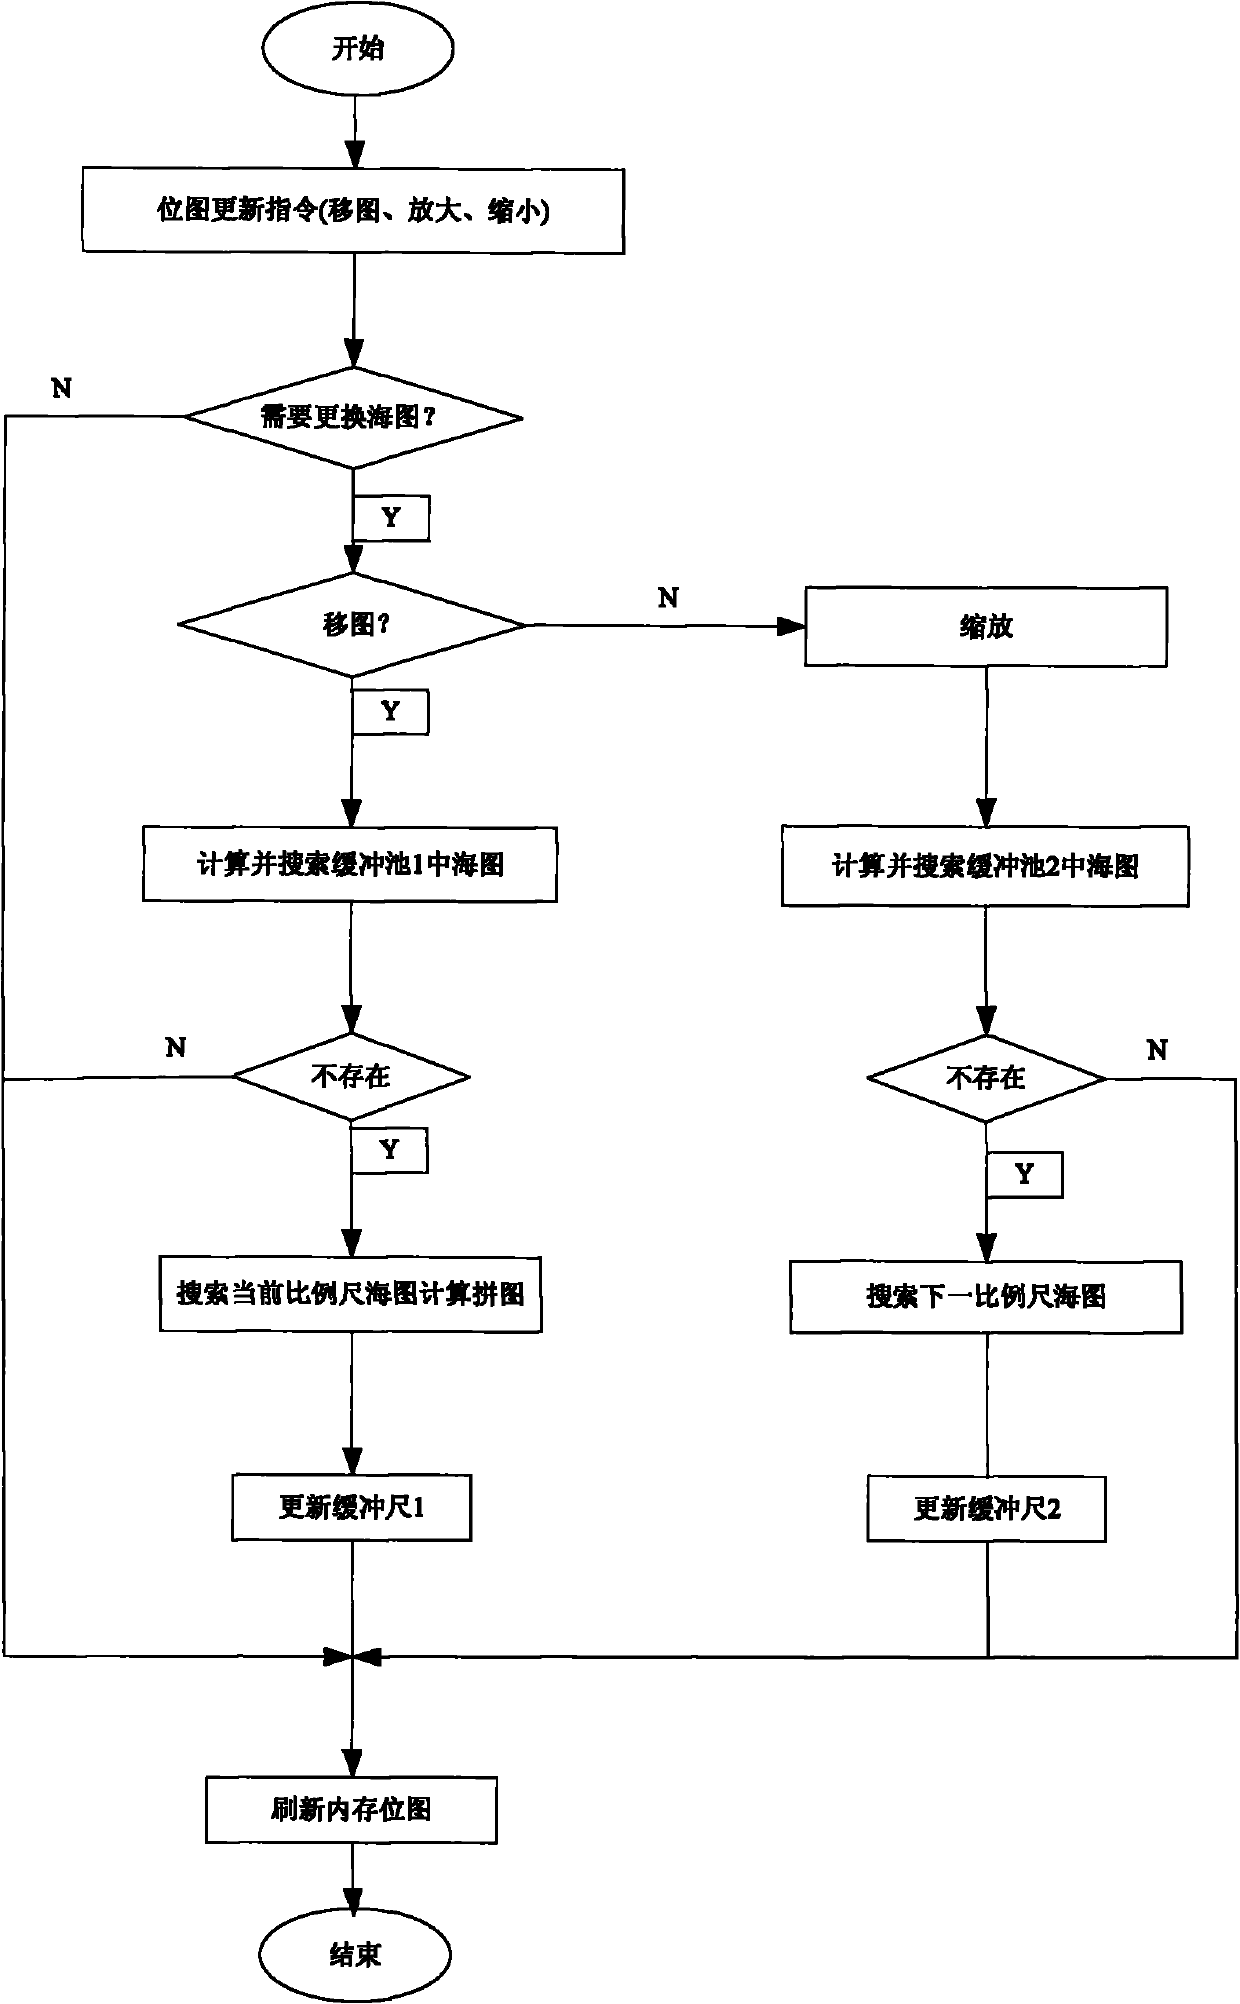
[0036] Limit the minimum and maximum zoom range of the chart. After the same chart is enlarged by 4 times, all the elements of the chart are displayed. It is meaningless to zoom in. If you continue to zoom in, you have to search for a larger scale chart, so that the display is meaningful; zoom out In the same way, if you zoom out twice to 0.5 times the original scale, you should search for a chart with a smaller scale. Therefore, there are restrictions on the zooming of the chart. Under the premise of changing the chart, the initial display scale of the chart is used as the current benchmark. The unit of sub-zoom is 1.5 times, the maximum can be zoomed in by 4 times, and the minimum zoom out is 0.5 times. If it exceeds the above range, search for the next scale chart.

[0037] Step 2: Create a chart file management c...


PUM


Abstract

The invention provides a method for fast displaying an electronic chart, comprising the following steps of: initializing the chart; establishing the class of chart file management; drawing a memory bitmap; and reading in advance a chart data file occurred during picture arrangement into memory by using a double-buffer pool, setting the weight value of a called chart, deleting files according to the weight value, updating a buffer area, and checking the sequence of the chart in the memory. The method adopts the memory bitmap scheme, avoids continuous redrawing in a movement process, and accelerates the movement speed of the chart; and on the basis of the double-buffer pool scheme, a new chart can be fast called in the process of minifying and magnifying the chart, thereby the display speed is increased; and the method supports the fast display of the international standard S-57 format chart and has stronger practicability.

Description

technical field [0001] The invention relates to a method for displaying geographic information, in particular to a method for quickly displaying electronic charts in the international standard S-57 format. Background technique [0002] The electronic chart system (Electronic Chart System, ECS) is an integrated real-time navigation information system produced with the development of the navigation industry and technology. Great technological revolution. According to the definition of the International Hydrographic Organization (IHO): the electronic chart system is a navigation automation system that integrates chart information, positioning information, radar information, and ship dynamic parameters. It consists of electronic chart data files, control display equipment, special software and external sensors. Various domestic manufacturers have also launched many ECDIS systems, but the electronic chart data used by these ECDISs all adopt their own formats, resulting in the i...

Claims


Application Information

Patent Timeline
Patent Type & Authority Applications(China)
IPC IPC(8): G06T1/00G06T3/40G06F17/30
Inventor 赵玉新蒋聪张振兴刘厂高峰沈志峰
Owner 哈尔滨哈船导航技术有限公司
Why Eureka
Try Eureka