Complex data visualization method and equipment based on stacked tree graph

A technology of complex data and tree data structure, applied in the field of information visualization, can solve the problems that users cannot intuitively obtain specific values, poor performance of data hierarchy, and inability to obtain proportions, etc.

Active Publication Date: 2012-08-08
BEIJING TECHNOLOGY AND BUSINESS UNIVERSITY
View PDF5 Cites 53 Cited by
  • Summary
  • Abstract
  • Description
  • Claims
  • Application Information

AI Technical Summary

Problems solved by technology

This system is a relatively mature application of hierarchical visualization methods, but there is also a problem, that is, the analysis of data that requires high timing, such as stocks. The change trend of the data cannot be displayed
In addition, although the hierarchical visualization technology can well see the comparison of the size of each sub-block from the graph, the user cannot intuitively obtain the specific value of a certain sub-block, let alone its proportion in the whole
[0004] Therefore, there is a common problem in the existing time series visual analysis methods, that is, the performance of the hierarchical structure of the data is poor, and the same hierarchical visualization method also has big problems in the performance of data quantification and development trends.

Method used


Image

  • Complex data visualization method and equipment based on stacked tree graph
  • Complex data visualization method and equipment based on stacked tree graph
  • Complex data visualization method and equipment based on stacked tree graph

Examples


Embodiment 1

[0095] The visualization method of the present invention will be described below by taking the application in the pesticide residue detection data as an example:

[0096]Pesticide residue detection data includes a lot of information, such as detection time, region, pesticide residue classification, various pesticide residues, excessive pesticide residues, etc. Users usually hope to be able to judge the quality of agricultural products from different origins, specify preventive measures, and judge the growth of agricultural products based on the results of agricultural products tested in multiple sampling time periods. If a common data table is used, the amount of data is relatively large and it is not easy to compare intuitively. Next, the method of the present invention is used to visualize this type of data. Assume that the user wants to view the pesticide residue test results information of fruits and vegetables in major agricultural and sideline product producing areas wi...

Embodiment 2

[0109] The method and equipment of the present invention can also be used for the visual display of the employment rate of personnel; these data include the employment data of personnel in different industries at different times, for example, we can use the present invention to show China's employment rate in 2007, 2008, 2009, 2010 and 2011 In the past five years, the employment rate of personnel in the four major industries of IT, finance, medicine and construction has been distributed across the country.


PUM


Abstract

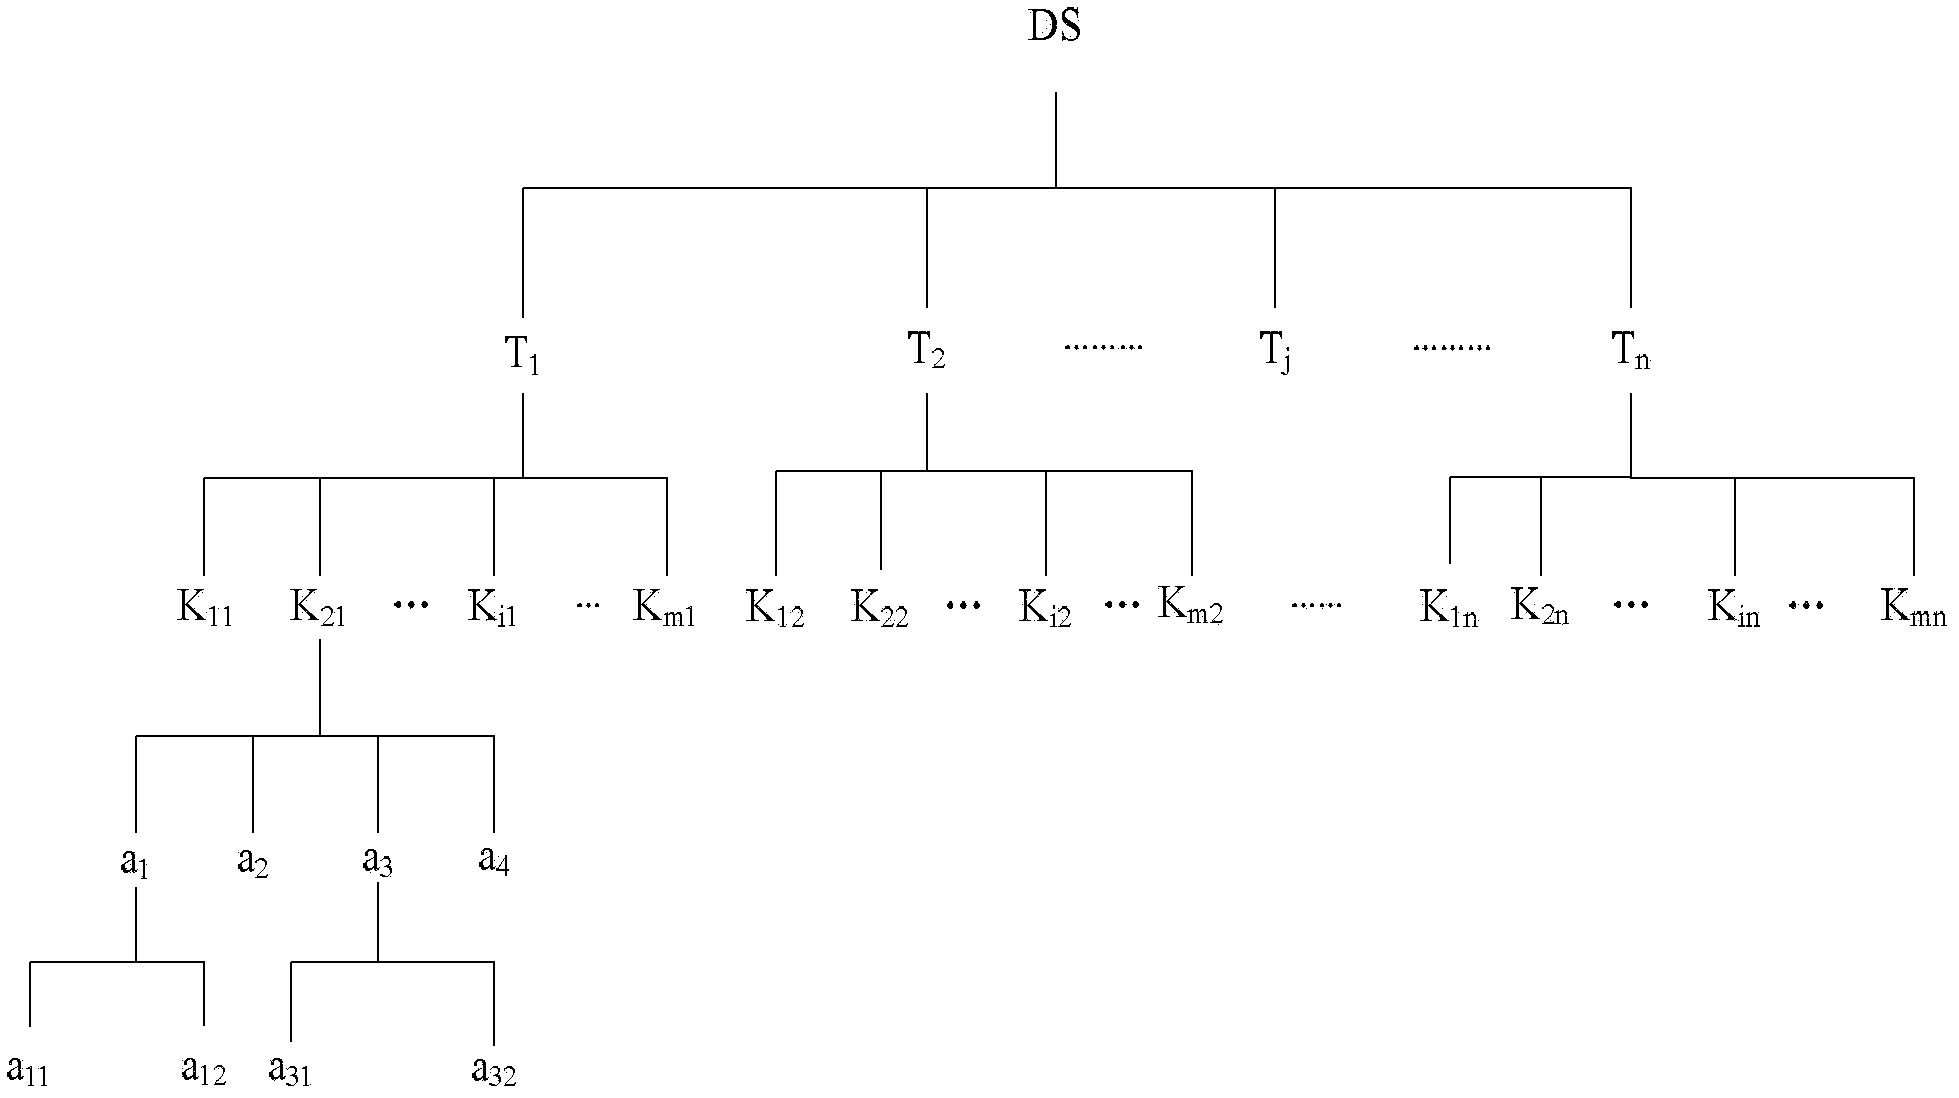
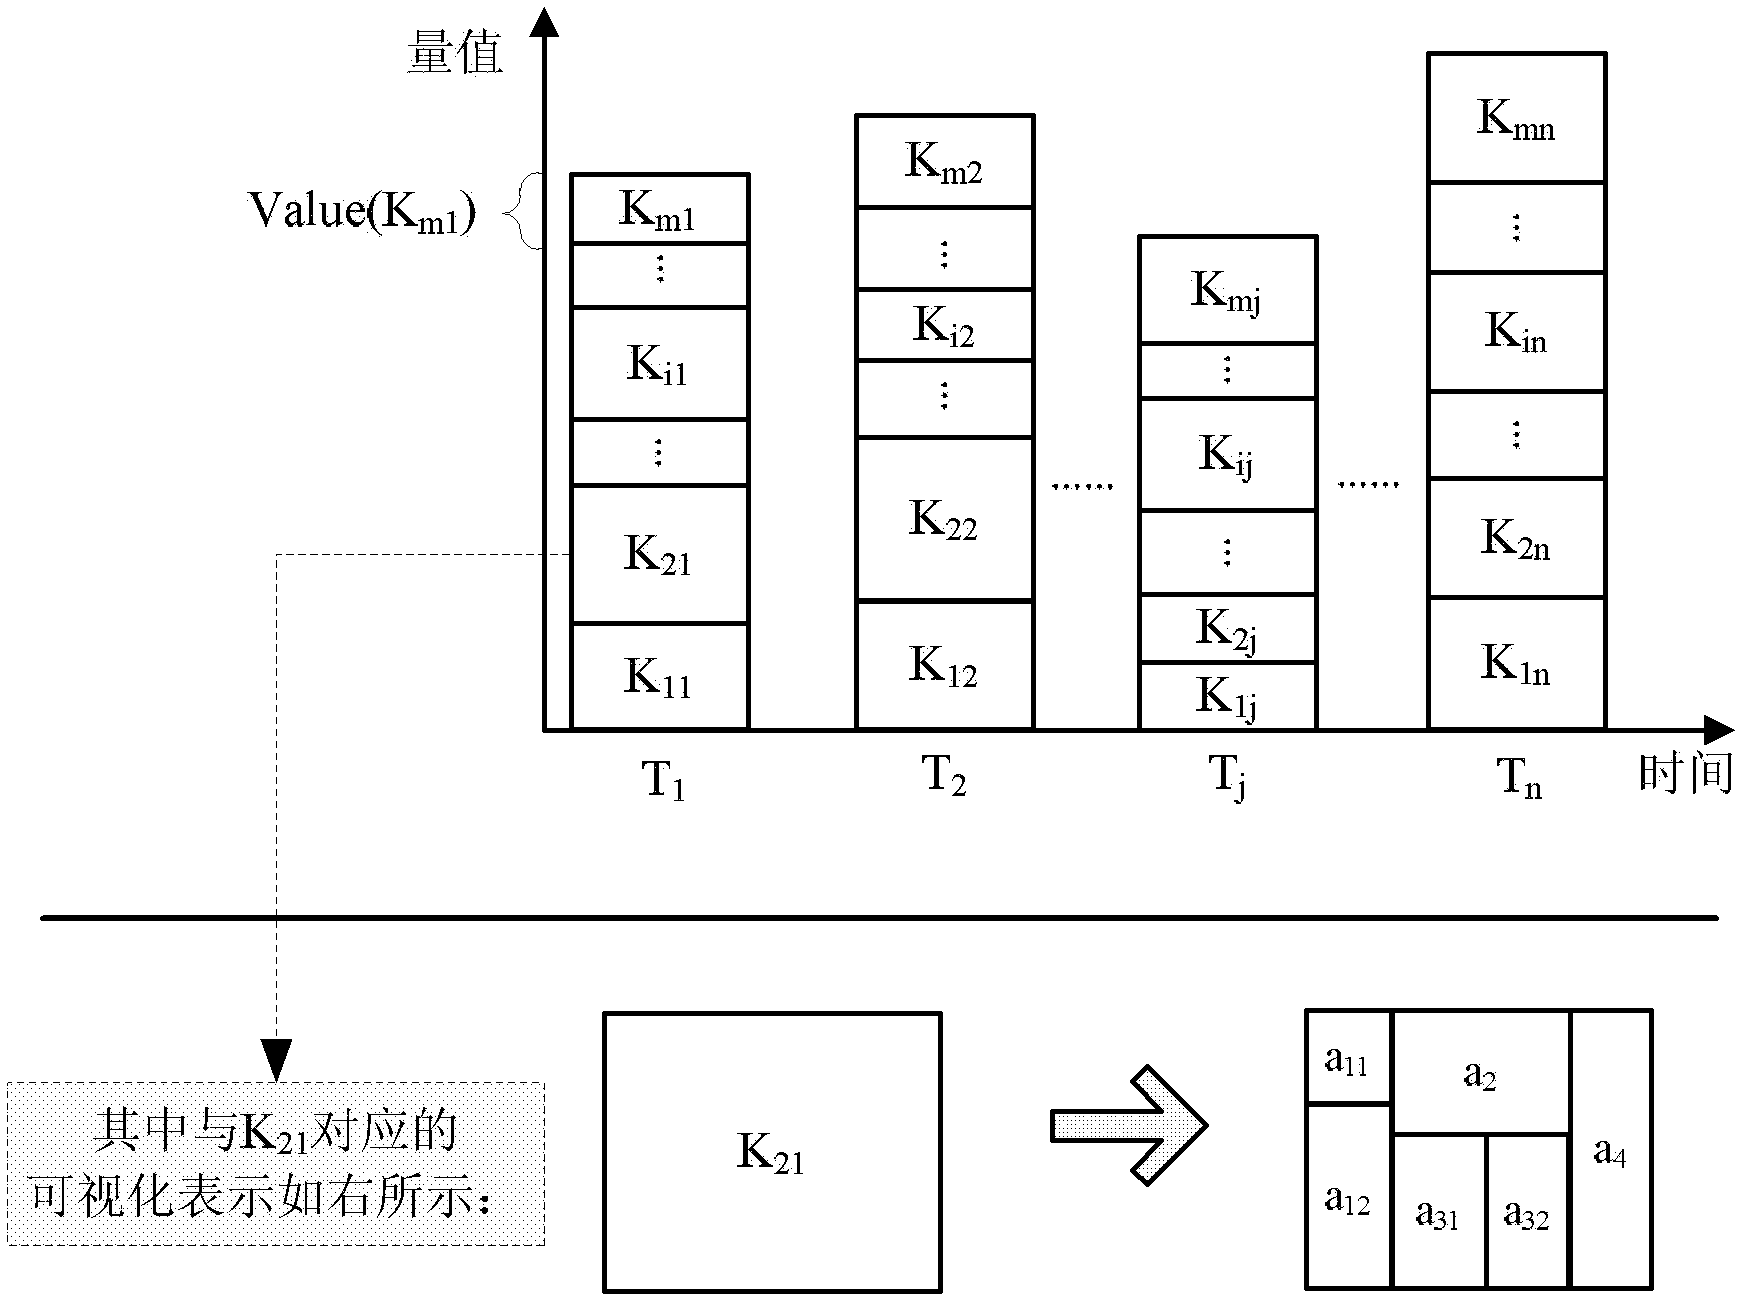
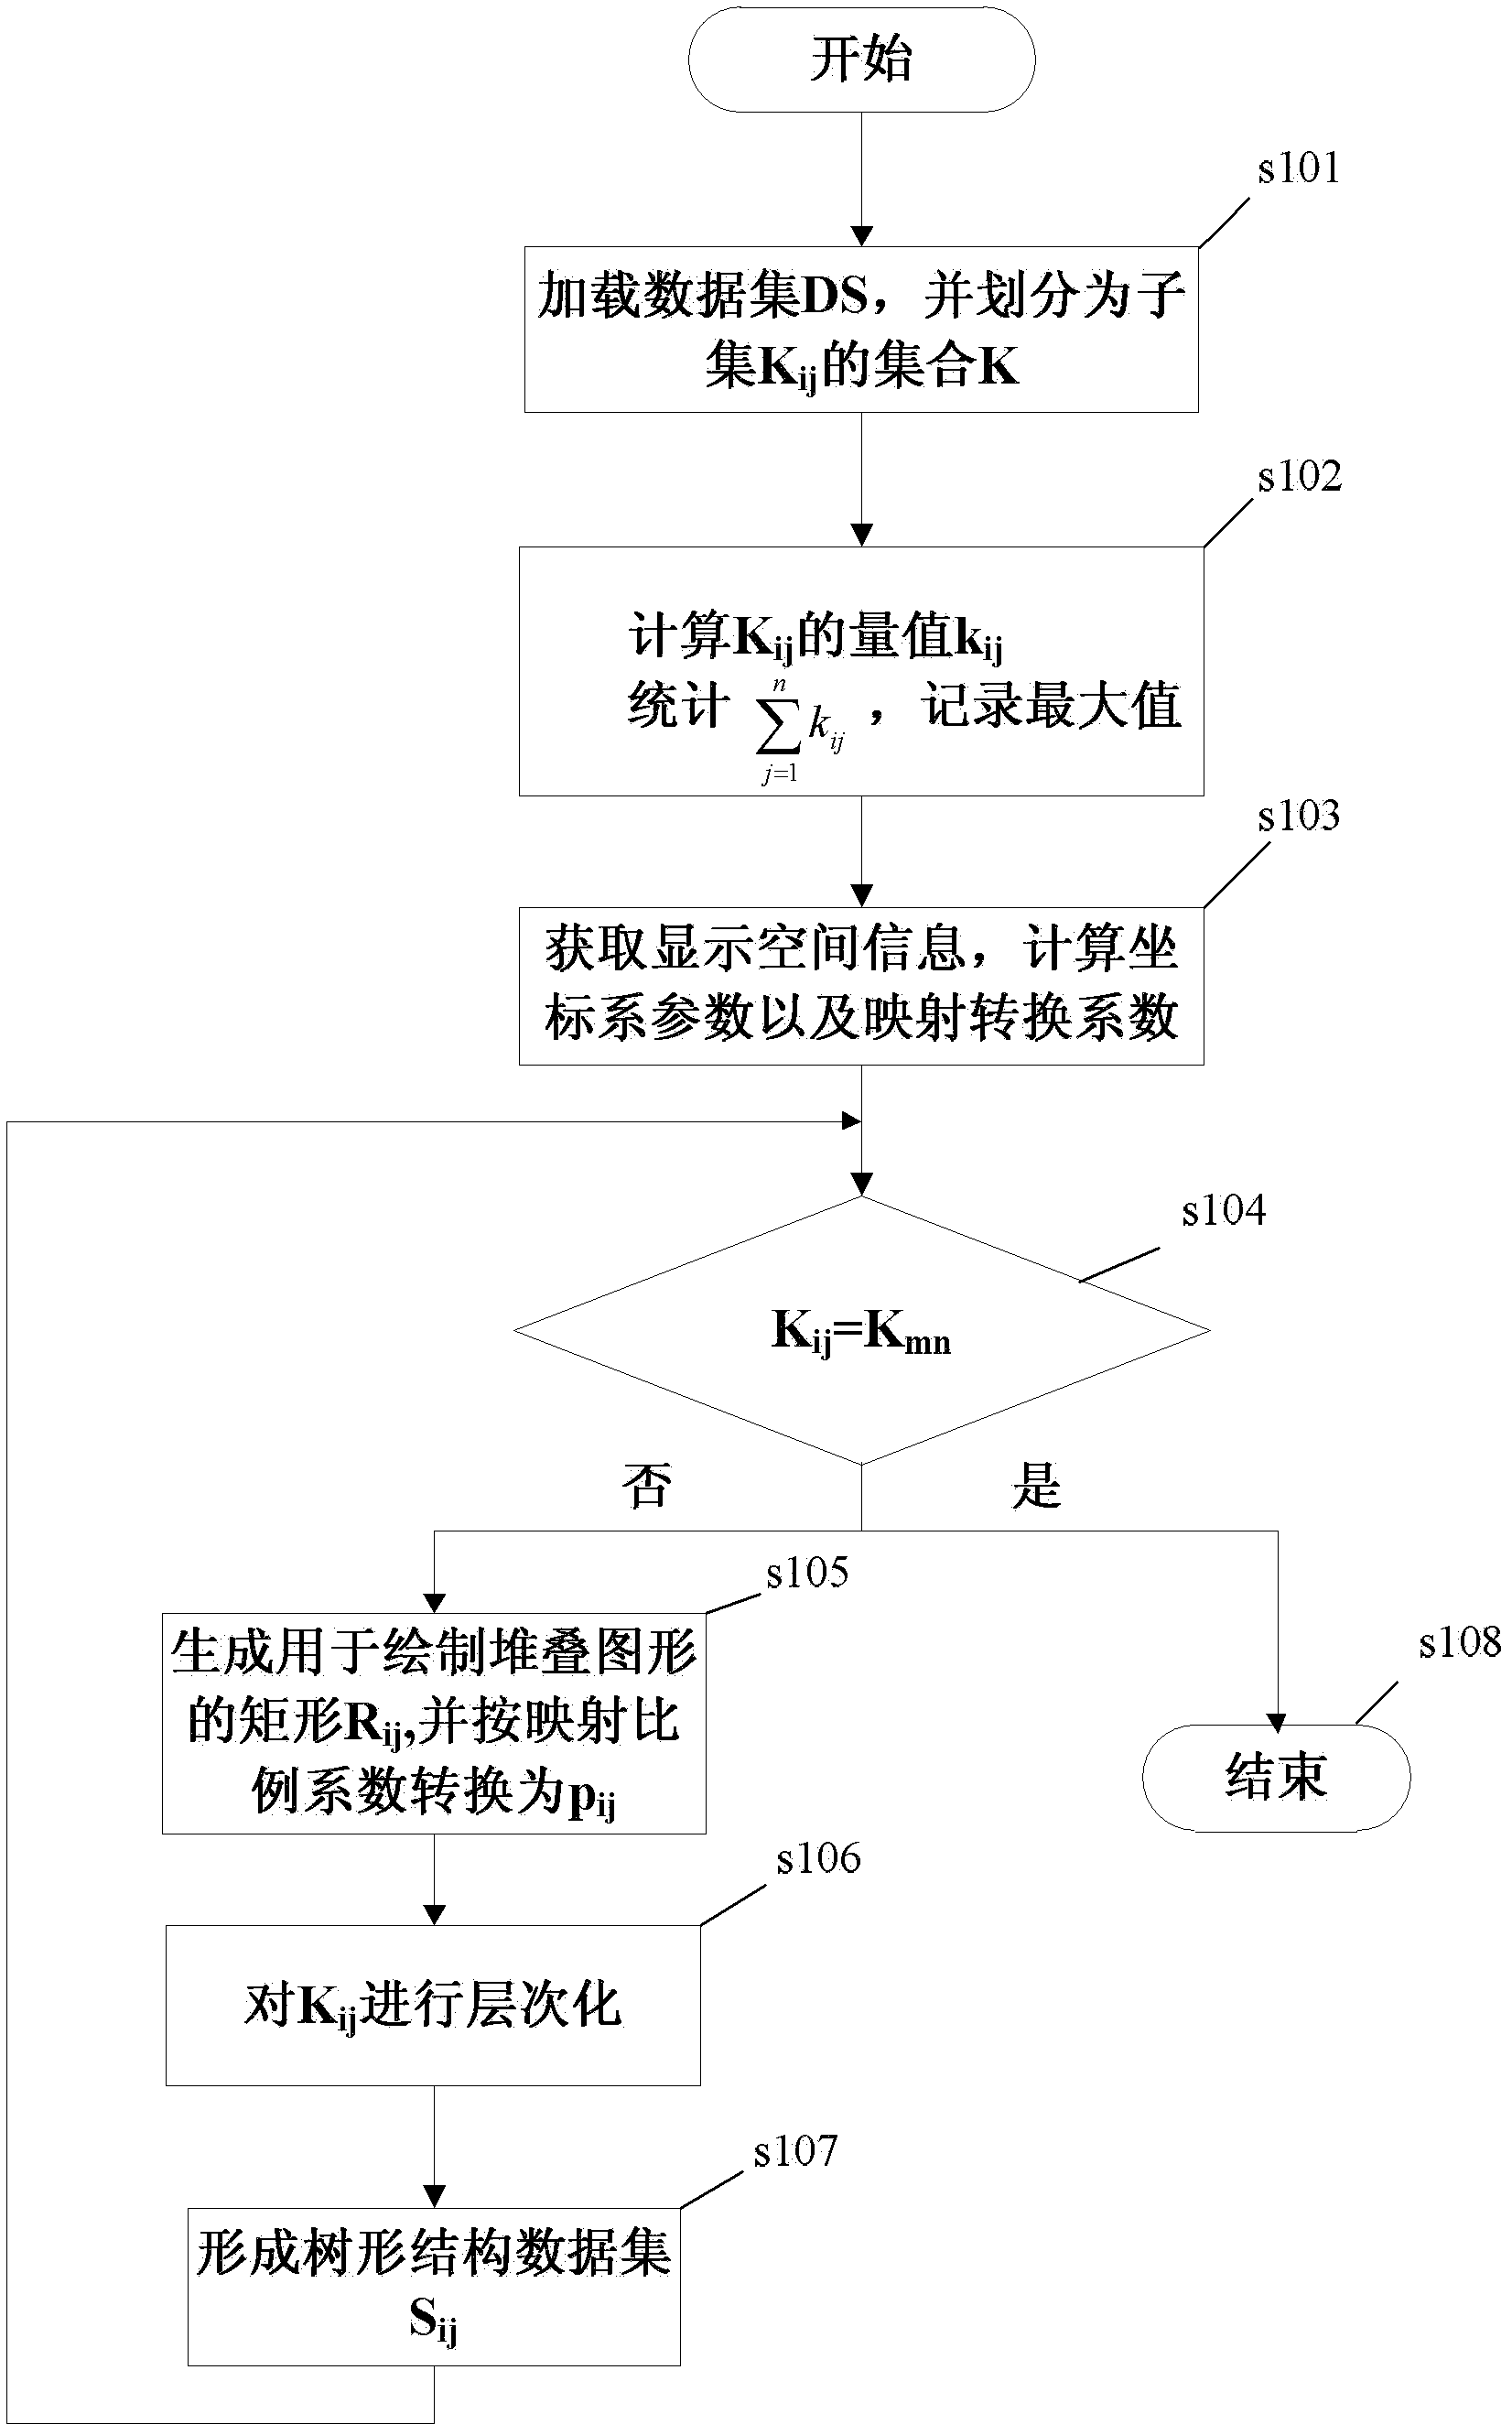
The invention discloses a complex data visualization method based on stacked tree graph. For a complex data set to be displayed, the contained data is provided with time attributes and hierarchical relationship, and the visualization processing for the data set comprises the following steps: hierarchical processing to the date set can be performed according to self time attributes and hierarchical relationship of the contained data, so as to generate a tree shaped data structure; the generated tree shaped data structure is reflected to be a stacked tree graph on a two dimensional surface; and the stacked tree graph is drawn and displayed on a display plane. The invention further provides the complex data visualization equipment so as to meet the using requirements of the method. The invention solves the problems that a conventional time sequence visualization method cannot present hierarchy attribute and the hierarchical data visualization method cannot carry out visualization to data with time continuous attributes, thereby achieving the purpose of presenting hierarchical structure and time attributes of data within a limited space to a great extend.

Description

technical field [0001] The invention belongs to the field of information visualization, and in particular relates to a method and equipment for visualizing a large amount of complex data. Background technique [0002] With the development of information technology, the amount of information in various fields is also increasing rapidly. For a large amount of information data, how to obtain the valuable content hidden in the data is a concern of people. Visualization technology is to display all kinds of non-intuitive and abstract data with the help of computer graphics and other related technologies, so as to provide help for people to interact with data and obtain information contained in data. In China's authorized patent 200810108432.9, IBM proposed a method and device for visualizing a large amount of information. This method can map information such as a tree structure or data table containing a large number of data points onto a virtual spherical surface, and then proj...

Claims


Application Information

Patent Timeline
Patent Type & Authority Applications(China)
IPC IPC(8): G06F17/30
CPCG06T11/206
Inventor 陈谊石晓坤贾艳杰
Owner BEIJING TECHNOLOGY AND BUSINESS UNIVERSITY
Why Eureka
Try Eureka