Frequency spectrograph waterfall plot display system and method

A display system and display method technology, applied in the field of spectrum measurement, can solve the problem of not being able to view frequency, amplitude and time at the same time

Inactive Publication Date: 2013-02-13
NANJING GUORUI ANTAIXIN TECH
View PDF4 Cites 14 Cited by
  • Summary
  • Abstract
  • Description
  • Claims
  • Application Information

AI Technical Summary

Problems solved by technology

The usual spectrum display interface is two-dimensional, which either displays the relationship between frequency and amplitude, or the relationship between time and amplitude, and cannot view the relationship between frequency, amplitude and time at the same time

Method used


Image

  • Frequency spectrograph waterfall plot display system and method
  • Frequency spectrograph waterfall plot display system and method
  • Frequency spectrograph waterfall plot display system and method

Examples


Embodiment Construction

[0032] The present invention will be described in further detail below.

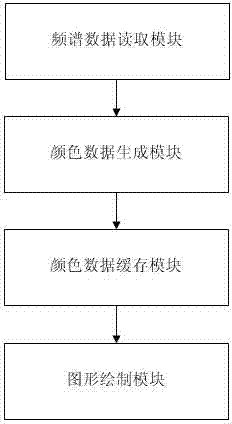
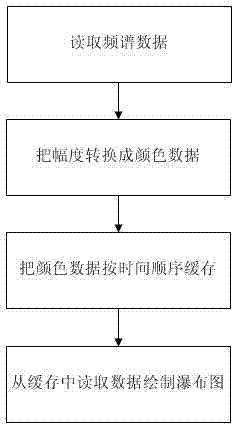
[0033] Such as figure 1 , figure 2 As shown, a spectrometer waterfall display system includes a spectrum data reading module, a color data generation module, a color data buffer module and a graphics drawing module;

[0034] The spectrum data reading module reads the swept spectrum data in real time,

[0035] The color data generation module converts the amplitude data into color data according to the predefined amplitude-color conversion ratio table,

[0036] The color data cache module caches the color data in chronological order,

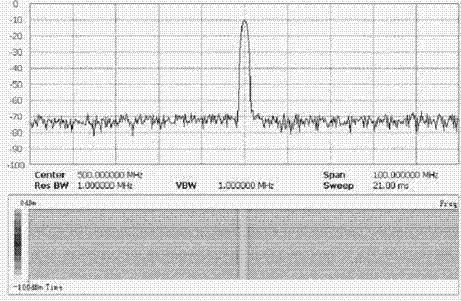
[0037] The graphics drawing module draws the data in the color data cache module on the display screen in the form of a waterfall diagram.

[0038] The described real-time reading of frequency sweep spectrum data is as follows: when each frequency sweep is completed, the sweep frequency spectrum data is read immediately, and an array is used to store the sweep frequenc...


PUM


Abstract

The invention relates to a frequency spectrograph waterfall plot display system and a frequency spectrograph waterfall plot display method. The frequency spectrograph waterfall plot display system comprises a frequency spectrum data reading module, a color data generating module, a color data caching module and a graphics drawing module, wherein the frequency spectrum data reading module reads the frequency sweep frequency spectrum data in real time; the color data generating module converts amplitude data into color data according to a predefined amplitude-color conversion ratio table; the color data caching module caches the color data according to a time sequence; and the graphics drawing module draws the data in the color data caching module to a display screen in a waterfall plot form. According to the waterfall plot method, the defect that the relationship among the signal frequency, the amplitude and the time cannot be simultaneously displayed under the same interface in a common spectral analysis interface can be overcome.

Description

technical field [0001] The invention relates to the field of spectrum measurement, in particular to a spectrogram display system and method. Background technique [0002] When performing spectrum measurement, sometimes it is necessary to view the relationship between the frequency and amplitude of the signal as a function of time. The usual spectrum display interface is two-dimensional, which either displays the relationship between frequency and amplitude, or the relationship between time and amplitude, and cannot view the relationship between frequency, amplitude and time at the same time. Contents of the invention [0003] Technical problem to be solved: In view of the above problems, the present invention provides a spectrometer waterfall diagram display system and method that can simultaneously display the relationship among signal frequency, amplitude and time in one interface. [0004] Technical solution: In view of the above deficiencies, the present invention pro...

Claims


Application Information

Patent Timeline
Patent Type & Authority Applications(China)
IPC IPC(8): G01R13/00G01R23/16
Inventor 钟景华谭小骏
Owner NANJING GUORUI ANTAIXIN TECH
Why Eureka
Try Eureka