

Method for inserting filling graphs in map
A graphics and layout technology, applied in special data processing applications, instruments, electrical digital data processing, etc., can solve problems such as heavy workload and long time
- Summary
- Abstract
- Description
- Claims
- Application Information
AI Technical Summary
Problems solved by technology
Method used
Image

Examples
Embodiment Construction
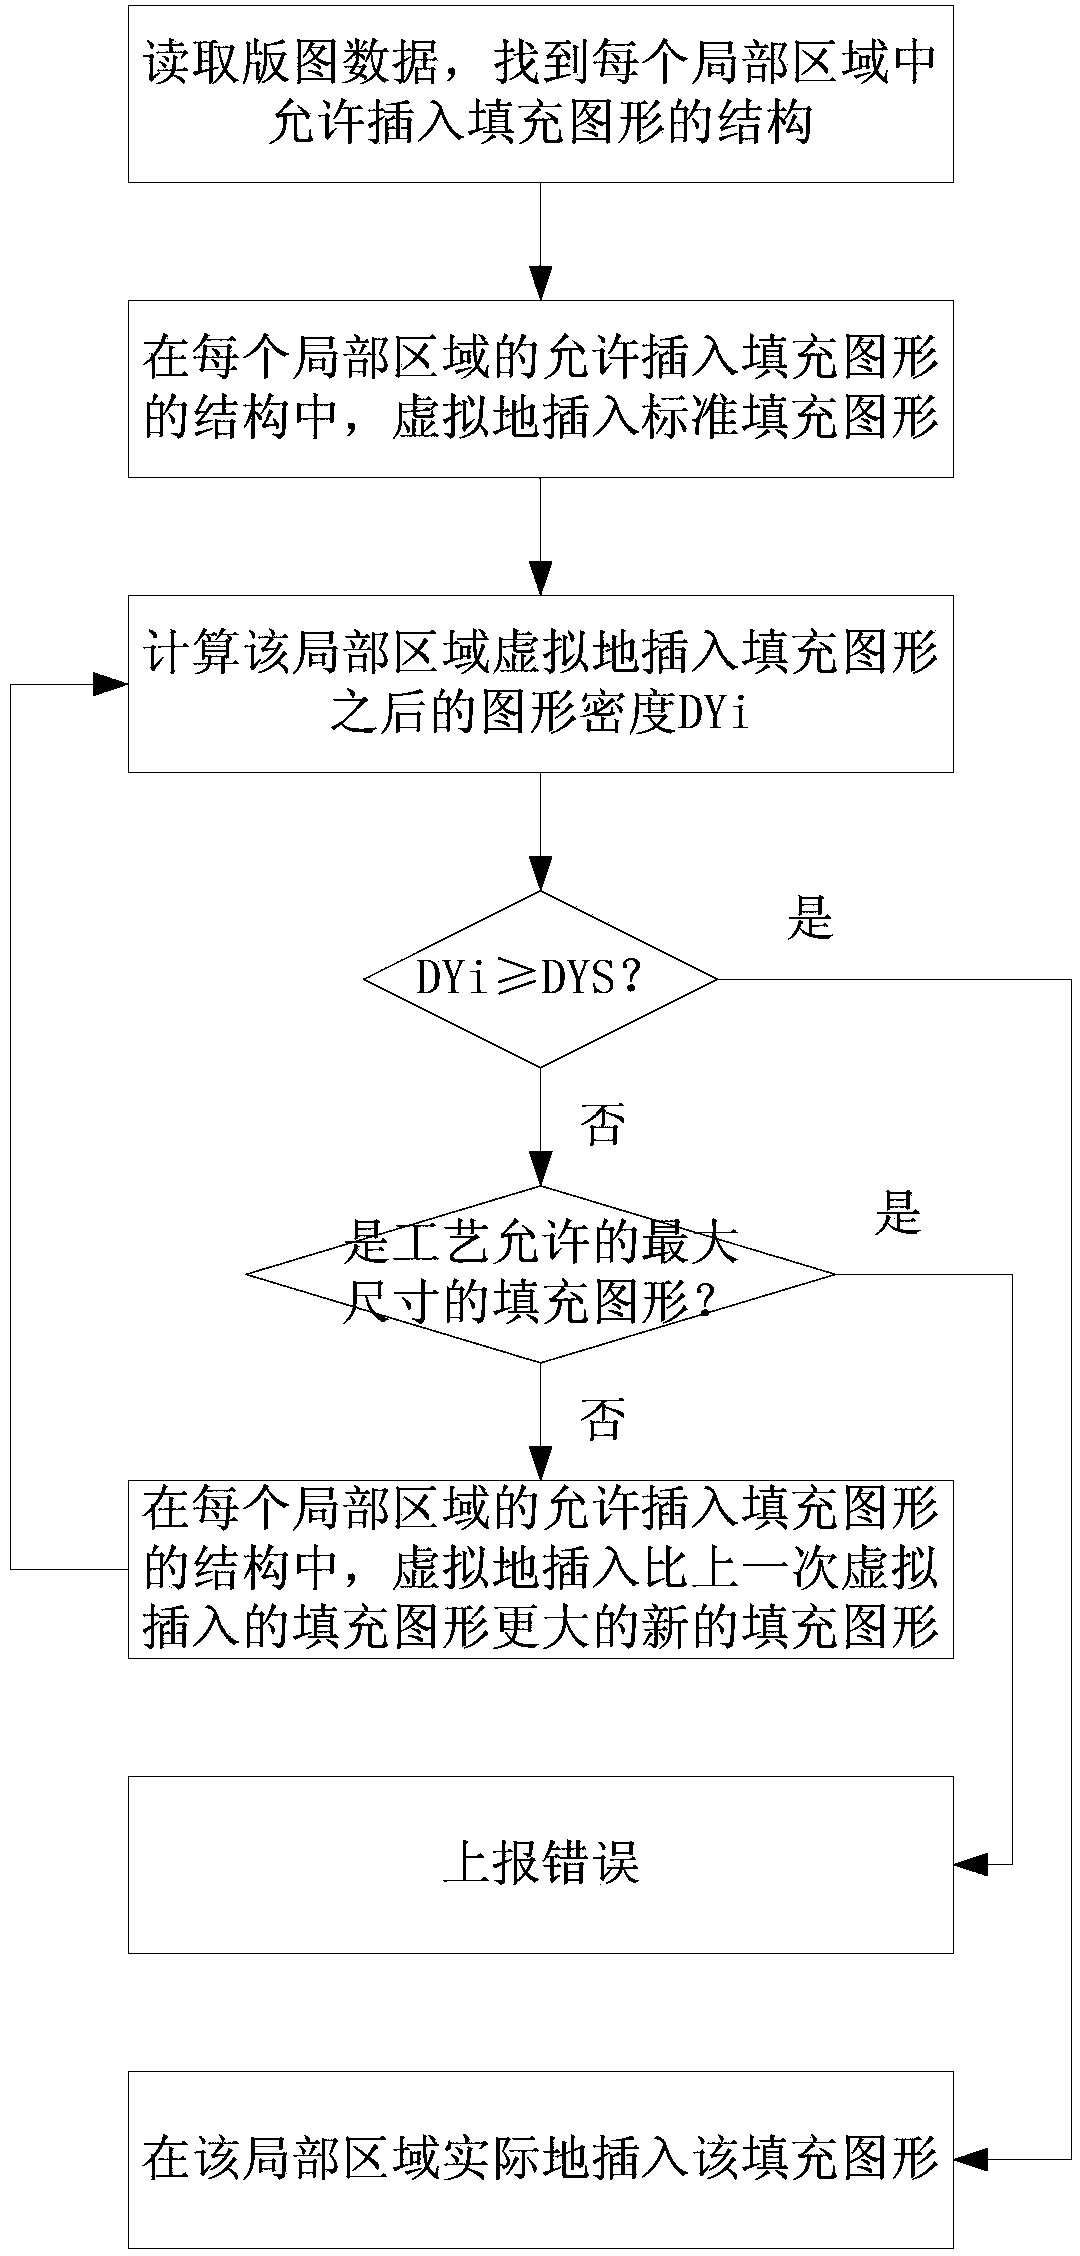
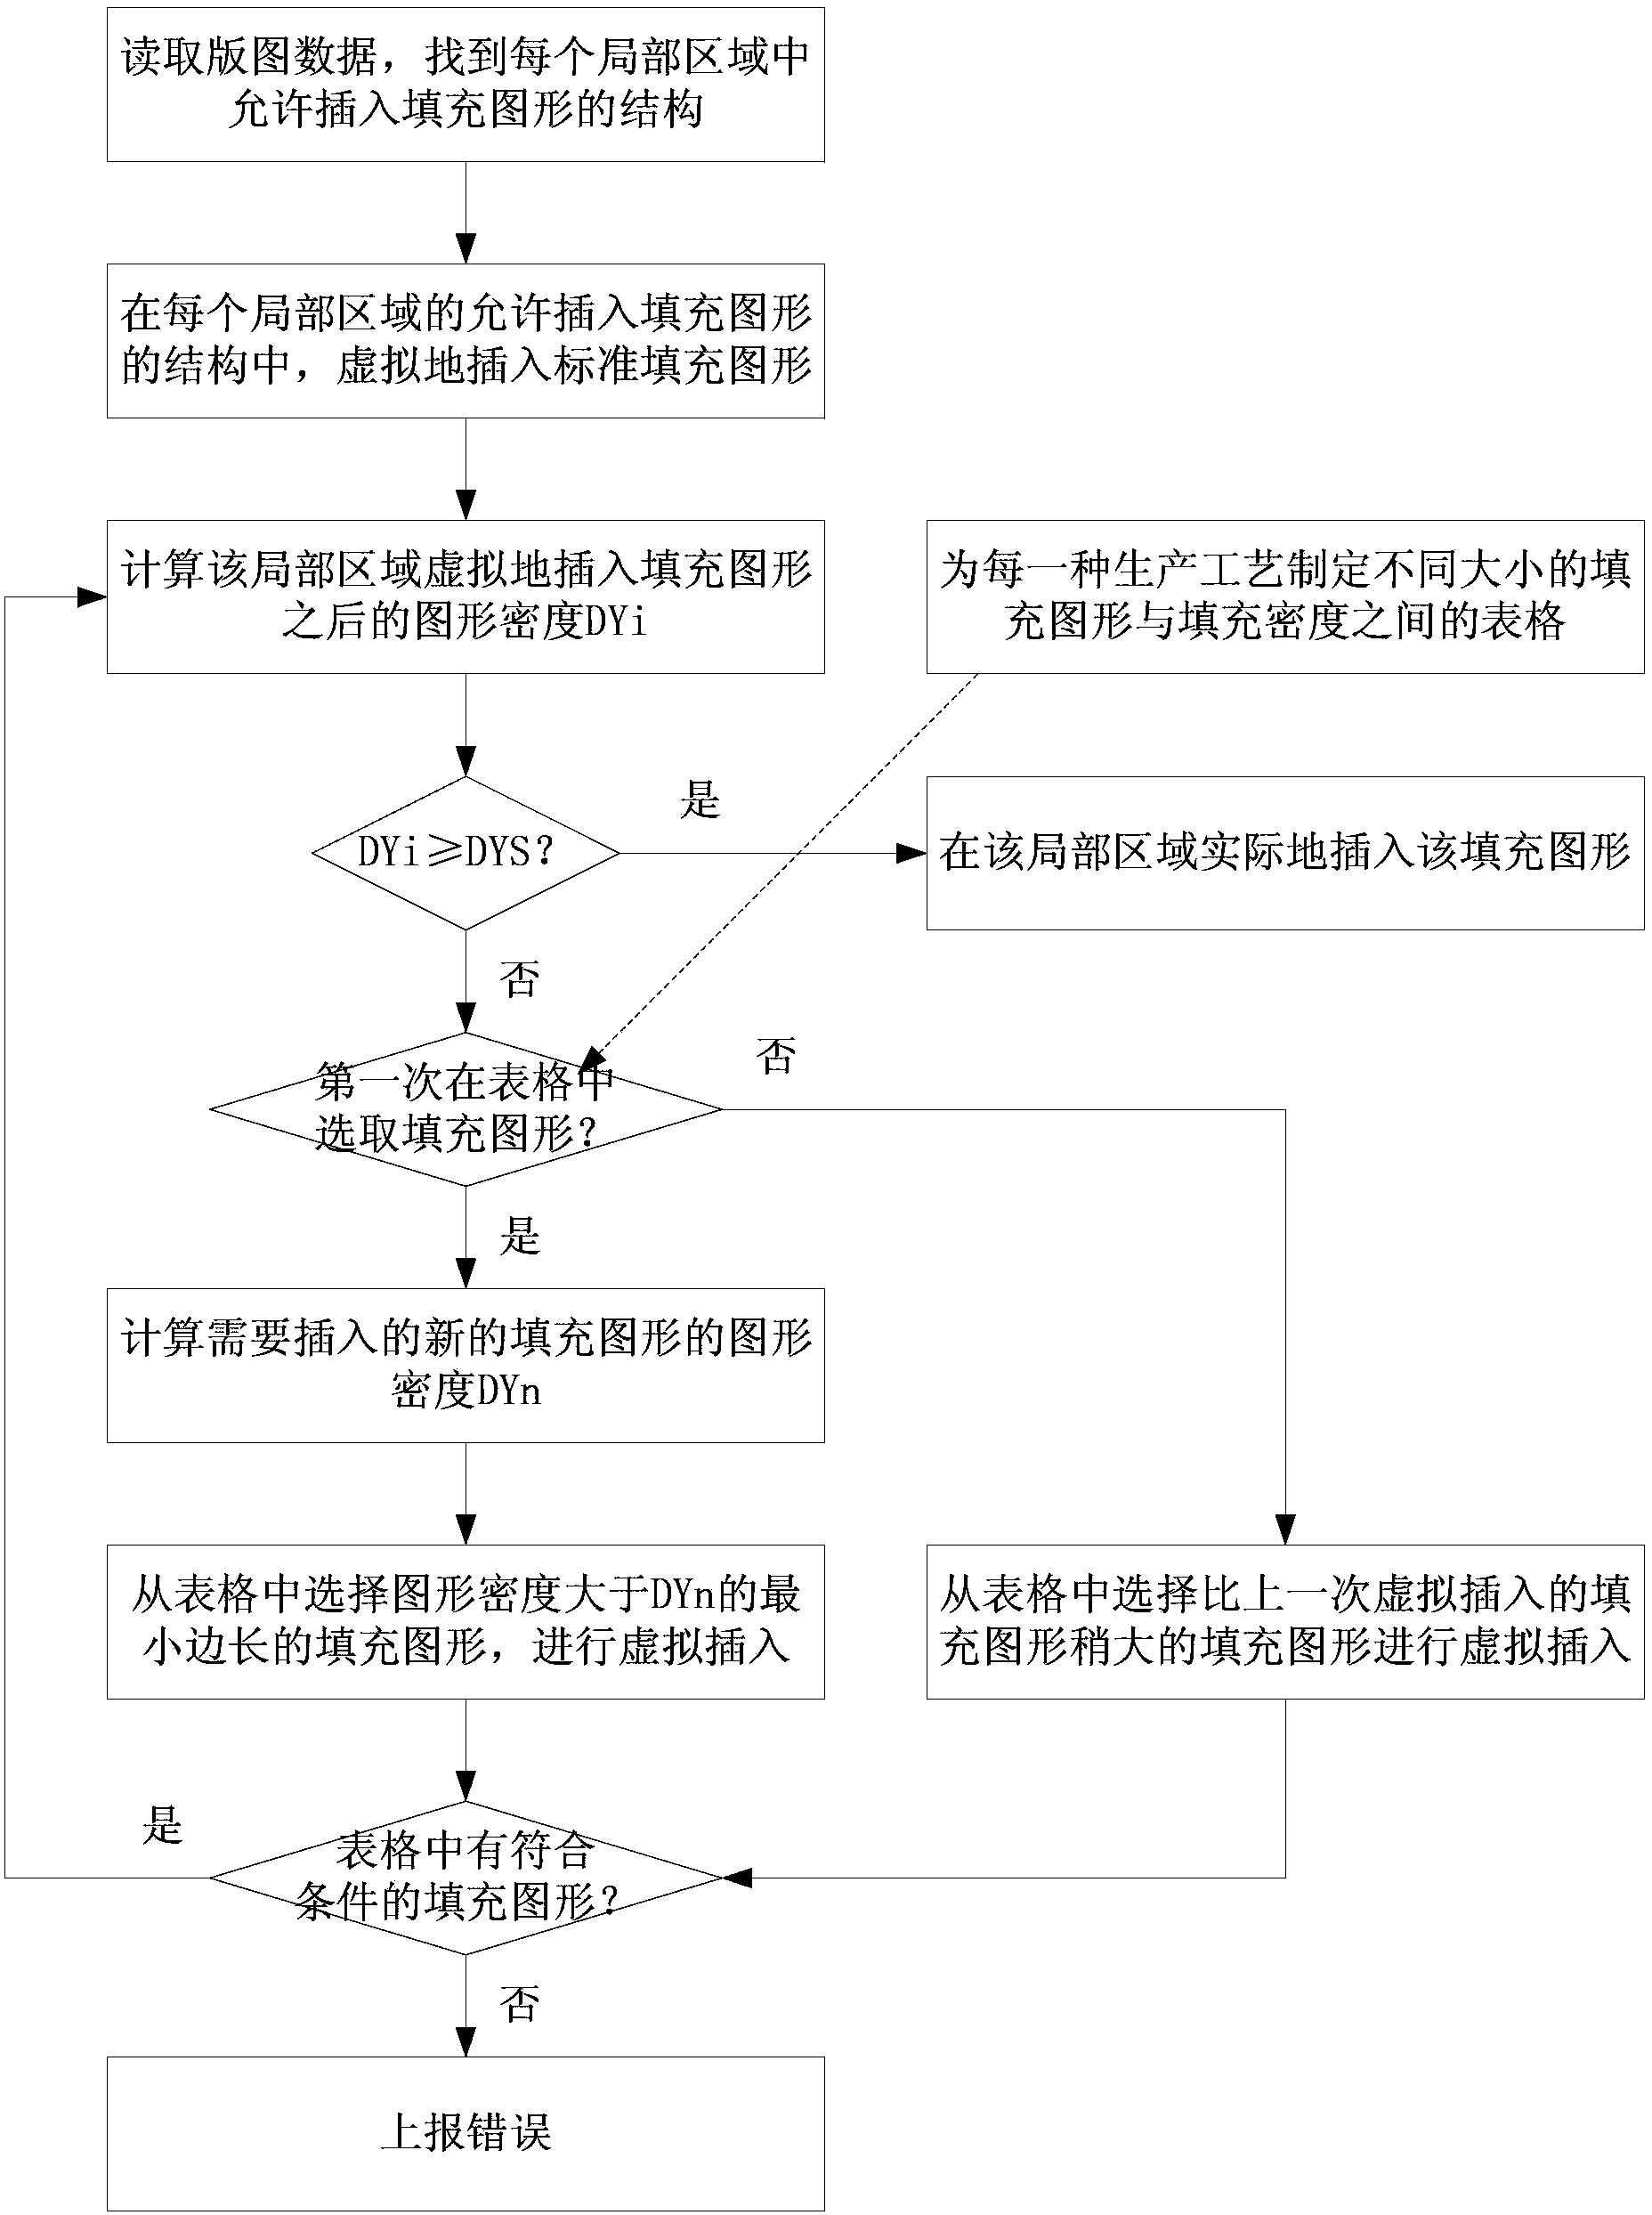
[0024] see figure 1 , the method for inserting filling graphics in the layout of the present application includes the following steps:
[0025] The first step is to read the layout data, for example, read the layout data in GDSII format in binary mode. Different manufacturing processes define the number of local regions included in a layout, and the size of each local region. According to the layout data, the structures that allow the insertion of filling patterns in each local area are found.
[0026] There are many layers on a silicon wafer manufactured with semiconductor devices, and it is only a small part of the layers that need to insert filling patterns to meet the requirements of the CMP process. For this small portion of the hierarchy, process rules determine which blanks allow the insertion of fill graphics and which blanks do not. As for other levels, some levels are forbidden to insert filling graphics of other levels. Through the calculation of the entire lay...
PUM
 Abstract
Description
Claims
Application Information