Well-to-well tracing curve clustering method and device

A cluster analysis and curve technology, which is applied in special data processing applications, instruments, electrical digital data processing, etc. question

Inactive Publication Date: 2014-11-26
SOUTHWEST PETROLEUM UNIV
View PDF2 Cites 7 Cited by
  • Summary
  • Abstract
  • Description
  • Claims
  • Application Information

AI Technical Summary

Problems solved by technology

Most of the currently used curve shape similarity measurement methods are based on Euclidean distance, which has the following defects: (1) does not have the ability to recognize shapes; (2) cannot effectively reflect the similarity of dynamic trends
[0008] like image 3 For the three curves A, B, and C shown, the morphological changes of A and B are opposite, and the morphological change trend of C is the same, but based on the calculation of the Euclidean distance, it will be considered that the similarity of A and B is greater than that of A and C; (3) Does not recognize pattern changes in time series at different resolutions

Method used


Image

  • Well-to-well tracing curve clustering method and device
  • Well-to-well tracing curve clustering method and device
  • Well-to-well tracing curve clustering method and device

Examples


specific example 1

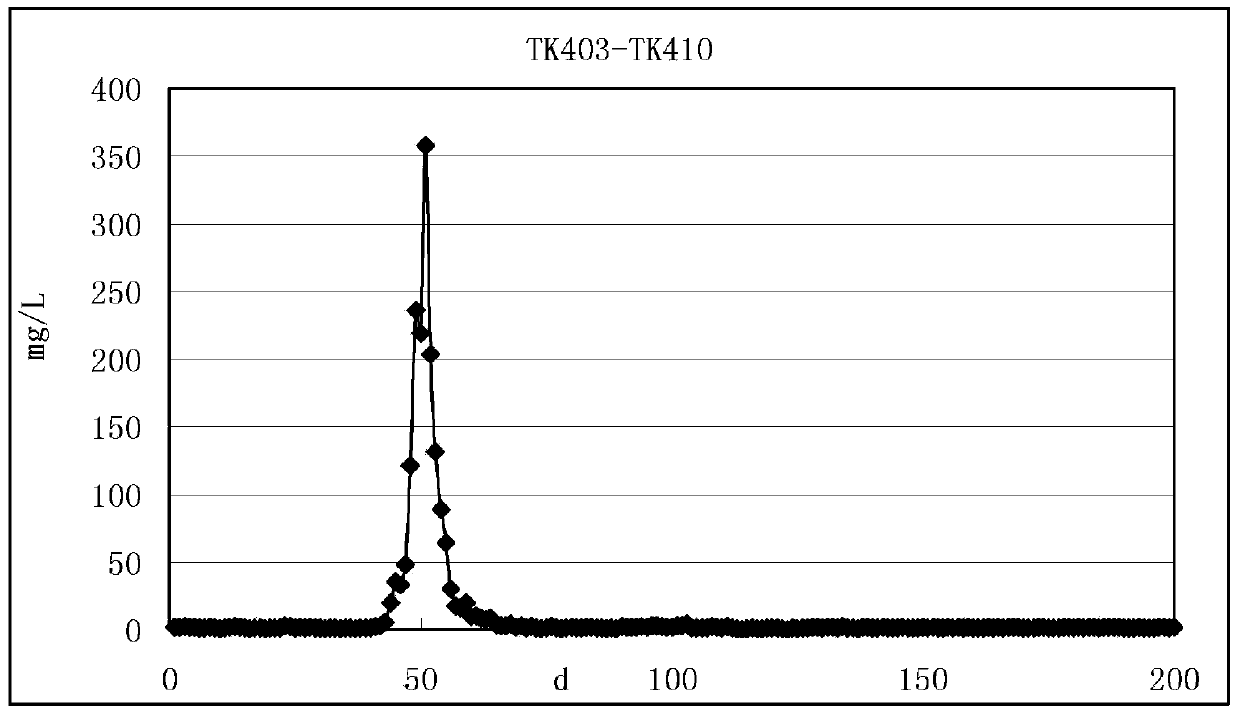
[0091] Specific example 1: Taking TK426CH well as the injection well and TK468CH well as the production well, it was monitored that the tracer breakthrough time in TK468CH well was 24 days ( Figure 6 Point A in the monitoring), the output concentration reached the peak on the 43rd day of monitoring, and the tracer concentration of the production fluid was monitored to return to the background concentration of 0.0018 mg / L ( Figure 6 Point B in ), the curve segment between A and B indicates that the monitored concentration of the tracer increases from the background concentration to the peak value after the breakthrough of the production well TK468CH and then returns to the background concentration.

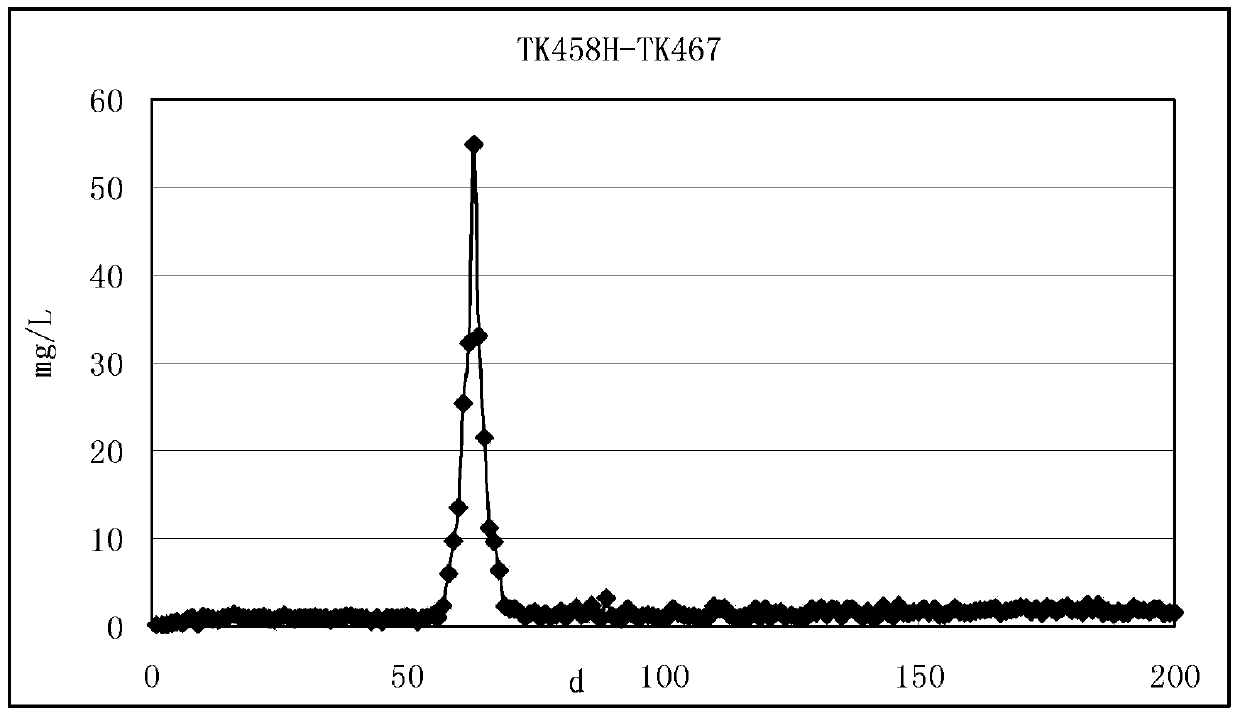
[0092] The entire monitoring process lasted for 200 days, and a total of 200 samples were taken. The results are as follows: Figure 7-9 As shown, among them, Figure 7 The A-B segment on the middle curve corresponds to Figure 6 Section A~B above; Figure 8 is the measured cu...

specific example 2

[0093] Specific example 2: Taking well TK221 as the injection well and well TK214 as the production well, it was monitored that the tracer breakthrough time in well TK221 was 29 days ( Figure 10 Point A in ), there are two peaks in the curve, and the output concentration reaches the peak on the 36th and 71d of monitoring, and the tracer concentration of the output fluid returns to the background concentration of 0.0012mg / L ( Figure 10 Point B in ), the curve segment between A and B indicates that two concentration peaks were detected after the tracer broke through in the production well TK221. The whole monitoring process lasted 114 days, and a total of 114 samples were taken. Such as Figures 11 to 13 As shown, among them, Figure 11 Corresponding to section A~B on the curve Figure 8 Section A~B above; Figure 13 The origin of the curve corresponds to Figure 12 Point A, the end point corresponds to Figure 12 point B.

[0094] Through the above transformation, the m...

example

[0106] Example: such as Figure 9 The shown TK426CH-TK468CH dimensionless accumulative mass curve contains 50 points, so the time series length L=50. The curve is divided into n=5 approximate straight line segments, then the piecewise linearization model S is expressed as: S={(y 1S ,y 1E ,10),(y 2S ,y 2E ,20),...,(y iS ,y iE ,t i ),...(y 10S ,y 10E ,50)}, the pattern distinguishing threshold value is th=0.1. The first segment is expressed as (y 11 ,y 15 , 10), using seven-element sets to describe the curve shape of each segment, can be divided into {gentle rise, keep rising, fast rise, keep rising, gentle rise}, the corresponding M={1, 2, 3, 2, 1 }, then the overall shape of the curve can be expressed as S ^ = { ( 1,10 ) , ( 2,20 ) , ( 3,30 ) ,...


PUM


Abstract

The invention provides a well-to-well tracing curve clustering method and device. The method includes the steps that after standardization treatment, curve piecewise linearization treatment, non-dimensional tracing-curve-to-tracing-curve form distance calculation and automatic well-to-well non-dimensional tracing curve clustering algorithm treatment are conducted on testing data, automatic well-to-well tracing curve clustering calculation and analysis are achieved, and finally analysis of newly-tested tracing curves is achieved. On the basis of the method, the invention further provides the well-to-well tracing curve clustering device corresponding to the method, standardization treatment is conducted on the complex tracing curves, and scientific and quick analysis of mass well-to-well tracing curves is achieved, so that a specific technological means for classification research on the mass well-to-well tracing curves is provided, and the explanation level of the well-to-well tracing curves is increased.

Description

technical field [0001] The invention belongs to the technical field of oil well detection, and in particular relates to a method and a device for cluster analysis of tracer curves between wells. Background technique [0002] Interwell tracer test technology is one of the effective means to understand the connectivity between wells in reservoirs, and interwell tracer curves are obtained through tracer tests. The tracer curves between wells can be divided into two types: one is the concentration-time relationship curve reflecting the change of tracer output concentration during the monitoring process; the other is the cumulative output mass-time curve reflecting the change of tracer output quality during the monitoring process. Relationship curve (referred to as cumulative production quality curve). At present, the on-site interpreters pay most attention to the concentration-time relationship curve. For a large number of tracer curves tested in the field, only when the absol...

Claims


Application Information

Patent Timeline
IPC IPC(8): G06F19/00
Inventor 荣元帅李科星赵金洲金发扬
Owner SOUTHWEST PETROLEUM UNIV
Why Eureka
Try Eureka