Three-dimensional three-component submarine cable seismic data speed modeling method
A submarine cable and seismic data technology, applied in seismology, seismic signal processing, measuring devices, etc., can solve the problems of large gather errors, multi-person computer interaction, and affecting the accuracy of velocity models, so as to reduce the impact and improve processing efficiency , The effect of saving labor costs
- Summary
- Abstract
- Description
- Claims
- Application Information
AI Technical Summary
Problems solved by technology
Method used
Image

Examples
Embodiment 1
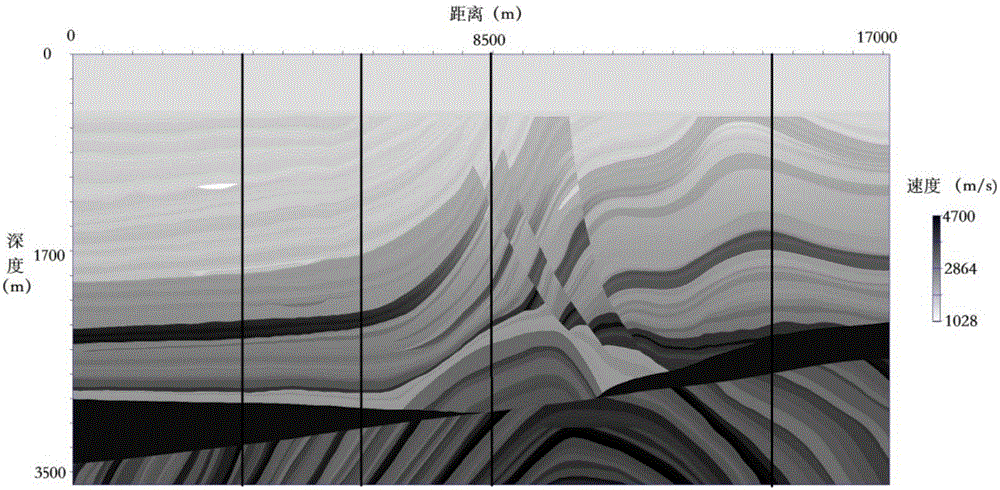
[0087] Such as image 3Shown is the Marmousi-II (Mamosi II) compressional wave velocity model, which has a complex structure, complex lithology, and is filled with various fluids. It is an international classic model for verifying velocity modeling and migration imaging algorithms. Use the method of the present invention to carry out migration velocity scanning to the Marmousi-II longitudinal wave simulation data, form the longitudinal wave velocity spectrum, wherein the corresponding velocity spectrum at the black line place in the model is as Figure 4 shown. Based on the P-wave velocity spectrum, the velocity-time pair is picked up and interpolated to form the Marmousi-II P-wave velocity model, as shown in Figure 5 shown. Such as Figure 6 As shown in (a) and (b), the true velocity model and the Marmousi-II P-wave velocity model are used for migration imaging respectively, where Figure 6 (a) is the migration imaging result of the true velocity model, Figure 6 (b) is...
Embodiment 2
[0089] Such as Figure 7 As shown, it is a simple layered model artificially constructed. The shallow part of the model is four horizontal reflection coefficient surfaces, and the deep layer is a concave reflection coefficient surface. The longitudinal wave velocity in the entire model range is 5000m / s, and the shear wave velocity is 2500m / s. s. Based on this, a set of P-wave data and a set of converted-wave data were respectively simulated through specific methods.
[0090] Such as Figure 8 (a), (b), and (c), from left to right are the P-wave velocity spectrum, S-wave velocity spectrum, and P-to-shear velocity ratio spectrum formed by using the pre-stack time migration velocity scan of the present invention. By picking up the velocity, the P-wave and S-wave velocity models and the P-to-S wave velocity ratio model are formed. Such as Figure 9 As shown in (a) and (b), the real velocity model and the model established by the method of the present invention are used for mig...
Embodiment 3
[0092] As shown in Fig. 10 (a), (b) and (c), the P-wave velocity, S-wave velocity and P-to-shear velocity ratio model are established for a certain offshore three-dimensional three-component OBC data using the method of the present invention respectively. Using the established model to perform pre-stack time migration imaging on OBC data, the results are as follows Figure 11 As shown in (b); at the same time, a well-known international commercial software is used to carry out velocity modeling and migration imaging on the same data, and the obtained results are as follows Figure 11 (a) shown. It can be seen that the event of imaging using the method of the present invention is clear and the fault is clear, which illustrates the effectiveness and practicability of the present invention to actual OBC converted wave data; it can be found by comparison that the results of the present invention are slightly better than those of commercial software, mainly Reflected in the middle...
PUM
 Abstract
Description
Claims
Application Information
 - R&D
- Intellectual Property
- Life Sciences
- Materials
- Tech Scout
- Unparalleled Data Quality
- Higher Quality Content
- 60% Fewer Hallucinations
Browse by: Latest US Patents, China's latest patents, Technical Efficacy Thesaurus, Application Domain, Technology Topic, Popular Technical Reports.
© 2025 PatSnap. All rights reserved.Legal|Privacy policy|Modern Slavery Act Transparency Statement|Sitemap|About US| Contact US: help@patsnap.com