Chart display method and apparatus

A chart and pie chart technology, applied in the field of data processing, can solve problems such as low user experience, and achieve the effect of improving interpretation efficiency and user experience.

Active Publication Date: 2017-05-10
BEIJING GRIDSUM TECH CO LTD
View PDF4 Cites 6 Cited by
  • Summary
  • Abstract
  • Description
  • Claims
  • Application Information

AI Technical Summary

Problems solved by technology
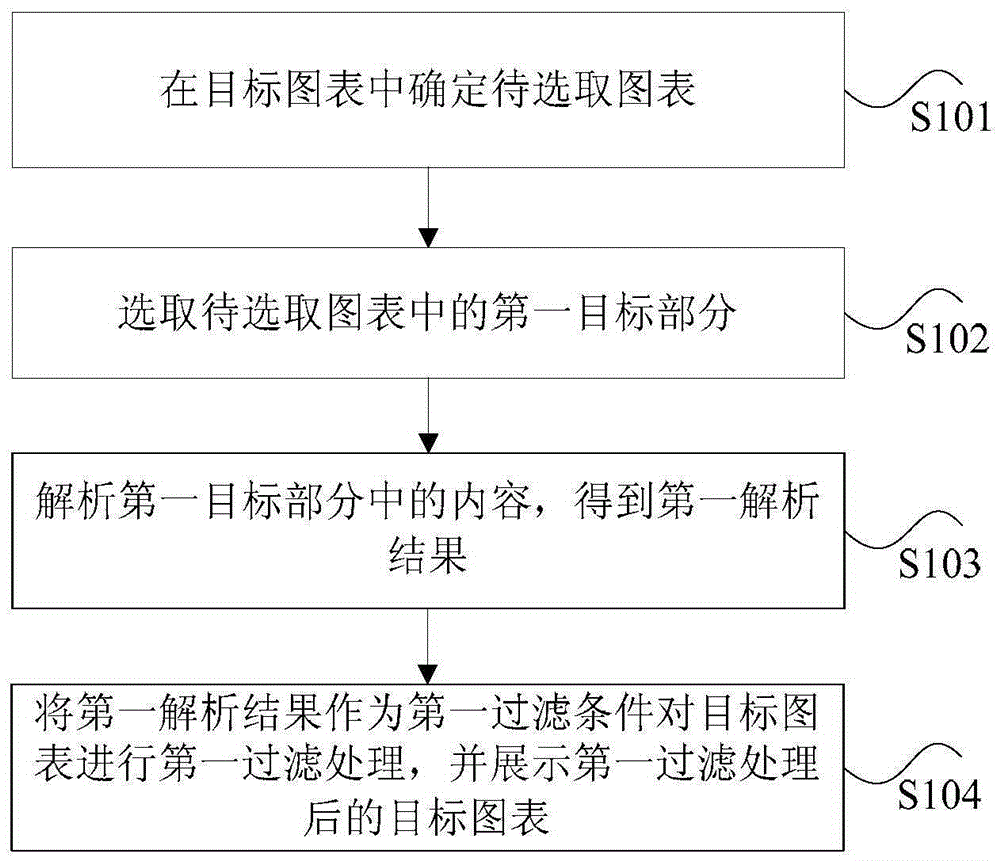
[0005] The main purpose of this application is to provide a method and device for displaying charts to solve the problem of low user experience in the related art when operating charts on the interface

Method used


Image

  • Chart display method and apparatus
  • Chart display method and apparatus
  • Chart display method and apparatus

Examples


Embodiment Construction

[0029] It should be noted that, in the case of no conflict, the embodiments in the present application and the features in the embodiments can be combined with each other. The present application will be described in detail below with reference to the accompanying drawings and embodiments.

[0030] In order to enable those skilled in the art to better understand the solution of the present application, the technical solution in the embodiment of the application will be clearly and completely described below in conjunction with the accompanying drawings in the embodiment of the application. Obviously, the described embodiment is only It is an embodiment of a part of the application, but not all of the embodiments. Based on the embodiments in this application, all other embodiments obtained by persons of ordinary skill in the art without creative efforts shall fall within the scope of protection of this application.

[0031] It should be noted that the terms "first" and "second...


PUM


Abstract

The invention discloses a chart display method and apparatus. The method comprises the steps of determining a to-be-selected chart in target charts, wherein the target charts include the to-be-selected chart and associated charts, and the associated charts are charts associated with the to-be-selected chart; selecting a first target part in the to-be-selected chart; analyzing contents in the first target part to obtain a first analysis result; and performing first filtration processing on the target charts by taking the first analysis result as a first filtration condition, and displaying the target charts subjected to the first filtration processing. Through the method and the apparatus, the problem of relatively poor user experience during operation of charts on interfaces in related technologies is solved.

Description

technical field [0001] The present application relates to the field of data processing, and in particular, to a method and device for displaying charts. Background technique [0002] In recent years, users have paid more and more attention to "visualization". For general-purpose visualization products, in addition to visual presentation, integration and cleaning of raw data, the friendliness of the interface is also an important aspect that needs to be considered. Nowadays, more and more users are beginning to put forward requirements for product experience. In order to improve user experience, make it easier for users to interpret the relationship between various parts of the interface, and obtain relevant data quickly and efficiently, it is necessary to configure the settings between different charts. linkage. At present, research on "linkage" in related technologies mainly focuses on the following five aspects: 1. Linkage between hardware equipment and data, the core of...

Claims


Application Information

Patent Timeline
Patent Type & Authority Applications(China)
IPC IPC(8): G06F17/30
Inventor 李梦溪
Owner BEIJING GRIDSUM TECH CO LTD
Why Eureka
Try Eureka