Dynamic scheduling and rendering method of voluminous web-end television-network resource GIS data

A technology of data dynamics and power grid, applied in the field of electric power geographic information system, can solve problems such as affecting business functions, loss of object integrity, etc., to achieve the effect of good user experience

Active Publication Date: 2017-09-05
NANJING NARI GROUP CORP +1
View PDF16 Cites 22 Cited by
  • Summary
  • Abstract
  • Description
  • Claims
  • Application Information

AI Technical Summary

Problems solved by technology

However, this method divides and stores the graphic information of grid equipment in multiple tiles, which loses the integrity of the

Method used


Image

  • Dynamic scheduling and rendering method of voluminous web-end television-network resource GIS data
  • Dynamic scheduling and rendering method of voluminous web-end television-network resource GIS data
  • Dynamic scheduling and rendering method of voluminous web-end television-network resource GIS data

Examples


Example Embodiment

[0049] Specific rules can be formulated based on the above principles according to actual application requirements. The following table is a specific example of display rules:

[0050]

[0051]

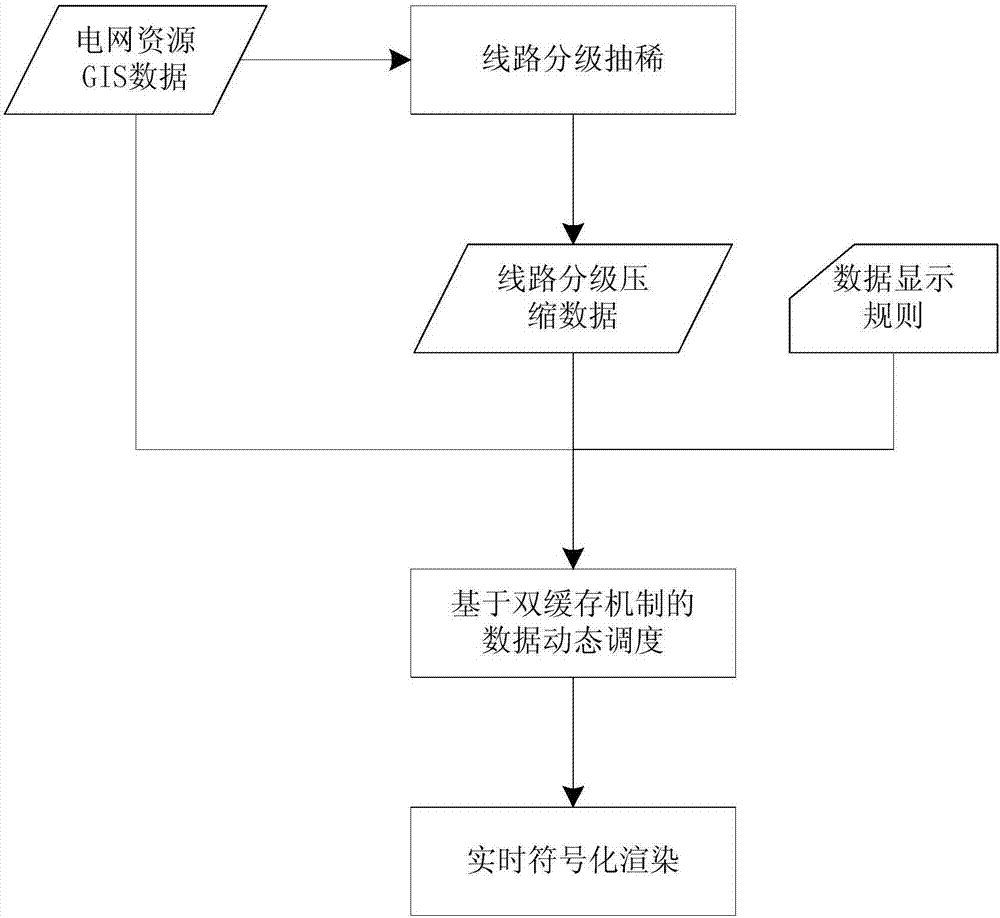
[0052] 2. Line data compression

[0053] Lines include overhead lines and cables. In the application of power GIS, the line is the key information displayed on the large-scale map. Due to the huge amount of line data, in the present invention, the Douglas-Pocke algorithm is used to perform hierarchical compression on it in advance, that is, different degrees of node thinning are performed on lines in different scale ranges. The following table is a specific example of a hierarchical compression rule:

[0054]

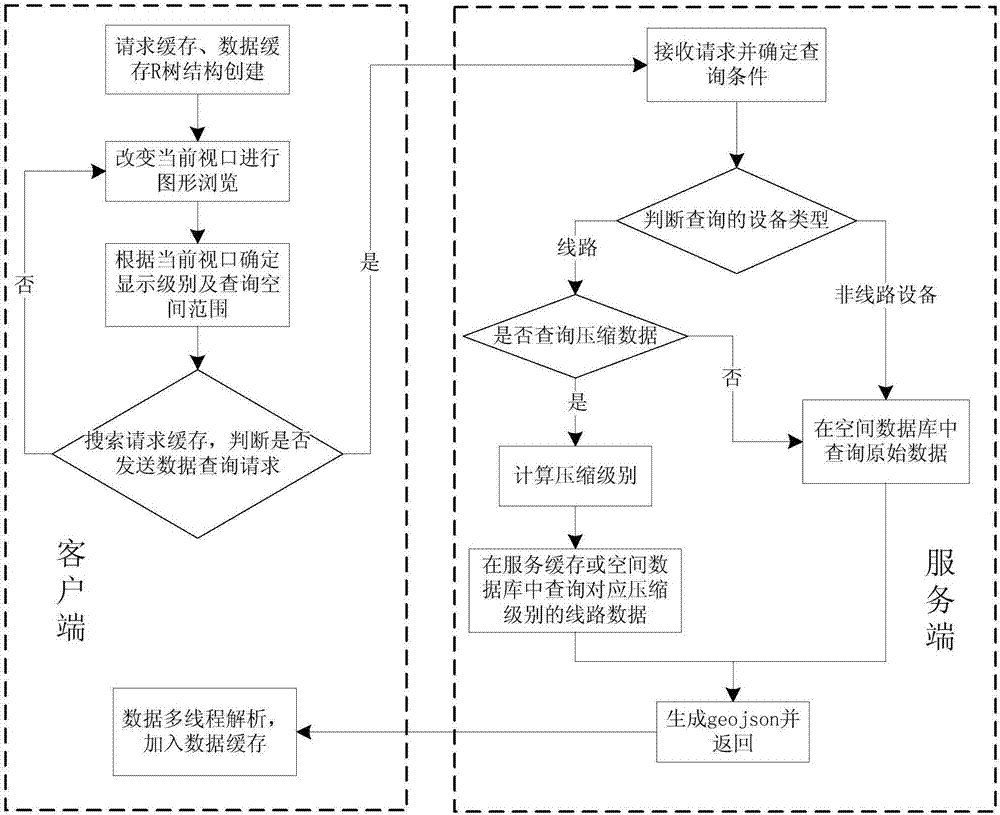
[0055] 3. Data dynamic scheduling

[0056] The implementation process of data scheduling is as follows: figure 2 Shown:

[0057] (3-1) The client creates a request cache and a data cache container, and the container adopts an R tree structure;

[0058] (3-2) Th...


PUM


Abstract

The invention discloses a dynamic scheduling and rendering method of voluminous web-end television-network resource GIS data. The method includes the steps of (1) making hierarchical display rules of the television-network resource GIS data, and displaying different equipment types and voltage classes in different measuring scale ranges; (2) conducting classified compression on line data in different measuring scale range; (3) according to the viewport scope, conducting dynamic data dispatching through a client side; (4) constructing images on drawing canvas of a map to achieve real-time signified rendering. By using the dynamic scheduling and rendering method of voluminous web-end television-network resource GIS data, fluency, interactivity and flexibility of the existing electric power GIS application in the aspect of Web graphic display are extremely improved, as well as user experience.

Description

technical field [0001] The invention relates to a method for dynamically dispatching and rendering GIS data of massive power grid resources on a Web end, and belongs to the technical field of electric power geographic information systems (GIS). Background technique [0002] The graphic display of power grid equipment is the basic function of power GIS applications. Its realization on the Web side mainly faces two problems. One is the large amount of data: According to statistics, the data volume of transmission, transformation and distribution power grid equipment in most provinces in the country has reached thousands. The second is that there are many types of power grid equipment symbols and complex graphics: there are hundreds of types of equipment that need to be displayed in the power grid GIS, and each type of equipment has specific symbols, many of which are complex in composition. Therefore, realizing the rapid display of power grid graphics on the Web side under the...

Claims


Application Information

Patent Timeline
IPC IPC(8): G06F17/30G06Q50/06
CPCG06F16/29G06F16/9577G06Q50/06
Inventor 程伟钱蔚庞宇杨文彬毕思斯胡秋翔崇殿兵
Owner NANJING NARI GROUP CORP
Why Eureka
Try Eureka