Method and apparatus for displaying data information in diagram, and electronic equipment

A technology of data information and charts, applied in the computer field, can solve problems such as inability to intuitively obtain blocked information, waste of terminal device interface space, and affect user operating experience, so as to improve operating experience, avoid occlusion, and avoid waste.

Inactive Publication Date: 2018-11-02
ADVANCED NEW TECH CO LTD
View PDF5 Cites 3 Cited by
  • Summary
  • Abstract
  • Description
  • Claims
  • Application Information

AI Technical Summary

Problems solved by technology

However, such a display method needs to display the prompt box separately in the chart, resulting in a waste of interface space of the terminal device
Especially when displaying charts on a mobile terminal, since the screen itself of the mobile terminal is small, it will be more likely to cause a waste of interface space, and the prompt box may block other information in the chart, so that the user cannot intuitively obtain the blocked information. Information that affects the user's operating experience

Method used


Image

  • Method and apparatus for displaying data information in diagram, and electronic equipment
  • Method and apparatus for displaying data information in diagram, and electronic equipment
  • Method and apparatus for displaying data information in diagram, and electronic equipment

Examples


Embodiment Construction

[0037] In order to enable those skilled in the art to better understand the technical solutions in the present application, the technical solutions in the embodiments of the present application will be clearly and completely described below in conjunction with the drawings in the embodiments of the present application. Obviously, the described The embodiments are only some of the embodiments of the present application, but not all of them. Based on the embodiments in this application, all other embodiments obtained by persons of ordinary skill in the art without creative efforts shall fall within the scope of protection of this application.

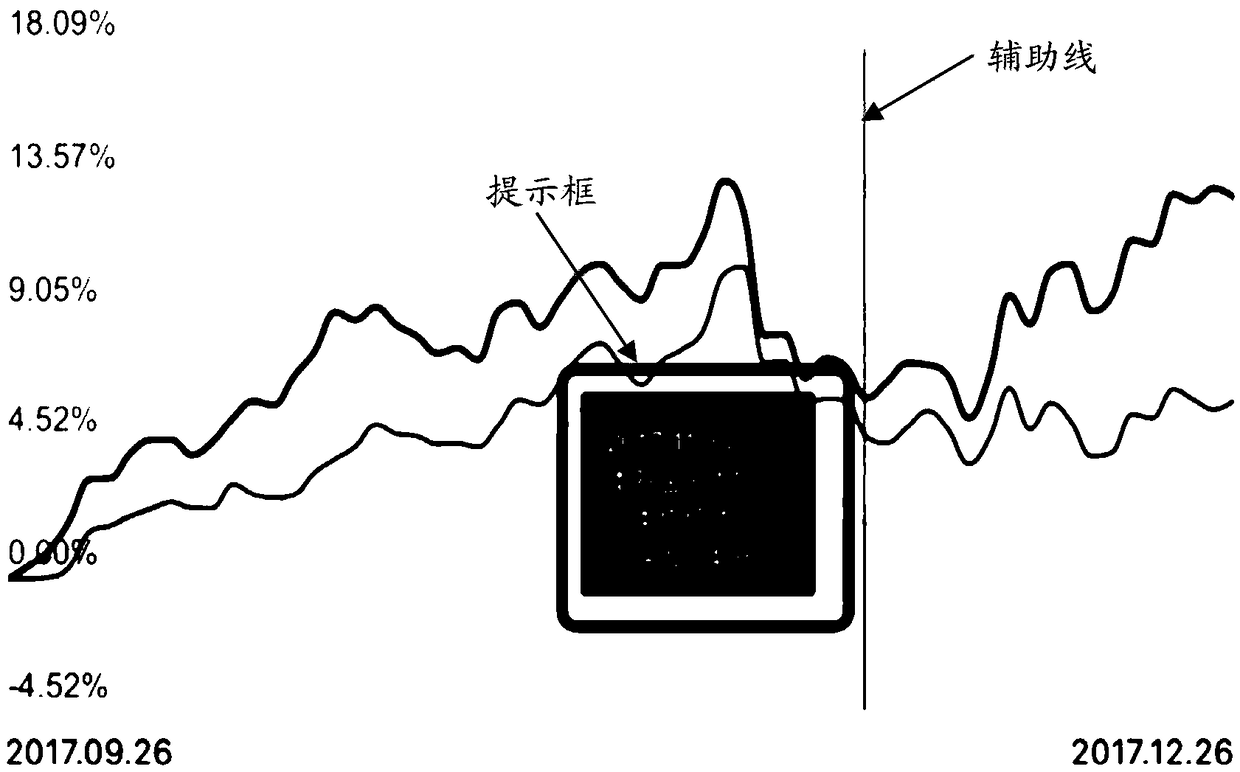
[0038] figure 1 is a schematic diagram of a method for displaying data information in an icon in the prior art. Such as figure 1 As shown, when the user wants to view the ordinate information corresponding to a certain coordinate point on the abscissa axis, he usually moves the auxiliary line in the chart, and moves the abscissa corresp...


PUM


Abstract

Embodiments of the invention disclose a method and an apparatus for displaying data information in a diagram, and electronic equipment. The method comprises the steps of generating and displaying an auxiliary line in response to a preset operation executed by a user in a drawing area of the diagram; acquiring first data information of a data line in the diagram and a first intersection point of the auxiliary line; and displaying the first data information in a legend area in the diagram.

Description

technical field [0001] The present application relates to the field of computers, and more particularly to a method, device and electronic equipment for displaying data information in charts. Background technique [0002] Data visualization and graphical display are indispensable elements in the current industrial, commercial, and financial fields. Using charts for data visualization can enable people to visually display, compare and analyze data. [0003] At present, in order to enable users to more intuitively obtain the data information of a certain point on the data line in the chart, a prompt box is usually displayed in the drawing area of ​​the chart, and the data information of a certain point on the data line is displayed in the prompt box . However, such a display method needs to display a prompt box separately in the chart, which causes a waste of interface space of the terminal device. Especially when displaying charts on a mobile terminal, since the screen its...

Claims


Application Information

Patent Timeline
Patent Type & Authority Applications(China)
IPC IPC(8): G06T11/20
CPCG06T11/206
Inventor 张书健
Owner ADVANCED NEW TECH CO LTD
Why Eureka
Try Eureka