A visual data analysis method and system

A technology of data analysis and analysis methods, applied in the field of data processing to achieve easy-to-understand results

Active Publication Date: 2020-01-24
SHANGHAI DEV CENT OF COMP SOFTWARE TECH
View PDF5 Cites 0 Cited by
  • Summary
  • Abstract
  • Description
  • Claims
  • Application Information

AI Technical Summary

Problems solved by technology

[0004] The purpose of the present invention is to provide a visual data analysis method and system to solve the data analysis problem of large-scale, high-dimensional data

Method used


Image

  • A visual data analysis method and system
  • A visual data analysis method and system
  • A visual data analysis method and system

Examples


Embodiment Construction

[0060] The following will clearly and completely describe the technical solutions in the embodiments of the present invention with reference to the accompanying drawings in the embodiments of the present invention. Obviously, the described embodiments are only some, not all, embodiments of the present invention. Based on the embodiments of the present invention, all other embodiments obtained by persons of ordinary skill in the art without making creative efforts belong to the protection scope of the present invention.

[0061] In order to make the above objects, features and advantages of the present invention more comprehensible, the present invention will be further described in detail below in conjunction with the accompanying drawings and specific embodiments.

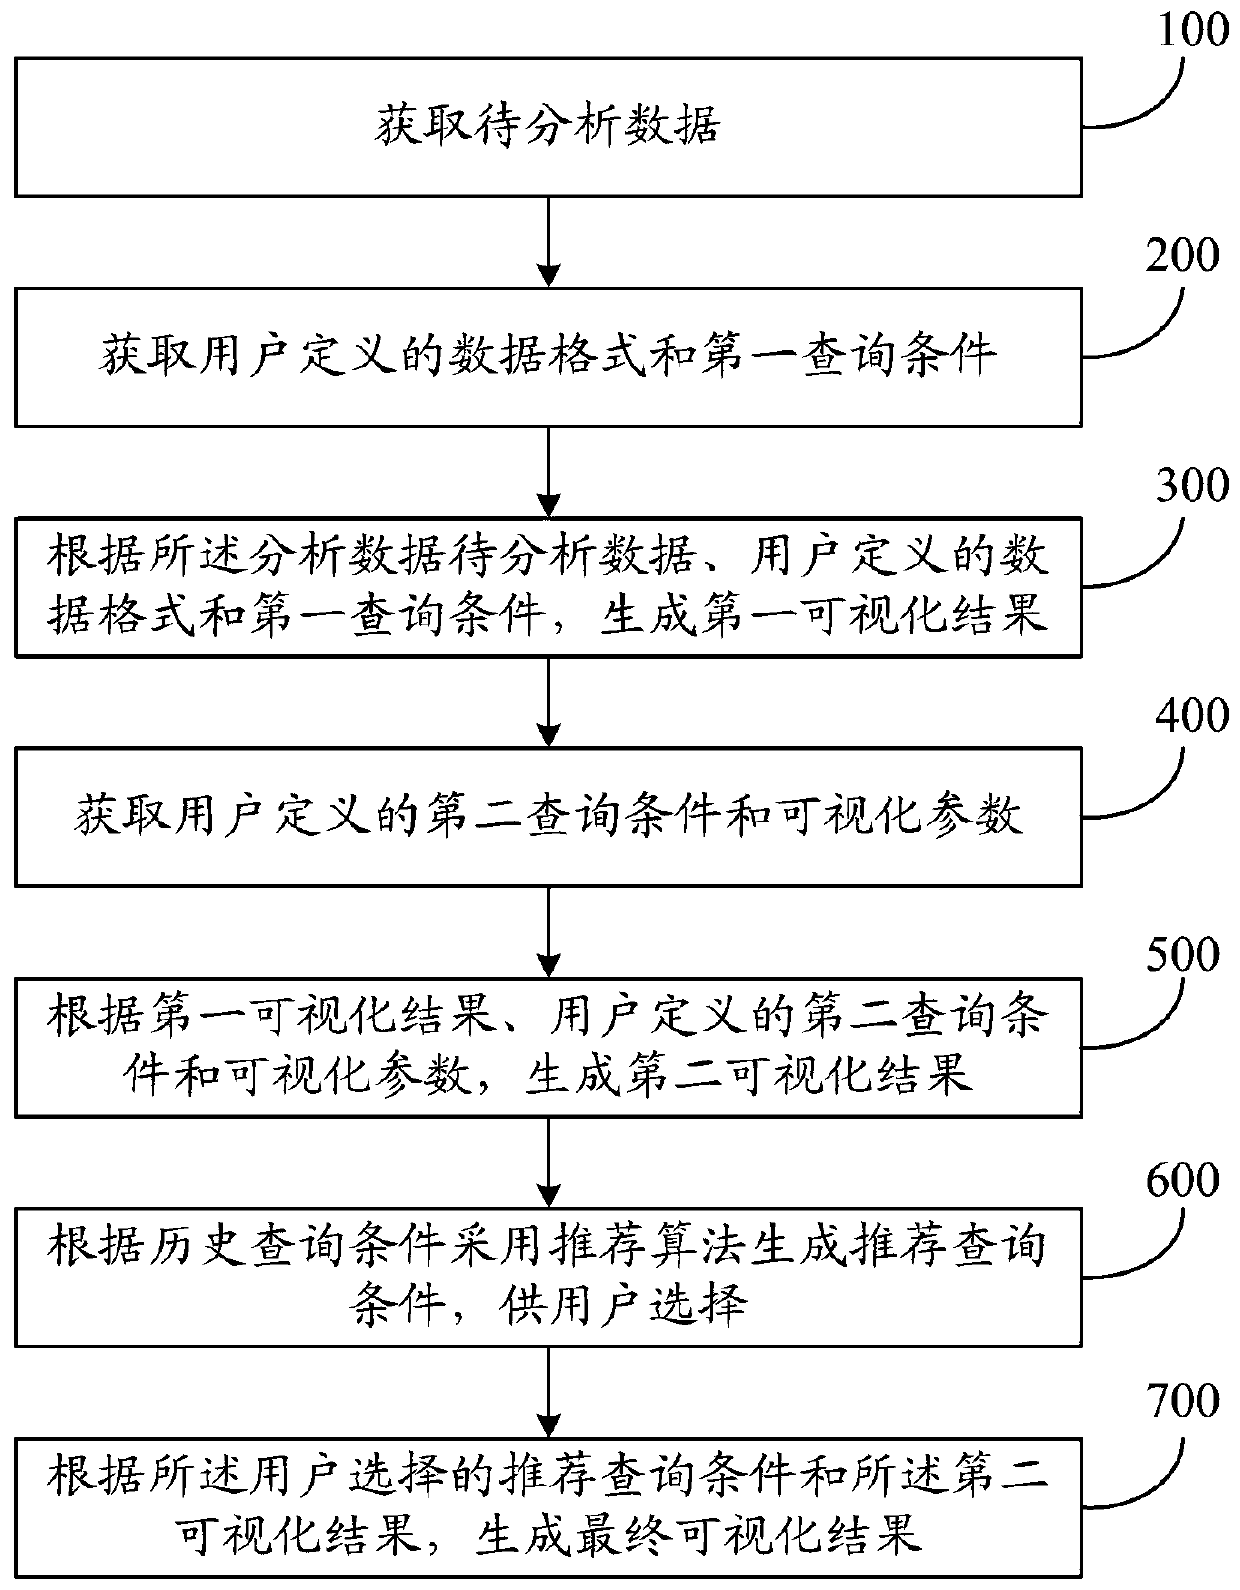
[0062] figure 1 It is a schematic flow chart of the visualized data analysis method of the present invention. Such as figure 1 Shown, described analysis method comprises the following steps:

[0063] Step 100: ...


PUM


Abstract

A method and system are provided for data analysis with visualization. The method includes; generating a visual result; generating a second visual result according to the second query condition and the visual parameter; generating a recommended query condition; and generating a final visual result according to the recommended query condition selected by the user. By using the analysis method or system in the present invention, a new query in which the user may be interested is generated based on an original user query, to guide the user to quickly understand knowledge hidden in the data. An analysis result is presented to the user visually, and is more visual, clearer, and easier to understand compared with a numerical calculation result. In addition, the result can be displayed by using a variety of graphics.

Description

technical field [0001] The invention relates to the field of data processing, in particular to a visualized data analysis method and system. Background technique [0002] The rapid development of information technology has given birth to the era of big data. Big data has become a new non-material production factor after human and capital. As the scale of data expands, it becomes more and more difficult to understand and analyze the data. Various forms of data are stored in various forms, and it is difficult for people to find useful knowledge from these massive data, because it is impossible to carefully examine all the data with human energy. [0003] Data visualization technology can convert data into graphics or images and display them on the screen, which can help users better understand data and achieve better data analysis on the basis of data understanding. Therefore, visualization is a powerful auxiliary means of data analysis. On the one hand, the multi-scale, he...

Claims


Application Information

Patent Timeline
Patent Type & Authority Patents(China)
IPC IPC(8): G06F16/903G06F16/9038G06F16/2457
CPCG06F16/26G06F16/24539G06F16/248
Inventor 蔡立志陈敏刚陈文捷刘振宇胡芸吴建华宋巍陈达丽邬斌亮凌良合
Owner SHANGHAI DEV CENT OF COMP SOFTWARE TECH
Why Eureka
Try Eureka