A method of visualizing and quantifying regional contradictions

A contradiction and regional technology, applied in the field of visualization and quantification of regional contradictions, can solve problems such as users who do not understand technology and are afraid of big data vocabulary and concepts, and achieve the effect of overcoming technical difficulties

Pending Publication Date: 2018-12-21
成都智库二八六一信息技术有限公司
View PDF3 Cites 0 Cited by
  • Summary
  • Abstract
  • Description
  • Claims
  • Application Information

AI Technical Summary

Benefits of technology

This technology allows users to create special patterns on large amounts of data without being able to perceive any differences or inconsistencies due to different factors like location within their own country. It achieves this through mapped indicia onto certain regular forms made up beforehand. These formations help explain how local areas have been overlapped during gaps caused by other parts of the world's economy. Additionally, it helps researchers analyze multidimensional datasets quickly while still looking backward towards what they found earlier. Overall, these techniques make it easier than previous methods such as plotting graphs into diagrams, filling spaces around curves, etc., which were time-consuming processes.

Problems solved by technology

This patented technology describes different aspects related to analyzing complex issues with Big Data: One aspect being discussed is the complexity involved when trying to interpret specific areas within an area called District A (the region where there may have conflicting values). Current methods for gathering data from this zone often result in complicated calculations due to high volume of irrelevant data. Additionally, these techniques only work on small datasets without considering their impact upon larger databases like LANXELLCADAMS.

Method used


Image

  • A method of visualizing and quantifying regional contradictions

Examples


Embodiment 1

[0017] The present invention provides a method for visualizing and quantifying regional contradictions, including the following steps:

[0018] (1) Set n key indicators that logically support regional contradictions, and then quantify these key indicators with numerical values, so that one key indicator corresponds to a numerical value, and complete normalization; where n is a natural number greater than 3.

[0019] (2) According to the n values ​​of the n key indicators, obtain n lines with the same length as the n values, and connect the n lines to the center point of the preset regular n-gon and the vertices of the interior angles After the connection is completed, n-gons with different interior angles are obtained. Since the lengths of the n lines are independent of each other, the distance between each corner of the n-gon is different from the center point, which is visually reflected in the degree of convexity and concaveness. , so as to realize the visualization of the ...

Embodiment 2

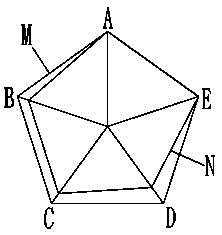
[0028] This implementation combines the attached figure 1 The specific implementation method of the present invention is illustrated by way of example:

[0029] 1. Use the five key indicators of forehand ability A, backhand ability B, near-table ability C, far-table ability D and speed E to describe the technical level of a table tennis player. The top level is normalized to 100%, and 0% means the lowest Level.

[0030] 2. It is assumed that the technical level of Chinese player M is top-notch in five key indicators, all of which are 100%. After adopting the method of the present invention, a regular pentagon is obtained.

[0031] 3. Set the Japanese player N, whose key index value of forehand ability A is 100%, the key index value of backhand ability B is 80%, the key index value of near-table ability C is 80%, and the key index value of far-table ability D is The index value is 75%, and the key index value of speed E is 100%. After adopting the method of the present invent...


PUM


Abstract

The invention discloses a method for visualizing and quantifying regional contradictions, comprising the following steps: (1) setting n key indexes logically supporting the regional contradictions, quantifying the key indexes by numerical value, and completing normalization; (2) according to the n values of n key indexes, the n connecting lines with the same length as the n values are obtained. The n connecting lines are connected to the center point of the preset positive n-gon and the vertex of the inner angle respectively. After the connection is completed, the n-gon with different inner angle can be obtained, and the visualization of the unbalance degree and the insufficiency degree in the regional contradiction can be realized. (3) Calculate the area and angle of the n-sided shape according to the n-sided shape, and realize the quantization of the unbalance degree and the insufficiency degree in the region contradiction. The invention can map the index of logically supporting regional contradiction to a concrete model, visualize the regional contradiction, allow the unbalance degree and the insufficiency degree to be both quantified and visualized, and overcome the current technical problems.

Description


Claims


Application Information

Patent Timeline
Owner 成都智库二八六一信息技术有限公司
Why Eureka
Try Eureka